


 |
市場調查報告書
商品編碼
2073593
美國微量元素肥料:市佔率分析、產業趨勢與統計及成長預測(2026-2031 年)United States Micronutrient Fertilizer - Market Share Analysis, Industry Trends & Statistics, Growth Forecasts (2026 - 2031) |
||||||

※ 本網頁內容可能與最新版本有所差異。詳細情況請與我們聯繫。
根據 Mordor Intelligence 預測,美國微量元素肥料市場規模預計將從 2025 年的 3.5877 億美元成長到 2026 年的 3.8597 億美元,到 2031 年將達到 5.4202 億美元,2026 年至 2031 年的複合年成長率為 7.03%。
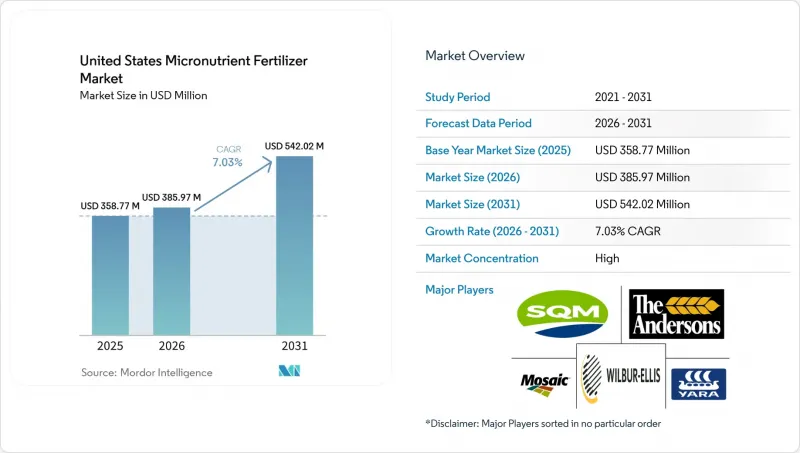
本報告按產品(硼、銅、鐵、錳、鉬、鋅及其他)、形態(常規型和特殊型)、施用方法(施肥/灌溉、葉面噴布和土壤施用)以及作物類型(田間作物、園藝作物和草坪/觀賞作物)進行分類。市場預測以價值(美元)和數量(公噸)表示。
美國微量元素肥料市場的趨勢與洞察
透過精準施用施用微量營養素
變數噴霧器和液體輸液設備現在能夠一次施用每英畝0.5至4磅的鋅、硼或混合肥料,並可根據網格抽樣和產量測繪確定的空間差異進行調整。大學田間試驗顯示,與均勻施肥相比,養分利用效率提高了15%至25%,總施用量也減少了。設備製造商正在透過將微量元素模組整合到現有設備中,加速美國微量元素肥料市場對這類產品的推廣,從而降低額外成本。零售農藝師正在利用數據層來記錄環境效益,以支持美國農業部項目和碳排放登記計劃,進一步增強農民的地位。
已確認鋅和硼缺乏
土壤調查顯示,內布拉斯加州東部47%的農地鋅含量低於臨界閾值,31%的農地硼含量也偏低。產量增加、鋅與磷的拮抗作用以及耕作方式的簡化進一步加劇了這些元素缺乏的風險。隨著美國微量元素肥料市場轉向每3-4年進行一次常規的葉面和土壤診斷,對顆粒狀硫酸鋅、硼酸和螯合劑的需求正在成長。農業科學家估計,矯正嚴重的微量元素缺乏症可使玉米產量每英畝增加10-20蒲式耳,輕鬆收回每英畝15-25美元的微量元素投入。
NPK肥料的價格差異
微量元素施用與傳統NPK肥料的成本差異,對利潤微薄、耕種面積廣的農民而言構成了經濟障礙。微量元素混合肥料每英畝成本為15至25美元,而NPK肥料的成本僅為8至12美元。由於大田作物的利潤通常在每英畝50至150美元左右,因此,除非產量能顯著提高,否則生產者往往不願意採用微量元素補充劑。雖然檢驗結果表明,玉米每英畝增產3至5蒲式耳,大豆每英畝增產1至2蒲式耳即可帶來收益,但不同土壤類型的增產效果並不一致。這限制了美國明顯缺乏微量元素的田地採用微量元素補充劑。
細分市場分析
到2025年,鋅將佔據美國微量元素肥料市場31.5%的最大佔有率。這主要得益於鋅在玉米、大豆和小麥生產中的廣泛應用,而高產栽培系統中鋅缺乏症仍然普遍存在。缺鋅和鹼性土壤的持續需求,以及高pH值灌溉條件,進一步鞏固了鋅的地位。銅也因其營養價值以及在玉米、大豆和特種作物生產中的特定作物保護方案中的應用,仍然是一個重要的產品類型。另一方面,儘管硼的應用範圍相對較窄,但在易缺乏硼的地區,硼仍備受關注。
鉬雖然規模較小,但卻是成長最快的產品類型,預計2031年將以7.3%的複合年成長率成長。這一成長主要得益於人們對生物固氮和氮利用效率的日益關注,尤其是在豆科作物生產系統中。目前正在進行的機械改質鉬鋅複合材料的研究,其具有緩釋養分輸送特性,有望推動該領域未來的產品創新。此外,第二代螯合劑和乾粉分散劑配方的進步提高了其在鈣質土壤中的施肥效果,為高階定價創造了機會。加州的特種作物種植者擴大採用多種微量元素混合施肥方案,他們更傾向於選擇在滴灌和空中噴灑中具有優異罐內穩定性的混合肥料,這進一步推動了微量元素市場的擴張。
由於成本低廉且供應廣泛,傳統硫酸鹽、氧化物和鹼式鹽類肥料在2025年佔據了美國微量元素肥料市場76.3%的佔有率。儘管它們佔據主導地位,但預計到2031年,特種肥料產品仍將以6.6%的複合年成長率成長。液體配方肥料可與除草劑搭配使用,實現均勻且可變的施用,而緩釋包衣則可減少養分淋溶和土壤固定。這在佛羅裡達州沙質柑橘園中尤其重要。水溶性粉劑肥料可促進園藝和草坪管理中的葉面吸收。田間試驗表明,產量提高和物流簡化能夠抵消價格溢價,尤其是在碳排放計畫認可效率提升帶來的附加價值的情況下。
聚合物包覆和奈米封裝技術的進步正在推動產品差異化,供應商的目標是在基礎通用產品之外擴大利潤空間。市場領導者對專有化學技術的投資表明,其策略正向特種產品領域轉移,這正在推動整個美國微量元素肥料行業的發展。
其他好處:
- Excel格式的市場預測(ME)表
- 3個月的分析師支持
目錄
第1章:引言
- 研究假設和市場定義
- 調查範圍
- 調查方法
第2章:本報告的內容
第3章:執行摘要和主要發現
第4章:主要產業趨勢
- 主要農作物種植面積
- 大田作物
- 園藝作物
- 平均施肥量
- 微量營養素
- 田間作物
- 園藝作物
- 微量營養素
- 法律規範
- 價值鍊和通路分析
- 市場促進因素
- 透過精準施肥施用微量元素正變得越來越普遍。
- 玉米帶地區土壤中鋅和硼的缺乏情況加劇
- 加州和佛羅裡達州特色作物種植面積擴大
- 美國農業部的成本分攤計畫涵蓋微量營養素計畫。
- 針對低 pH 值土壤的行間施用螯合劑混合物的出現。
- 碳權計畫鼓勵提高養分利用效率。
- 市場限制因素
- 與 NPK 化肥相比,其較高的價格阻礙了其廣泛應用。
- 玉米和大豆價格波動對投入成本的影響
- 與磷酸鹽基起動劑進行罐式混合的兼容性問題。
- 大型生產商中出現了一種向可再生「材料減少」轉變的趨勢
第5章 市場規模與成長預測
- 產品
- 硼
- 銅
- 鐵
- 錳
- 鉬
- 鋅
- 其他
- 形式
- 傳統的
- 專業領域
- CRF
- 液體肥料
- SRF
- 水溶性
- 目的
- 土壤
- 葉面噴布
- 施肥和灌溉
- 作物類型
- 田間作物
- 園藝作物
- 草坪和觀賞植物
第6章 競爭情勢
- 關鍵策略趨勢
- 市佔率分析
- 企業狀況
- 公司簡介
- The Mosaic Company
- The Andersons Inc.
- Yara International ASA
- Wilbur-Ellis Company LLC
- Sociedad Quimica y Minera de Chile SA
- Nutrien Ltd.
- Helena Agri-Enterprises LLC(Marubeni Corp.)
- Brandt Inc.
- Koch Agronomic Services(Koch Industries Inc.)
- Nouryon
- Haifa Group
- ICL Group Ltd.
- BASF SE
第7章 化肥產業執行長面臨的關鍵策略挑戰
According to Mordor Intelligence, the united states micronutrient fertilizer market size is projected to grow from USD 358.77 million in 2025 to USD 385.97 million in 2026 and is forecast to reach USD 542.02 million by 2031 at 7.03% CAGR over 2026-2031.
This report is Segmented by Product (Boron, Copper, Iron, Manganese, Molybdenum, Zinc, Others), Form (Conventional and Specialty), Application Mode (Fertigation, Foliar, Soil), and Crop Type (Field Crops, Horticultural Crops, Turf & Ornamental). The Market Forecasts are Provided in Terms of Value (USD) and Volume (Metric Tons).
United States Micronutrient Fertilizer Market Trends and Insights
Precision-Rate Micronutrient Application
Variable-rate spreaders and liquid injectors now deliver zinc, boron, or blended packages at 0.5-4 lb per acre within a single pass, matching spatial variability identified through grid sampling and yield maps. University field trials show 15-25% higher nutrient-use efficiency and lower total applied pounds relative to uniform rates. Equipment makers bundle micronutrient modules into existing hardware, cutting incremental costs and accelerating adoption across the United States micronutrient fertilizers market. Retail agronomists leverage the data layer to document environmental benefits for USDA programs and carbon registries, further strengthening farmers.
Documented zinc and boron shortages
Soil surveys reveal 47% of eastern Nebraska fields below critical zinc thresholds, with 31% also lacking boron. Higher yields, phosphorus antagonism, and minimal tillage intensify the risks of shortages. As the United States micronutrient fertilizers market pivots toward routine tissue and soil diagnostics every three to four years, demand for granular zinc sulfate, boric acid, and chelated liquids rises. Agronomists calculate that correcting severe deficiencies can add 10-20 bushels per acre in corn, easily covering an extra USD 15-25 per-acre expenditure on micronutrients.
Price premium versus N-P-K
The cost differential between micronutrient applications and traditional N-P-K fertilizers creates economic resistance among broad-acre farmers operating on thin profit margins. Micronutrient blends cost USD 15-25 per acre, compared to USD 8-12 for N-P-K. With row-crop margins often ranging from USD 50 to USD 150 per acre, growers hesitate unless a clear yield improvement is proven. Trials indicate a break-even point at 3-5 bushels per acre (bu) corn or 1-2 bushels per acre (bu) soybean yield gains, with results not uniform across soil types . This restraint limits the penetration of United States micronutrient fertilizers into clearly deficient fields.
Other drivers and restraints analyzed in the detailed report include:
- Specialty-crop acreage expansion
- USDA cost-share for micronutrient plans
- Tank-mix issues with phosphate starters
For complete list of drivers and restraints, kindly check the Table Of Contents.
Segment Analysis
Zinc held the largest United States micronutrient fertilizers market share at 31.5% in 2025, supported by widespread use across corn, soybean, and wheat production, where zinc deficiencies remain common in high-yielding systems. Sustained demand from zinc-deficient and alkaline soils, coupled with high-pH irrigation conditions, reinforces its position. Copper also remains an important product category due to its nutritional benefits and use in certain crop protection programs across corn, soybean, and specialty crop production, while boron continues to gain traction in deficiency-prone regions despite its relatively narrow application margins.
Molybdenum, though a smaller segment, is the fastest-growing product category, with a projected CAGR of 7.3% through 2031. Growth is driven by increasing emphasis on biological nitrogen fixation and nitrogen-use efficiency, particularly in legume production systems. Ongoing research into mechanochemically modified Mo-Zn composites with slow-release nutrient delivery characteristics may support future product innovation within the segment. Additionally, advancements in second-generation chelates and dry dispersible powder formulations improve performance in calcareous soils, enabling premium pricing opportunities. Specialty growers in California are increasingly adopting multi-micronutrient application programs that favor tank-stable blends for both drip and aerial applications, supporting broader micronutrient market expansion.
Conventional sulfates, oxides, and basic salts accounted for 76.3% of the United States micronutrient fertilizer market size in 2025, due to their low cost and broad availability. Despite dominance, specialty forms are growing at a 6.6% CAGR through 2031. Liquids enable uniform, variable-rate placement alongside herbicides, while controlled-release coatings reduce leaching and soil tie-up, which is critical in sandy Florida citrus groves. Water-soluble powders boost foliar uptake for horticulture and turf managers. Field evidence shows yield benefits and simplified logistics offsetting premiums, especially where carbon programs grant additional value for efficiency gains.
Advances in polymer coatings and nano-encapsulation drive differentiation as suppliers seek to expand their margins beyond basic commodities. Investments in proprietary chemistries by market leaders signal a strategic pivot to specialty value pools, elevating the overall sophistication of the United States micronutrient fertilizers industry.
Complete Report Scope:
- Product
- Boron
- Copper
- Iron
- Manganese
- Molybdenum
- Zinc
- Others
- Form
- Conventional
- Speciality
- CRF
- Liquid Fertilizer
- SRF
- Water Soluble
- Application
- Soil
- Foliar
- Fertigation
- Crop Type
- Field Crops
- Horticultural Crops
- Turf & Ornamental
List of Companies Covered in this Report:
- The Mosaic Company
- The Andersons Inc.
- Yara International ASA
- Wilbur-Ellis Company LLC
- Sociedad Quimica y Minera de Chile SA
- Nutrien Ltd.
- Helena Agri-Enterprises LLC (Marubeni Corp.)
- Brandt Inc.
- Koch Agronomic Services (Koch Industries Inc.)
- Nouryon
- Haifa Group
- ICL Group Ltd.
- BASF SE
Additional Benefits:
- The market estimate (ME) sheet in Excel format
- 3 months of analyst support
TABLE OF CONTENTS
1 INTRODUCTION
- 1.1 Study Assumptions & Market Definition
- 1.2 Scope of the Study
- 1.3 Research Methodology
2 REPORT OFFERS
3 EXECUTIVE SUMMARY & KEY FINDINGS
4 KEY INDUSTRY TRENDS
- 4.1 Acreage Of Major Crop Types
- 4.1.1 Field Crops
- 4.1.2 Horticultural Crops
- 4.2 Average Nutrient Application Rates
- 4.2.1 Micronutrients
- 4.2.1.1 Field Crops
- 4.2.1.2 Horticultural Crops
- 4.2.1 Micronutrients
- 4.3 Regulatory Framework
- 4.4 Value Chain & Distribution Channel Analysis
- 4.5 Market Drivers
- 4.5.1 Precision-Rate Micronutrient Application Gains Traction
- 4.5.2 Rising Zinc and Boron Deficiencies in Corn Belt Soils
- 4.5.3 Expansion of Specialty-Crop Acreage in California and Florida
- 4.5.4 USDA Cost-Share Programs Cover Micronutrient Plans
- 4.5.5 Emergence of In-Furrow Chelated Blends for Low-pH Soils
- 4.5.6 Carbon-Credit Programs Reward Higher Nutrient-Use Efficiency
- 4.6 Market Restraints
- 4.6.1 Price Premium Versus N-P-K Discourages Broad-Acre Adoption
- 4.6.2 Volatility in Corn and Soybean Prices Affecting Input Spend
- 4.6.3 Tank-Mix Compatibility Issues with Phosphate Starters
- 4.6.4 Regenerative "Input-Light" Movements Among Large Growers
5 MARKET SIZE AND GROWTH FORECASTS (VALUE AND VOLUME)
- 5.1 Product
- 5.1.1 Boron
- 5.1.2 Copper
- 5.1.3 Iron
- 5.1.4 Manganese
- 5.1.5 Molybdenum
- 5.1.6 Zinc
- 5.1.7 Others
- 5.2 Form
- 5.2.1 Conventional
- 5.2.2 Speciality
- 5.2.2.1 CRF
- 5.2.2.2 Liquid Fertilizer
- 5.2.2.3 SRF
- 5.2.2.4 Water Soluble
- 5.3 Application
- 5.3.1 Soil
- 5.3.2 Foliar
- 5.3.3 Fertigation
- 5.4 Crop Type
- 5.4.1 Field Crops
- 5.4.2 Horticultural Crops
- 5.4.3 Turf & Ornamental
6 COMPETITIVE LANDSCAPE
- 6.1 Key Strategic Moves
- 6.2 Market Share Analysis
- 6.3 Company Landscape
- 6.4 Company Profiles
- 6.4.1 The Mosaic Company
- 6.4.2 The Andersons Inc.
- 6.4.3 Yara International ASA
- 6.4.4 Wilbur-Ellis Company LLC
- 6.4.5 Sociedad Quimica y Minera de Chile SA
- 6.4.6 Nutrien Ltd.
- 6.4.7 Helena Agri-Enterprises LLC (Marubeni Corp.)
- 6.4.8 Brandt Inc.
- 6.4.9 Koch Agronomic Services (Koch Industries Inc.)
- 6.4.10 Nouryon
- 6.4.11 Haifa Group
- 6.4.12 ICL Group Ltd.
- 6.4.13 BASF SE
7 KEY STRATEGIC QUESTIONS FOR FERTILIZER CEOS

 歐洲微量元素肥料:市佔率分析、產業趨勢與統計及成長預測(2026-2031 年)中東和非洲微量元素肥料:市場佔有率分析、行業趨勢和統計數據以及成長預測(2026-2031 年)北美微量元素肥料:市佔率分析、產業趨勢與統計及成長預測(2026-2031 年)南美洲微量元素肥料:市佔率分析、產業趨勢與統計及成長預測(2026-2031 年)亞太地區微量元素肥料:市佔率分析、產業趨勢與統計及成長預測(2026-2031)印度微量元素肥料:市場佔有率分析、產業趨勢與統計及成長預測(2026-2031)中國微量元素肥料:市佔率分析、產業趨勢與統計及成長預測(2026-2031)微量元素肥料:市佔率分析、產業趨勢與統計、成長預測(2026-2031)
 2026年全球微量元素肥料市場報告
 微量元素肥料市場報告:趨勢、預測與競爭分析(至2031年)