


 |
市場調查報告書
商品編碼
2073609
北美微量元素肥料:市佔率分析、產業趨勢與統計及成長預測(2026-2031 年)North America Micronutrient Fertilizer - Market Share Analysis, Industry Trends & Statistics, Growth Forecasts (2026 - 2031) |
||||||

※ 本網頁內容可能與最新版本有所差異。詳細情況請與我們聯繫。
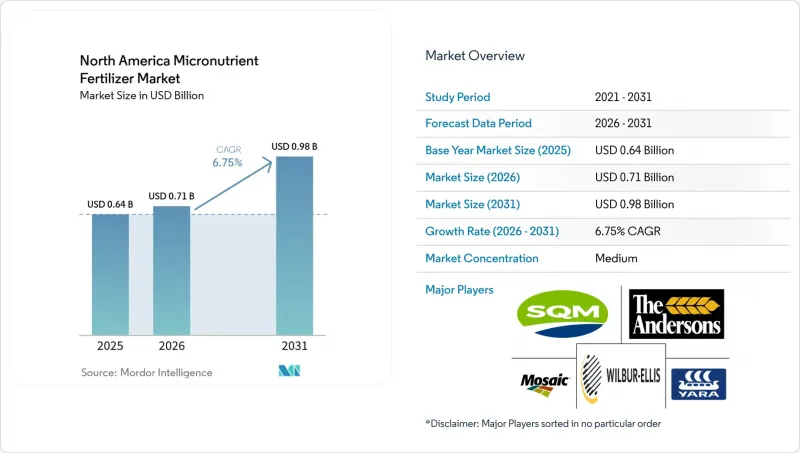
根據 Mordor Intelligence 預測,北美微量元素肥料市場規模將從 2025 年的 6.4 億美元成長到 2026 年的 7.1 億美元,到 2031 年將達到 9.8 億美元,2026 年至 2031 年的複合年成長率為 7.16%。
本報告按產品(硼、銅、鋅等)、形態(常規型和特殊型)、特殊型(液體肥料等)、施用方法(施肥、灌溉、葉面噴布等)、作物類型(田間作物、園藝作物等)和地區(加拿大、美國等)進行細分。市場預測以價值(美元)和數量(公噸)表示。
北美微量元素肥料市場的趨勢與洞察
土壤檢測結果證實土壤微量元素缺乏加劇。
根據檢測報告,2024年檢測的土壤中,35%有缺鋅問題,高於四年前的28%。缺鋅玉米田的產量損失高達15%至20%,凸顯了其經濟影響。在pH值較高的草地土壤中,這個問題尤其嚴重,因為鹼性環境會將微量元素鎖定在無法被人體吸收的形式中。在砂質土壤和高降雨量地區,硼的流失也呈現類似的趨勢,淋溶作用加速了硼的流失。種植者現在正將針對特定地塊的處方箋納入種植和施肥實踐中,使微量元素的施用成為核心要素,而不僅僅是補救措施。這種數據驅動的轉變正在加速從單一的氮磷鉀複合肥轉向針對特定元素缺乏情況的定向配方的轉變。
對微量營養素的需求不斷成長,導致基因改造作物的種植面積不斷擴大。
到2024年,美國面積的玉米中94%已採用基因改造性狀,同一面積種植的大豆中96%也已採用基因改造性狀。蛋白質含量較高的新型雜交品種需要約多25%的鋅和錳,而抗除草劑大豆則需要吸收較多的銅和鐵,以在化學壓力下維持光合作用。種子生產商現在提供基因改造技術和建議營養等級的組合套餐,隨著基因改造性狀應用的增加,對這些組合套餐的需求也在成長。田間試驗也表明,生物技術品種的根系更深,能夠有效地利用土壤深層的養分,但這只有在土壤中微量元素含量充足的情況下才能實現。這為實施營養補充計劃以最大限度地發揮遺傳潛力奠定了基礎。
與典型 NPK 肥料相比,每英畝增加的成本比較
微量元素肥料施用成本為每英畝 35 至 45 美元,而標準 NPK 肥料的施用成本僅為每英畝 8 至 12 美元,兩者價格相差 300% 至 400%。當農產品價格走低時,這會對利潤率造成壓力。簽訂年度租賃協議的租戶往往不願意投資於能夠持續到租賃期結束後的土壤健康項目。目前,一些保險公司提供保險,如果證實存在微量元素缺乏,則會進行賠償,這在一定程度上促進了微量元素肥料的普及。但要廣泛應用,還需要低成本的肥料來源,例如回收硼肥,以及種子和農資供應商提供的獎勵。
細分市場分析
2025年,鋅仍佔據北美微量元素肥料市場最大佔有率,達24.1%。這是因為在pH值高於7.5的鹼性土壤中,天然鋅的含量有限。鋅通常是添加到標準肥料混合物中的首選微量元素,因為其缺乏症狀(生長不良和葉脈間發黃)很容易被種植者識別。銅的市場佔有率位居第二,因為專業和有機種植者重視其兼具養分供應和抗菌作用的雙重特性。鉬緊隨其後,因其在豆科作物固氮中的作用而備受重視,儘管電池製造商給全球供應鏈帶來了壓力。鐵的需求主要透過針對能夠固定天然鐵的高pH值土壤來保障,而錳的需求則主要集中在富含犁地大豆田中。
硼的成長速度最快,預計到2031年將以7.3%的複合年成長率成長,這主要得益於果蔬種植面積的擴大以及買家對果實均勻度要求的提高。鎳和矽等新興元素被歸類為“其他”,但隨著研究揭示它們在密集農業系統中的價值,它們的重要性日益凸顯。螯合技術和無塵顆粒是創新的核心,它們能夠提高生物利用度並降低施用量。這些改善措施不僅緩解了各類農地的成本壓力,也有助於高價值作物達到嚴格的品質標準。供應商也正在測試能夠同時解決多種元素缺乏問題的多元素配方,從而減少人工投入和農田作業頻率。所有這些變化意味著,儘管鋅仍然保持領先地位,但隨著農業知識的傳播,硼和其他新興營養元素仍有提升市場佔有率的空間。
預計到2025年,傳統顆粒狀和粉狀肥料產品將佔總銷售額的78.0%,因為它們無需額外設備或培訓即可適配現有的撒播機和播種機。低廉的生產成本和成熟的供應鏈確保了價格競爭力,這對於需要精確控制投入成本的大規模玉米和大豆農場至關重要。隨著越來越多的田地接受鋅、硼或兩者缺乏的檢測,這些肥料的穩定普及也顯而易見。
特種配方是成長最快的細分市場,預計到2031年將以6.6%的複合年成長率成長。這主要得益於優質作物和精密農業系統的發展,它們透過提高養分利用效率來提升盈利。特種產品透過螯合、緩釋包衣和多元素混合等技術,提高了每磅作物的養分輸送量。這種高效率可以透過減少總施用量和所需的額外田間噴灑次數來抵消較高的產品價格。園藝、有機項目和受控環境設施的生產者能夠接受這種高價,因為他們的作物價值高,並且擁有嚴格的品質標準。此外,持續的產品創新也有助於實現環境目標,降低徑流風險,而徑流風險正日益受到監管機構和買家的關注。
其他好處:
- Excel格式的市場預測(ME)表
- 3個月的分析師支持
目錄
第1章:引言
- 研究假設和市場定義
- 調查範圍
- 調查方法
第2章:本報告的內容
第3章:執行摘要和主要發現
第4章:主要產業趨勢
- 主要農作物種植面積
- 田間作物
- 園藝作物
- 平均施肥量
- 微量營養素
- 配備灌溉設施的農田
- 法律規範
- 價值鍊和通路分析
- 市場促進因素
- 土壤檢測結果證實,土壤中微量元素缺乏症加重。
- 擴大基改作物的種植面積,這些作物對微量元素的需求很高。
- 政府對微量營養素精準施用提供補貼
- 透過整合分銷網路改善零售商的准入管道
- 在室內和垂直農場引入螯合溶液
- 利用電子廢棄物。
- 市場限制因素
- 每英畝成本高:與散裝 NPK 肥料的比較
- 關於藥品中重金屬含量監管規定的不確定性
- 鉬礦供應轉向電池產業
- 缺乏關於營養物質協同作用的諮詢知識
第5章 市場規模與成長預測
- 依產品
- 硼
- 銅
- 鐵
- 錳
- 鉬
- 鋅
- 其他
- 按形式
- 傳統的
- 特種
- 特殊類型
- 液體肥料
- 水溶性
- 透過應用方法
- 施肥和灌溉
- 葉面噴布
- 土壤
- 按作物類型
- 田間作物
- 園藝作物
- 草坪和觀賞植物
- 地區
- 加拿大
- 墨西哥
- 美國
- 其他北美國家
第6章 競爭情勢
- 關鍵策略趨勢
- 市佔率分析
- 企業狀況
- 公司簡介
- The Mosaic Company
- The Andersons Inc.
- Yara International ASA
- Wilbur-Ellis Company LLC
- Sociedad Quimica y Minera de Chile SA
- Nutrien Ltd.
- Compass Minerals International Inc.
- BASF SE
- Helena Agri-Enterprises LLC
- AgroLiquid
- ICL Group Ltd.
- Koch Agronomic Services LLC
- Brandt Consolidated Inc.
- Alltech Crop Science
- Valagro SpA
第7章:化肥產業執行長面臨的關鍵策略挑戰
According to Mordor Intelligence, the north america micronutrient fertilizer market size is projected to grow from USD 0.64 billion in 2025 to USD 0.71 billion in 2026 and is forecast to reach USD 0.98 billion by 2031 at 7.16% CAGR over 2026-2031.
This report is Segmented by Product (Boron, Copper, Zinc, and More), Form (Conventional and Specialty), Specialty Type (Liquid Fertilizer and More), Application Mode (Fertigation, Foliar, and More), Crop Type (Field Crops, Horticultural Crops, and More), and Geography (Canada, United States, and More). The Market Forecasts are Provided in Terms of Value (USD) and Volume (Metric Tons).
North America Micronutrient Fertilizer Market Trends and Insights
Rising Soil Micronutrient Deficiencies Verified by Soil-Test Results
Laboratory reports show zinc deficiency in 35% of tested soils during 2024, up from 28% four years earlier. Yield losses of 15-20% in deficient corn fields highlight the economic hit. High-pH prairie soils worsen the issue because alkaline conditions lock micronutrients in unavailable forms. Similar trends surface for boron on sandy or high-rainfall sites, where leaching intensifies losses. Growers now integrate site-specific prescriptions into seeding and fertilization runs, making micronutrient application a core element rather than a rescue measure. This data-driven shift hastens movement away from blanket NPK blends toward targeted formulas that close observable gaps.
Expansion of GM-Crop Acreage with Higher Micronutrient Requirements
Ninety-four percent of U.S. corn and 96% of soybean acreage used GM traits in 2024. Newer hybrids with enhanced protein need roughly 25% more zinc and manganese, while herbicide-tolerant soybeans pull more copper and iron to maintain photosynthesis under chemical stress. Seed firms now bundle genetics with nutrient recommendations, creating bundled demand that rides every wave of trait adoption. Field trials also reveal that deeper roots from biotech lines access subsoil stores better, but only when the profile holds enough available micronutrients, setting the stage for supplemental programs that release full genetic potential.
Higher Per-Acre Cost Versus Bulk NPK Blends
Micronutrient programs cost USD 35-45 per acre against USD 8-12 for standard NPK, a 300-400% premium that narrows margins when commodity prices soften. Tenants on annual leases hesitate to invest in soil health that outlives their contracts. Some insurers now offer coverage tied to documented deficiencies, nudging uptake, but widespread relief likely hinges on lower-cost sources such as recycled boron or bundling incentives from seed and input suppliers.
Other drivers and restraints analyzed in the detailed report include:
- Government Subsidies for Precision Micronutrient Application
- Integrated Retailer Distribution Networks Improving Accessibility
- Regulatory Uncertainty on Heavy-Metal Limits in Formulations
For complete list of drivers and restraints, kindly check the Table Of Contents.
Segment Analysis
Zinc retained the largest share of the North America micronutrient fertilizer market in 2025, with 24.1%, because alkaline soils with a pH above 7.5 limit natural zinc availability. Deficiency signs, stunted growth, and interveinal chlorosis are easy for growers to spot, so zinc is often the first micronutrient added to standard blends. Copper followed at a significant share, largely because specialty and organic producers value its dual nutrition and fungicidal traits. Molybdenum ranked close behind, reflecting its role in nitrogen fixation for legume crops even as battery makers tighten global supply lines. Iron is secured by targeting high-pH soils that lock up native iron, while manganese focuses on soybeans grown in no-till fields rich in organic matter.
Boron showed the fastest momentum with a 7.3% CAGR through 2031 as fruit and vegetable acreage expands and buyers demand uniform fruit set. Emerging elements such as nickel and silicon are in the "Others" bucket and are growing in importance as research highlights their value in intensive systems. Innovation centers on chelation chemistries and dust-free granules that raise bioavailability and allow lower application rates. These improvements ease cost pressure in broad-acre programs while helping high-value crops hit strict quality grades. Suppliers also test multi-element mixes that address multiple deficiencies simultaneously, reducing labor and field passes. Together, these shifts keep zinc on top yet open space for boron and other rising nutrients to capture share as agronomic knowledge spreads.
Conventional granular and powder products accounted for 78.0% of 2025 sales because they fit into existing spreaders and planters without additional equipment or training. Lower production costs and established supply chains keep prices competitive, which matters on large corn and soybean farms that track every input dollar. Steady adoption is evident as more fields test for shortfalls in zinc, boron, or both.
Specialty formulations are the fastest-growing, with a 6.6% CAGR through 2031, driven by premium crops and precision systems that reward nutrient-use efficiency. Specialty products use chelation, slow-release coatings, and multi-element blends to deliver more nutrients per pound. This higher efficiency can offset the sticker price by trimming the total rate and cutting extra trips across the field. Growers in horticulture, organic programs, and controlled-environment sites accept the premium because crop value is high and quality standards are tight. Continuous product innovation also supports environmental goals by reducing runoff risk, a growing concern for regulators and buyers alike.
Complete Report Scope:
- Product
- Boron
- Copper
- Iron
- Manganese
- Molybdenum
- Zinc
- Others
- Form
- Conventional
- Specialty
- Specialty Type
- Liquid Fertilizer
- Water Soluble
- Application Mode
- Fertigation
- Foliar
- Soil
- Crop Type
- Field Crops
- Horticultural Crops
- Turf and Ornamental
- Geography
- Canada
- Mexico
- United States
- Rest of North America
List of Companies Covered in this Report:
- The Mosaic Company
- The Andersons Inc.
- Yara International ASA
- Wilbur-Ellis Company LLC
- Sociedad Quimica y Minera de Chile SA
- Nutrien Ltd.
- Compass Minerals International Inc.
- BASF SE
- Helena Agri-Enterprises LLC
- AgroLiquid
- ICL Group Ltd.
- Koch Agronomic Services LLC
- Brandt Consolidated Inc.
- Alltech Crop Science
- Valagro S.p.A.
Additional Benefits:
- The market estimate (ME) sheet in Excel format
- 3 months of analyst support
TABLE OF CONTENTS
1 Introduction
- 1.1 Study Assumptions and Market Definition
- 1.2 Scope of the Study
- 1.3 Research Methodology
2 Report Offers
3 Executive Summary and Key Findings
4 Key Industry Trends
- 4.1 Acreage of Major Crop Types
- 4.1.1 Field Crops
- 4.1.2 Horticultural Crops
- 4.2 Average Nutrient Application Rates
- 4.2.1 Micronutrients
- 4.3 Agricultural Land Equipped for Irrigation
- 4.4 Regulatory Framework
- 4.5 Value Chain & Distribution Channel Analysis
- 4.6 Market Drivers
- 4.6.1 Rising soil micronutrient deficiencies verified by soil-test results
- 4.6.2 Expansion of GM-crop acreage with higher micronutrient requirements
- 4.6.3 Government subsidies for precision micronutrient application
- 4.6.4 Integrated retailer distribution networks improving accessibility
- 4.6.5 Adoption of chelated liquids in indoor and vertical farms
- 4.6.6 E-waste-derived boron lowering input costs
- 4.7 Market Restraints
- 4.7.1 Higher per-acre cost versus bulk NPK blends
- 4.7.2 Regulatory uncertainty on heavy-metal limits in formulations
- 4.7.3 Molybdenum ore supply diverted to battery sector
- 4.7.4 Advisor knowledge gap on nutrient stacking effects
5 Market Size and Growth Forecasts (Value and Volume)
- 5.1 Product
- 5.1.1 Boron
- 5.1.2 Copper
- 5.1.3 Iron
- 5.1.4 Manganese
- 5.1.5 Molybdenum
- 5.1.6 Zinc
- 5.1.7 Others
- 5.2 Form
- 5.2.1 Conventional
- 5.2.2 Specialty
- 5.3 Specialty Type
- 5.3.1 Liquid Fertilizer
- 5.3.2 Water Soluble
- 5.4 Application Mode
- 5.4.1 Fertigation
- 5.4.2 Foliar
- 5.4.3 Soil
- 5.5 Crop Type
- 5.5.1 Field Crops
- 5.5.2 Horticultural Crops
- 5.5.3 Turf and Ornamental
- 5.6 Geography
- 5.6.1 Canada
- 5.6.2 Mexico
- 5.6.3 United States
- 5.6.4 Rest of North America
6 Competitive Landscape
- 6.1 Key Strategic Moves
- 6.2 Market Share Analysis
- 6.3 Company Landscape
- 6.4 Company Profiles (includes Global Level Overview, Market Level Overview, Core Segments, Financials as available, Strategic Information, Market Rank/Share for key companies, Products and Services, and Recent Developments)
- 6.4.1 The Mosaic Company
- 6.4.2 The Andersons Inc.
- 6.4.3 Yara International ASA
- 6.4.4 Wilbur-Ellis Company LLC
- 6.4.5 Sociedad Quimica y Minera de Chile SA
- 6.4.6 Nutrien Ltd.
- 6.4.7 Compass Minerals International Inc.
- 6.4.8 BASF SE
- 6.4.9 Helena Agri-Enterprises LLC
- 6.4.10 AgroLiquid
- 6.4.11 ICL Group Ltd.
- 6.4.12 Koch Agronomic Services LLC
- 6.4.13 Brandt Consolidated Inc.
- 6.4.14 Alltech Crop Science
- 6.4.15 Valagro S.p.A.
7 Key Strategic Questions for Fertilizer CEOs

 歐洲微量元素肥料:市佔率分析、產業趨勢與統計及成長預測(2026-2031 年)中東和非洲微量元素肥料:市場佔有率分析、行業趨勢和統計數據以及成長預測(2026-2031 年)南美洲微量元素肥料:市佔率分析、產業趨勢與統計及成長預測(2026-2031 年)美國微量元素肥料:市佔率分析、產業趨勢與統計及成長預測(2026-2031 年)亞太地區微量元素肥料:市佔率分析、產業趨勢與統計及成長預測(2026-2031)印度微量元素肥料:市場佔有率分析、產業趨勢與統計及成長預測(2026-2031)中國微量元素肥料:市佔率分析、產業趨勢與統計及成長預測(2026-2031)微量元素肥料:市佔率分析、產業趨勢與統計、成長預測(2026-2031)
 2026年全球微量元素肥料市場報告
 微量元素肥料市場報告:趨勢、預測與競爭分析(至2031年)