


 |
市場調查報告書
商品編碼
2073607
微量元素肥料:市佔率分析、產業趨勢與統計、成長預測(2026-2031)Micronutrient Fertilizer - Market Share Analysis, Industry Trends & Statistics, Growth Forecasts (2026 - 2031) |
||||||

※ 本網頁內容可能與最新版本有所差異。詳細情況請與我們聯繫。
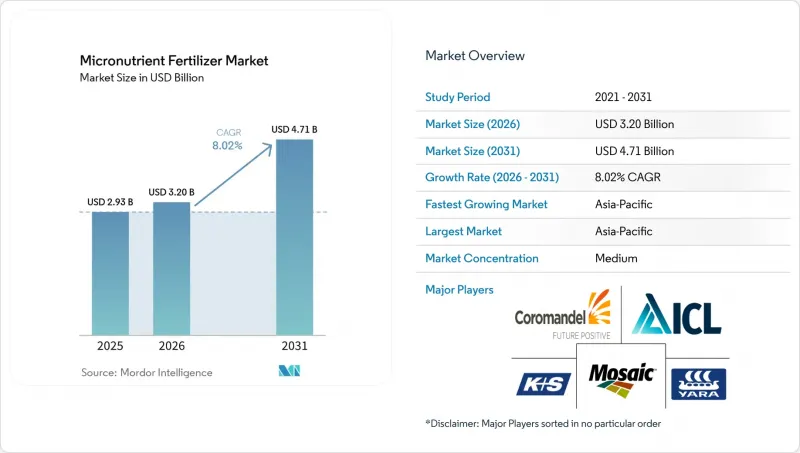
據 Mordor Intelligence 稱,2025 年微量元素肥料市場價值為 29.3 億美元,預計從 2026 年的 32 億美元成長到 2031 年的 47.1 億美元,預測期內複合年成長率為 8.0%。
本報告按產品(硼、銅、鐵、錳、鉬、鋅及其他)、施用方法(施肥/葉面噴布、土壤施用)、作物類型(田間作物、園藝作物、草坪/觀賞作物)和地區(亞太地區、歐洲、中東和非洲、北美和南美)進行細分。市場預測以價值(美元)和數量(公噸)表示。
全球微量元素肥料市場趨勢與洞察
糧食集約化生產區普遍存在土壤微量元素缺乏問題
根據印度2024年土壤健康卡審計報告,49%的地區有缺鋅問題,比2019年增加了7個百分點。同時,三分之一的調查地塊有缺硼問題。儘管氮肥用量增加了12%,但由於微量元素輔因子持續不足,中國河南省小麥產量在2020年至2024年間仍維持在每公頃5.8噸的水準。印尼農業部在2024年發放了12萬噸鋅強化複合肥,試驗田稻產量提高了8%。這歸因於有機質的持續下降,有機質減少導致天然螯合活性降低,從而確保了結構性需求。
精準施肥設備的快速普及
2024年,歐洲340個農場引進配備GPS的噴霧器,使每公頃硫酸鋅用量減少了22%,葉片鋅濃度增加了15%。據約翰迪爾公司稱,2024年售出的噴霧器中有18%配備了微量元素輸液設備,高於2022年的11%。在加拿大油菜種植中,無人機葉面噴施硼肥使坐果率提高了9%。這些成果降低了過度施肥的風險,同時也滿足了澳洲聯邦科學與工業研究組織(CSIRO)提出的新的環境合規要求。
主要礦石價格劇烈波動
2024年,硫酸鋅的交易價格在每噸1,200美元至1,680美元之間波動,對配方生產商的平均利潤率(8%至12%)帶來了壓力。硫酸銅的價格在2024年年中達到每噸2400美元,由於一些大豆種植者推遲了葉面噴布銅肥,2024年上半年南美洲的微量元素銷售量下降了6%。為了減輕價格波動的影響,Mosaic公司對其40%的硫酸鋅採購進行了避險。
細分市場分析
鋅在微量元素肥料市場中佔最大佔有率,預計到2025年將達到38.4%。其主導地位源自於鋅在植物生長、酵素活性活化以及提高主要田間作物和園藝作物產量方面發揮的關鍵作用。鋅肥應用廣泛,尤其是在土壤微量元素缺乏的地區以及採用密集種植制度的地區。產品創新,例如包膜和螯合鋅產品,進一步推動了市場擴張,這些創新能夠提高不同土壤條件下養分的有效性和吸收效率。
預計硼將成為成長最快的細分市場,2026年至2031年的複合年成長率將達到7.5%。這一成長主要得益於油籽、水果、蔬菜和其他高價值作物種植面積的擴大,硼在這些作物的開花、結果、授粉和整體品質方面發揮著至關重要的作用。精準營養管理技術以及施肥和灌溉系統的日益普及進一步推動了對硼肥的需求。此外,人們對硼缺乏及其對作物產量影響的認知不斷提高,也推動了已開發農業市場和新興農業市場對硼基產品的使用。
區域分析
2025年,亞太地區以39.1%的微量元素肥料市佔率佔全球最大佔有率。此外,預計該地區將成為成長最快的區域市場,在2026年至2031年的預測期內,複合年成長率將達到8.9%。這一成長主要得益於中國、印度和東南亞國家龐大的農業生產體系。人們日益重視均衡營養管理和解決微量元素缺乏問題,這是推動市場需求的主要因素。此外,特種肥料的日益普及、精密農業的實踐以及高價值作物種植面積的擴大,也進一步鞏固了該地區的市場地位。
北美和歐洲被認為是微量元素肥料市場成熟且具有重要戰略意義的市場。精密農業技術、先進的土壤檢測技術以及螯合微量元素產品的廣泛應用,支持了這些地區的需求。此外,監管機構對養分利用效率和永續農業實踐的重視,也促使農民針對大田作物和園藝作物實施有針對性的微量元素施用方案。
由於農業現代化和商業性耕作活動的擴張,中東、非洲和南美洲正在崛起為主要的成長市場。灌溉基礎設施的投資、化肥可得性的改善以及生產力提升計劃正在推動這些地區微量元素肥料的普及。在南美洲,包括大豆、玉米、水果和蔬菜在內的作物種植面積的擴大支撐了市場成長。同時,中東和非洲國家正致力於透過均衡的植物營養策略來提高作物產量。
其他好處:
- Excel格式的市場預測(ME)表
- 3個月的分析師支持
目錄
第1章:引言
- 研究假設和市場定義
- 調查範圍
- 調查方法
第2章:本報告的內容
第3章:執行摘要和主要發現
第4章:主要產業趨勢
- 主要農作物種植面積
- 大田作物
- 園藝作物
- 平均施肥量
- 微量營養素
- 田間作物
- 園藝作物
- 微量營養素
- 配備灌溉設施的農田
- 法律規範
- 價值鍊和通路分析
- 市場促進因素
- 集約化糧食生產地區普遍存在土壤微量元素缺乏現象。
- 精密噴塗設備的快速普及
- 透過保護性栽培擴大高價值園藝產業
- 南亞和東南亞政府的微量營養素補充計劃
- 生物強化措施作為對抗「隱性飢餓」的手段
- 具有高吸收效率的奈米螯合製劑
- 市場限制因素
- 主要礦石價格的極端波動
- 撒哈拉以南非洲和南美洲部分地區的農民意識較低。
- 多種營養素混合物中的拮抗作用
- 加強對重金屬污染物的監管
第5章 市場規模與成長預測
- 依產品
- 硼
- 銅
- 鐵
- 錳
- 鉬
- 鋅
- 其他
- 依用途類型
- 施肥和灌溉
- 葉面噴布
- 土壤
- 按作物類型
- 田間作物
- 園藝作物
- 草坪和觀賞植物
- 按地區
- 亞太地區
- 澳洲
- 孟加拉
- 中國
- 印度
- 印尼
- 日本
- 巴基斯坦
- 菲律賓
- 泰國
- 越南
- 其他亞太國家
- 歐洲
- 法國
- 德國
- 義大利
- 荷蘭
- 俄羅斯
- 西班牙
- 烏克蘭
- 英國
- 其他歐洲國家
- 中東和非洲
- 奈及利亞
- 沙烏地阿拉伯
- 南非
- 土耳其
- 其他中東和非洲國家
- 北美洲
- 加拿大
- 墨西哥
- 美國
- 其他北美國家
- 南美洲
- 阿根廷
- 巴西
- 其他南美國家
- 亞太地區
第6章 競爭情勢
- 關鍵策略趨勢
- 市佔率分析
- 企業狀況
- 公司簡介。
- Yara International ASA
- The Mosaic Company
- ICL Group Ltd
- K+S Aktiengesellschaft
- Coromandel International Ltd
- Koch Agronomic Services(Koch Industries)
- BASF SE
- FMC Corporation
- SQM SA
- Haifa Group
- Compass Minerals International Inc.
- Nouryon
- Nufarm Limited
- Brandt Consolidated Inc.
- BMS Micro-Nutrients NV
第7章 化肥產業執行長面臨的關鍵策略挑戰
According to Mordor Intelligence, the micronutrient fertilizer market size was valued at USD 2.93 billion in 2025 and is projected to grow from USD 3.20 billion in 2026 to USD 4.71 billion by 2031, registering a CAGR of 8.0% during the forecast period.
This report is Segmented by Product (Boron, Copper, Iron, Manganese, Molybdenum, Zinc, Others), Application Mode (Fertigation, Foliar, Soil), by Crop Type (Field Crops, Horticultural Crops, Turf and Ornamental), and by Region (Asia-Pacific, Europe, Middle East and Africa, North America, South America). The Market Forecasts are Provided in Terms of Value (USD) and Volume (Metric Tons).
Global Micronutrient Fertilizer Market Trends and Insights
Widespread Soil Micronutrient Deficiencies in Intensive Cereal Belts
India's 2024 soil health card audit revealed zinc deficiency in 49% of districts, a seven percentage point increase since 2019, while boron shortfalls affected one-third of sampled plots . Wheat yields in China's Henan province stagnated at 5.8 metric tons per ha from 2020 to 2024, even as nitrogen use climbed 12% because trace-element co-factors remained limiting. Indonesia's Ministry of Agriculture distributed 120,000 metric tons of zinc-fortified NPK in 2024, boosting paddy yields by 8% in pilot plots. The underlying driver is the ongoing decline in organic matter, which reduces natural chelation and ensures structural demand.
Rapid Adoption of Precision-Application Equipment
GPS-enabled applicators reduced zinc sulfate use by 22% per hectare across 340 European farms in 2024, while increasing leaf zinc concentrations by 15%. John Deere noted that 18% of 2024 sprayer sales included micronutrient injectors, up from 11% in 2022. Drone-guided foliar boron in Canadian canola increased seed set by 9%. These gains simultaneously lower over-application risks, an emerging environmental compliance need flagged by the Commonwealth Scientific and Industrial Research Organisation (CSIRO).
High Price Volatility of Key Mineral Ores
Zinc sulfate traded between USD 1,200 and USD 1,680 per metric ton in 2024, compressing formulator margins that average 8-12%. Copper sulfate reached USD 2,400 per metric ton in mid-2024, causing some South American soybean growers to defer foliar copper applications, which resulted in a 6% decline in regional micronutrient volumes in H1 2024. Mosaic hedged 40% of its zinc sulfate inputs to cushion volatility.
Other drivers and restraints analyzed in the detailed report include:
- Expansion of High-Value Horticulture Under Protected Cultivation
- Government Micronutrient Subsidy Programs in South and Southeast Asia
- Low Farmer Awareness in Sub-Saharan Africa and Parts of South America
For complete list of drivers and restraints, kindly check the Table Of Contents.
Segment Analysis
Zinc accounted for the largest share of the micronutrient fertilizer market, representing 38.4% in 2025. This dominance is attributed to its essential role in plant growth, enzyme activation, and yield improvement across major field and horticultural crops. Zinc-based fertilizers are widely adopted, particularly in regions with documented soil micronutrient deficiencies and intensive cropping systems. Market expansion is further supported by product innovations, including enhanced-efficiency formulations such as coated and chelated zinc products, which improve nutrient availability and uptake efficiency under diverse soil conditions.
Boron is projected to be the fastest-growing segment, with a 7.5% CAGR during 2026-2031. This growth is driven by the increasing cultivation of oilseeds, fruits, vegetables, and other high-value crops, where boron plays a critical role in flowering, fruit set, pollination, and overall crop quality. The rising adoption of precision nutrient management practices and fertigation systems is further boosting demand for boron fertilizers. Additionally, growing awareness of boron deficiencies and their impact on crop productivity is encouraging the use of boron-based products in both developed and emerging agricultural markets.
Complete Report Scope:
- By Product
- Boron
- Copper
- Iron
- Manganese
- Molybdenum
- Zinc
- Others
- By Application Mode
- Fertigation
- Foliar
- Soil
- By Crop Type
- Field Crops
- Horticultural Crops
- Turf and Ornamental
- By Geography
- Asia-Pacific
- Australia
- Bangladesh
- China
- India
- Indonesia
- Japan
- Pakistan
- Philippines
- Thailand
- Vietnam
- Rest of Asia-Pacific
- Europe
- France
- Germany
- Italy
- Netherlands
- Russia
- Spain
- Ukraine
- United Kingdom
- Rest of Europe
- Middle East And Africa
- Nigeria
- Saudi Arabia
- South Africa
- Turkey
- Rest of Middle East And Africa
- North America
- Canada
- Mexico
- United States
- Rest of North America
- South America
- Argentina
- Brazil
- Rest of South America
- Asia-Pacific
Geography Analysis
In 2025, the Asia-Pacific region accounted for the largest share of the micronutrient fertilizer market at 39.1%. It is also projected to be the fastest-growing regional market, with a CAGR of 8.9% during the forecast period of 2026-2031. This growth is driven by the extensive agricultural production systems across China, India, and Southeast Asian countries. The increasing focus on balanced nutrient management and addressing micronutrient deficiencies is a key factor boosting demand. Additionally, the rising adoption of specialty fertilizers, precision agriculture practices, and high-value crop cultivation further strengthens the market position in this region.
North America and Europe are considered mature yet strategically significant markets for micronutrient fertilizers. The demand in these regions is supported by the widespread use of precision farming technologies, advanced soil testing methods, and chelated micronutrient products. Furthermore, regulatory emphasis on nutrient-use efficiency and sustainable agricultural practices is encouraging farmers to implement targeted micronutrient application programs for both field and horticultural crops.
The Middle East and Africa, along with South America, are emerging as key growth markets due to agricultural modernization and the expansion of commercial farming activities. Investments in irrigation infrastructure, improved fertilizer accessibility, and productivity enhancement programs are driving the adoption of micronutrient fertilizers in these regions. In South America, the increasing cultivation of crops such as soybean, corn, fruits, and vegetables supports market growth. Meanwhile, countries in the Middle East and Africa are focusing on improving crop productivity through balanced plant nutrition strategies.
- Yara International ASA
- The Mosaic Company
- ICL Group Ltd
- K+S Aktiengesellschaft
- Coromandel International Ltd
- Koch Agronomic Services (Koch Industries)
- BASF SE
- FMC Corporation
- SQM S.A.
- Haifa Group
- Compass Minerals International Inc.
- Nouryon
- Nufarm Limited
- Brandt Consolidated Inc.
- BMS Micro-Nutrients NV
Additional Benefits:
- The market estimate (ME) sheet in Excel format
- 3 months of analyst support
TABLE OF CONTENTS
1 INTRODUCTION
- 1.1 Study Assumptions and Market Definition
- 1.2 Scope of the Study
- 1.3 Research Methodology
2 REPORT OFFERS
3 EXECUTIVE SUMMARY AND KEY FINDINGS
4 KEY INDUSTRY TRENDS
- 4.1 Acreage Of Major Crop Types
- 4.1.1 Field Crops
- 4.1.2 Horticultural Crops
- 4.2 Average Nutrient Application Rates
- 4.2.1 Micronutrients
- 4.2.1.1 Field Crops
- 4.2.1.2 Horticultural Crops
- 4.2.1 Micronutrients
- 4.3 Agricultural Land Equipped For Irrigation
- 4.4 Regulatory Framework
- 4.5 Value Chain And Distribution Channel Analysis
- 4.6 Market Drivers
- 4.6.1 Widespread soil micronutrient deficiencies in intensive cereal belts
- 4.6.2 Rapid adoption of precision-application equipment
- 4.6.3 Expansion of high-value horticulture under protected cultivation
- 4.6.4 Government micronutrient subsidy programs in South and Southeast Asia
- 4.6.5 Bio-fortification initiatives against hidden hunger
- 4.6.6 Nanochelated formulations offering higher uptake efficiency
- 4.7 Market Restraints
- 4.7.1 High price volatility of key mineral ores
- 4.7.2 Low farmer awareness in Sub-Saharan Africa and parts of South America
- 4.7.3 Antagonistic interactions in multi-nutrient blends
- 4.7.4 Stricter limits on heavy-metal contaminants
5 5. MARKET SIZE AND GROWTH FORECASTS (VALUE AND VOLUME)
- 5.1 By Product
- 5.1.1 Boron
- 5.1.2 Copper
- 5.1.3 Iron
- 5.1.4 Manganese
- 5.1.5 Molybdenum
- 5.1.6 Zinc
- 5.1.7 Others
- 5.2 By Application Mode
- 5.2.1 Fertigation
- 5.2.2 Foliar
- 5.2.3 Soil
- 5.3 By Crop Type
- 5.3.1 Field Crops
- 5.3.2 Horticultural Crops
- 5.3.3 Turf and Ornamental
- 5.4 By Geography
- 5.4.1 Asia-Pacific
- 5.4.1.1 Australia
- 5.4.1.2 Bangladesh
- 5.4.1.3 China
- 5.4.1.4 India
- 5.4.1.5 Indonesia
- 5.4.1.6 Japan
- 5.4.1.7 Pakistan
- 5.4.1.8 Philippines
- 5.4.1.9 Thailand
- 5.4.1.10 Vietnam
- 5.4.1.11 Rest of Asia-Pacific
- 5.4.2 Europe
- 5.4.2.1 France
- 5.4.2.2 Germany
- 5.4.2.3 Italy
- 5.4.2.4 Netherlands
- 5.4.2.5 Russia
- 5.4.2.6 Spain
- 5.4.2.7 Ukraine
- 5.4.2.8 United Kingdom
- 5.4.2.9 Rest of Europe
- 5.4.3 Middle East And Africa
- 5.4.3.1 Nigeria
- 5.4.3.2 Saudi Arabia
- 5.4.3.3 South Africa
- 5.4.3.4 Turkey
- 5.4.3.5 Rest of Middle East And Africa
- 5.4.4 North America
- 5.4.4.1 Canada
- 5.4.4.2 Mexico
- 5.4.4.3 United States
- 5.4.4.4 Rest of North America
- 5.4.5 South America
- 5.4.5.1 Argentina
- 5.4.5.2 Brazil
- 5.4.5.3 Rest of South America
- 5.4.1 Asia-Pacific
6 COMPETITIVE LANDSCAPE
- 6.1 Key Strategic Moves
- 6.2 Market Share Analysis
- 6.3 Company Landscape
- 6.4 Company Profiles (includes Global Level Overview, Market Level Overview, Core Business Segments, Financials, Headcount, Key Information, Market Rank, Market Share, Products and Services, and Analysis of Recent Developments).
- 6.4.1 Yara International ASA
- 6.4.2 The Mosaic Company
- 6.4.3 ICL Group Ltd
- 6.4.4 K+S Aktiengesellschaft
- 6.4.5 Coromandel International Ltd
- 6.4.6 Koch Agronomic Services (Koch Industries)
- 6.4.7 BASF SE
- 6.4.8 FMC Corporation
- 6.4.9 SQM S.A.
- 6.4.10 Haifa Group
- 6.4.11 Compass Minerals International Inc.
- 6.4.12 Nouryon
- 6.4.13 Nufarm Limited
- 6.4.14 Brandt Consolidated Inc.
- 6.4.15 BMS Micro-Nutrients NV
7 KEY STRATEGIC QUESTIONS FOR FERTILIZER CEOS

 歐洲微量元素肥料:市佔率分析、產業趨勢與統計及成長預測(2026-2031 年)中東和非洲微量元素肥料:市場佔有率分析、行業趨勢和統計數據以及成長預測(2026-2031 年)北美微量元素肥料:市佔率分析、產業趨勢與統計及成長預測(2026-2031 年)南美洲微量元素肥料:市佔率分析、產業趨勢與統計及成長預測(2026-2031 年)美國微量元素肥料:市佔率分析、產業趨勢與統計及成長預測(2026-2031 年)亞太地區微量元素肥料:市佔率分析、產業趨勢與統計及成長預測(2026-2031)印度微量元素肥料:市場佔有率分析、產業趨勢與統計及成長預測(2026-2031)中國微量元素肥料:市佔率分析、產業趨勢與統計及成長預測(2026-2031)
 2026年全球微量元素肥料市場報告
 微量元素肥料市場報告:趨勢、預測與競爭分析(至2031年)