

 |
市場調查報告書
商品編碼
2073610
歐洲微量元素肥料:市佔率分析、產業趨勢與統計及成長預測(2026-2031 年)Europe Micronutrient Fertilizers - Market Share Analysis, Industry Trends & Statistics, Growth Forecasts (2026 - 2031) |
||||||

※ 本網頁內容可能與最新版本有所差異。詳細情況請與我們聯繫。
市場成長前景日益受到特種微量營養素的影響,預計鉬從 2026 年到 2031 年的複合年成長率將達到 9.4%,是所有產品類型中最高的。
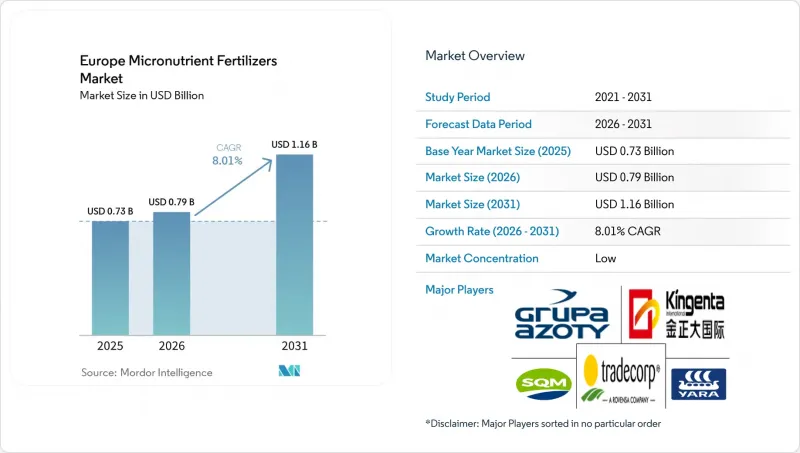
根據Mordor Intelligence預測,歐洲微量元素肥料市場規模預計在2025年達到7.3億美元,並在2026年達到7.9億美元。本報告按產品(硼、銅、鐵、錳、鉬等)、施用方法(施肥/灌溉、葉面噴布等)、作物類型(田間作物、園藝作物等)和地區(法國、德國、義大利、荷蘭、俄羅斯、西班牙、烏克蘭、英國等)進行細分。市場預測以價值(美元)和數量(公噸)兩種單位呈現。
歐洲微量元素肥料市場的趨勢與洞察
利用精密農業進行土壤微量元素測繪
目前,歐洲的大型農場正在部署GPS引導的土壤採樣設備,這些設備能夠繪製出詳細的土壤地圖,從而識別出先前因大面積施肥而被掩蓋的鋅、鐵和錳缺乏區域。結合季節性濕度和植被指數,哥白尼衛星影像使農藝師能夠將遙感探測資料與田間樣本進行比較。一家德國設備製造商已將一種噴霧器商業化,該噴霧器可以每隔幾米調整微量元素的施用量,先導計畫已成功將過度施肥減少了高達18%。隨著田間數據的日益豐富,種植者正轉向採用螯合肥料,這種肥料即使在鹼性土壤中也能保持有效性,並且能夠與每個網格的施肥處方圖相匹配。據經銷商稱,由於農民恢復統一施肥後,缺乏症狀會再次出現,因此,靈活的施肥方案導致了重複訂單。因此,這項技術正在將微量元素施肥確立為精密農業技術,推動了歐洲微量元素肥料市場的整體應用。
歐盟通用農業政策(CAP)中對生態計畫的獎勵
2023-2027 年通用農業政策 (CAP) 撥款 480 億歐元(520 億美元)用於生態支付,以評估已記錄在案的養分管理計劃,包括微量元素平衡表。在法國和德國,如果土壤檢測數據和施用記錄證實微量元素濃度達到最佳水平,生產者每公頃可獲得 60-80 歐元(65-600 億美元)的補貼。這些資金幫助中小農場支付檢測、移動感測器和變數施肥控制器的費用。獸醫衛生機構也建議均衡施肥,因為飼料作物中銅、鋅和硒的缺乏會削弱牲畜的免疫力。透過將遵守環境法規與提高農場生產力掛鉤,該政策正在將曾經的可選項轉變為主流農業義務。因此,微量元素供應商現在可以預期未來需求的穩定,這種穩定與多年通用農業政策 (CAP) 預算更加契合,並且不受商品價格波動的影響。
金屬原物料價格波動
2024年1月至2025年9月期間,氧化鋅價格上漲了45%,而硫酸銅價格則以季度為單位波動20%至30%。這反映出礦產供應緊張以及鍍鋅需求激增。由於合約量較小且純度標準更為嚴格,化肥廠無法像對沖能源投入那樣輕鬆地對沖金屬價格。因此,現貨市場採購往往會影響成品價格。面對不可預測的成本,經銷商正在減少庫存並將價格上漲直接轉嫁給生產商。因此,生產商可能會推遲採購非必需微量元素。一些製造商正在與冶煉廠談判多年期的採購協議,或尋求使用回收金屬,但很少有合金產品能夠達到農業純度標準。當大宗商品價格下跌時,庫存高成本的生產商將被迫大幅降價,從而壓縮利潤空間。因此,持續的價格波動會為零售價格增加風險溢價,這會在短期景氣衰退抑制歐洲微量元素肥料市場的成長。
細分市場分析
到2025年,鋅將佔歐洲微量元素肥料市場佔有率的31.1%。這主要得益於鋅在穀物、油籽和玉米生產系統中的廣泛應用,在這些系統中,提高養分利用效率和最佳化產量是首要考慮因素。中歐和東歐部分地區普遍存在缺鋅土壤,以及平衡施肥技術的日益普及,進一步推動了對鋅的需求。此外,螯合態和水溶性鋅製劑需求的成長,也提升了鋅全部區域農業生產力的貢獻。
豆科作物和高價值園藝作物種植面積的不斷擴大,推動了對鉬的需求,鉬在氮代謝和作物生產力中發揮著至關重要的作用。同時,鐵、銅、錳和硼在各種作物系統中仍佔有重要地位。此外,生產商正在擴大其多營養素和螯合劑產品線,以提高施用效率並應對歐洲農業中土壤養分缺乏的新挑戰。
其他好處:
- Excel格式的市場預測(ME)表
- 3個月的分析師支持
目錄
第1章:引言
- 研究假設和市場定義
- 調查範圍
- 調查方法
第2章:本報告的內容
第3章:執行摘要和主要發現
第4章 主要產業的發展趨勢
- 主要農作物種植面積
- 田間作物
- 園藝作物
- 平均施肥量
- 微量營養素
- 田間作物
- 園藝作物
- 微量營養素
- 配備灌溉設施的農田
- 法律規範
- 價值鍊和通路分析
- 市場促進因素
- 利用精密農業進行土壤微量元素測繪
- 歐盟通用農業政策中生態計畫的獎勵
- 對高附加價值園藝作物的需求不斷成長
- 轉為螯合液體製劑和水溶性製劑
- 數位農業諮詢平台正在推動農業領域的應用。
- 英國脫歐後,微量營養素在英國迅速獲得批准
- 市場限制因素
- 金屬原物料價格波動
- 歐盟對重金屬污染物製定了嚴格的法規
- 減少外部施用的生物強化政策
- 與生技藥品和生物肥料的競爭
第5章 市場規模與成長預測
- 依產品
- 硼
- 銅
- 鐵
- 錳
- 鉬
- 鋅
- 其他
- 透過應用方法
- 施肥和灌溉
- 葉面噴布
- 土壤
- 按作物類型
- 田間作物
- 園藝作物
- 草坪和觀賞植物
- 按地區
- 法國
- 德國
- 義大利
- 荷蘭
- 俄羅斯
- 西班牙
- 烏克蘭
- 英國
- 其他歐洲國家
第6章 競爭情勢
- 市場集中度
- 策略趨勢
- 市佔率分析
- 公司簡介
- Yara International ASA
- Compo Expert GmbH(Grupa Azoty SA)
- Kingenta Ecological Engineering Group Co., Ltd.
- Sociedad Quimica y Minera de Chile SA
- Trade Corporation International(Rovensa Group)
- BASF SE
- Compass Minerals International, Inc.
- Fertiberia, SA(Triton Partners)
- Haifa Chemicals Ltd.(Haifa Group)
- ICL Group Ltd.
- K+S Aktiengesellschaft
- Nutrien Ltd.
- Timac Agro SAS(Groupe Roullier)
- Valagro SpA(Syngenta Group Co., Ltd.)
- Verdesian Life Sciences, LLC(AEA Investors)
第7章:化肥產業執行長面臨的關鍵策略挑戰
According to Mordor Intelligence, the europe micronutrient fertilizers market size was valued at USD 0.73 billion in 2025 and is estimated to reach USD 0.79 billion in 2026. The market's growth outlook is increasingly influenced by specialty micronutrients, with molybdenum projected to grow at a CAGR of 9.4% during 2026 to 2031, the highest among all product categories.
This report is Segmented by Product (Boron, Copper, Iron, Manganese, Molybdenum, and More), by Application Mode (Fertigation, Foliar, and More), by Crop Type (Field Crops, Horticultural Crops, and More), and by Geography (France, Germany, Italy, Netherlands, Russia, Spain, Ukraine, United Kingdom, and More). The Market Forecasts are Provided in Terms of Value (USD) and Volume (Metric Tons).
Europe Micronutrient Fertilizers Market Trends and Insights
Precision-Agriculture Led Soil Micronutrient Mapping
Large European farms now operate GPS-guided sampling rigs that generate granular soil maps identifying pockets of zinc, iron, and manganese shortages long masked by blanket fertilization practices. Copernicus imagery adds seasonal moisture and vegetation indices, allowing agronomists to cross-check remote signals with physical samples. German equipment makers have commercialized spreaders that vary micronutrient rates every few meters, trimming over-application by up to 18% in pilot projects. As fields become data-rich, growers turn to chelated blends that stay available in alkaline zones and match prescription maps for each grid. Input distributors report that variable-rate programs convert into repeat orders because deficiencies re-emerge whenever farmers revert to uniform broadcasting. The technology therefore embeds micronutrients into precision-farming playbooks and pushes overall usage higher across the Europe micronutrient fertilizers market.
European Union Common Agricultural Policy Eco-Scheme Incentives
The 2023-2027 CAP earmarks EUR 48 billion (USD 52 billion) for eco-payments that reward documented nutrient-management plans, including micronutrient balance sheets. France and Germany reimburse growers EUR 60-80 per hectare (USD 65-87 per hectare) once soil-test data and application logs show optimum trace-element levels. These funds help small and medium-sized farms absorb the cost of laboratory tests, mobile sensors, and variable-rate controllers. Veterinary health agencies also back balanced fertilization because copper, zinc, and selenium deficiencies in forage crops can weaken livestock immunity. By bundling environmental compliance with farm-level productivity gains, the policy converts what was a voluntary practice into a mainstream agronomic obligation. Consequently, micronutrient suppliers see stable forward demand that is decoupled from commodity-price swings and better aligned with multi-year Common Agricultural Policy (CAP) budgets.
Metal-Based Raw-Material Price Volatility
Between January 2024 and September 2025, zinc oxide prices increased by 45%, while copper sulfate prices fluctuated by 20-30% per quarter, reflecting a tight mining supply and surging galvanizing demand. Fertilizer plants cannot hedge metals as easily as energy inputs because contract volumes are smaller and purity specs stricter, so spot market buying often drives finished-product quotes. Distributors facing unpredictable costs cut inventory and pass price spikes directly to growers, who may postpone non-essential micronutrient purchases. Some manufacturers negotiate multi-year offtake deals with smelters or turn to recycled metals, yet alloy by-product streams rarely meet agricultural purity thresholds. When commodity prices retrace, those producers stuck with high-cost stock must discount aggressively, eroding margins. Persistent volatility, therefore, adds a risk premium to retail prices and caps growth during short economic downturns across the Europe micronutrient fertilizers market.
Other drivers and restraints analyzed in the detailed report include:
- Rising Demand for High-Value Horticulture Crops
- Shift Toward Chelated Liquid and Water-Soluble Formulations
- Stringent European Union Limits on Heavy-Metal Contaminants
For complete list of drivers and restraints, kindly check the Table Of Contents.
Segment Analysis
Zinc accounted for 31.1% of the European micronutrient fertilizers market share in 2025, driven by its extensive application in cereal, oilseed, and maize production systems. These systems prioritize nutrient-use efficiency and yield optimization. The demand for zinc is further supported by the prevalence of zinc-deficient soils in parts of Central and Eastern Europe, alongside the growing adoption of balanced fertilization practices. Additionally, the increasing preference for chelated and water-soluble formulations is enhancing zinc's contribution to agricultural productivity across the region.
The rising cultivation of legumes and high-value horticultural crops is driving demand for molybdenum due to its critical role in nitrogen metabolism and crop productivity. Meanwhile, iron, copper, manganese, and boron continue to hold significant relevance across various crop systems. Manufacturers are also expanding their multi-nutrient and chelated product portfolios to enhance application efficiency and address evolving soil nutrient deficiencies in European agriculture.
Complete Report Scope:
- Product
- Boron
- Copper
- Iron
- Manganese
- Molybdenum
- Zinc
- Others
- Application Mode
- Fertigation
- Foliar
- Soil
- Crop Type
- Field Crops
- Horticultural Crops
- Turf and Ornamental
- By Geography
- France
- Germany
- Italy
- Netherlands
- Russia
- Spain
- Ukraine
- United Kingdom
- Rest of Europe
List of Companies Covered in this Report:
- Yara International ASA
- Compo Expert GmbH (Grupa Azoty S.A.)
- Kingenta Ecological Engineering Group Co., Ltd.
- Sociedad Quimica y Minera de Chile S.A.
- Trade Corporation International (Rovensa Group)
- BASF SE
- Compass Minerals International, Inc.
- Fertiberia, S.A. (Triton Partners)
- Haifa Chemicals Ltd. (Haifa Group)
- ICL Group Ltd.
- K+S Aktiengesellschaft
- Nutrien Ltd.
- Timac Agro SAS (Groupe Roullier)
- Valagro S.p.A. (Syngenta Group Co., Ltd.)
- Verdesian Life Sciences, LLC (AEA Investors)
Additional Benefits:
- The market estimate (ME) sheet in Excel format
- 3 months of analyst support
TABLE OF CONTENTS
1 Introduction
- 1.1 Study Assumptions and Market Definition
- 1.2 Scope of the Study
- 1.3 Research Methodology
2 Report offers
3 Executive Summary and Key Findings
4 Key Industries Trend
- 4.1 Acreage of Major Crop Types
- 4.1.1 Field Crops
- 4.1.2 Horticultural Crops
- 4.2 Average Nutrient Application Rates
- 4.2.1 Micronutrients
- 4.2.1.1 Field Crops
- 4.2.1.2 Horticultural Crops
- 4.2.1 Micronutrients
- 4.3 Agricultural Land Equipped For Irrigation
- 4.4 Regulatory Framework
- 4.5 Value Chain and Distribution Channel Analysis
- 4.6 Market Drivers
- 4.6.1 Precision-agriculture led soil micronutrient mapping
- 4.6.2 European Union Common Agricultural Policy eco-scheme incentives
- 4.6.3 Rising demand for high-value horticulture crops
- 4.6.4 Shift toward chelated liquid and water-soluble formulations
- 4.6.5 Digital agronomic advisory platforms boosting adoption
- 4.6.6 Post-Brexit fast-track micronutrient registrations in the UK
- 4.7 Market Restraints
- 4.7.1 Metal-based raw-material price volatility
- 4.7.2 Stringent European Union limits on heavy-metal contaminants
- 4.7.3 Bio-fortification policies reducing external application
- 4.7.4 Competition from biological inoculants and biofertilizers
5 Market Size and Growth Forecasts (Value and Volume)
- 5.1 Product
- 5.1.1 Boron
- 5.1.2 Copper
- 5.1.3 Iron
- 5.1.4 Manganese
- 5.1.5 Molybdenum
- 5.1.6 Zinc
- 5.1.7 Others
- 5.2 Application Mode
- 5.2.1 Fertigation
- 5.2.2 Foliar
- 5.2.3 Soil
- 5.3 Crop Type
- 5.3.1 Field Crops
- 5.3.2 Horticultural Crops
- 5.3.3 Turf and Ornamental
- 5.4 By Geography
- 5.4.1 France
- 5.4.2 Germany
- 5.4.3 Italy
- 5.4.4 Netherlands
- 5.4.5 Russia
- 5.4.6 Spain
- 5.4.7 Ukraine
- 5.4.8 United Kingdom
- 5.4.9 Rest of Europe
6 Competitive Landscape
- 6.1 Market Concentration
- 6.2 Strategic Moves
- 6.3 Market Share Analysis
- 6.4 Company Profiles (Includes Global Overview, Market Overview, Core Segments, Financials, Strategic Information, Market Rank/Share, Products and Services, and Recent Developments)
- 6.4.1 Yara International ASA
- 6.4.2 Compo Expert GmbH (Grupa Azoty S.A.)
- 6.4.3 Kingenta Ecological Engineering Group Co., Ltd.
- 6.4.4 Sociedad Quimica y Minera de Chile S.A.
- 6.4.5 Trade Corporation International (Rovensa Group)
- 6.4.6 BASF SE
- 6.4.7 Compass Minerals International, Inc.
- 6.4.8 Fertiberia, S.A. (Triton Partners)
- 6.4.9 Haifa Chemicals Ltd. (Haifa Group)
- 6.4.10 ICL Group Ltd.
- 6.4.11 K+S Aktiengesellschaft
- 6.4.12 Nutrien Ltd.
- 6.4.13 Timac Agro SAS (Groupe Roullier)
- 6.4.14 Valagro S.p.A. (Syngenta Group Co., Ltd.)
- 6.4.15 Verdesian Life Sciences, LLC (AEA Investors)
7 Key Strategic Questions for Fertilizer CEOs

 中東和非洲微量元素肥料:市場佔有率分析、行業趨勢和統計數據以及成長預測(2026-2031 年)北美微量元素肥料:市佔率分析、產業趨勢與統計及成長預測(2026-2031 年)南美洲微量元素肥料:市佔率分析、產業趨勢與統計及成長預測(2026-2031 年)美國微量元素肥料:市佔率分析、產業趨勢與統計及成長預測(2026-2031 年)亞太地區微量元素肥料:市佔率分析、產業趨勢與統計及成長預測(2026-2031)印度微量元素肥料:市場佔有率分析、產業趨勢與統計及成長預測(2026-2031)中國微量元素肥料:市佔率分析、產業趨勢與統計及成長預測(2026-2031)微量元素肥料:市佔率分析、產業趨勢與統計、成長預測(2026-2031)
 2026年全球微量元素肥料市場報告
 微量元素肥料市場報告:趨勢、預測與競爭分析(至2031年)