


 |
市場調查報告書
商品編碼
2073139
接取層交換:市場佔有率分析、產業趨勢與統計、成長預測(2026-2031)Access Layer Switch - Market Share Analysis, Industry Trends & Statistics, Growth Forecasts (2026 - 2031) |
||||||

※ 本網頁內容可能與最新版本有所差異。詳細情況請與我們聯繫。
根據 Mordor Intelligence 預測,接取層交換器市場規模將從 2025 年的 87.2 億美元和 2026 年的 94.4 億美元成長到 2031 年的 139.2 億美元,2026 年至 2031 年的年複合成長率(CAGR)為 8.07%。
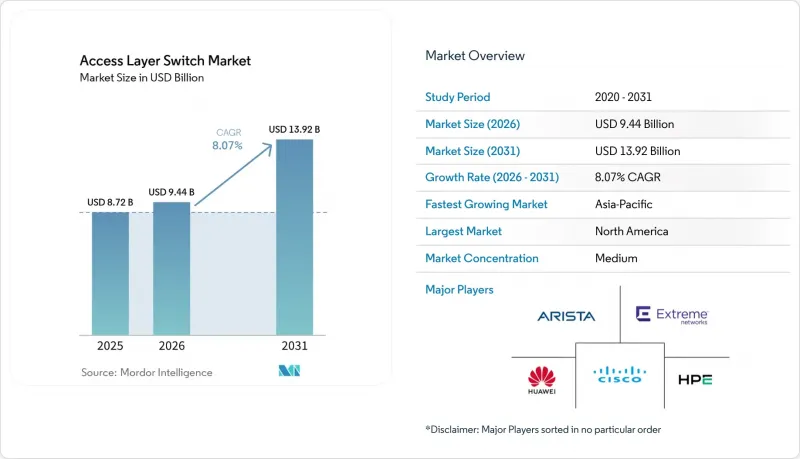
本報告按端口速度(1 GbE 或更低、2.5/5 GbE 多千兆、其他)、端口密度(小型、中階、高密度、其他)、最終用戶企業規模(大型企業、中小企業)、最終用戶行業(IT 和電信、銀行、金融服務和保險 (BFSI)、醫療保健和生命科學、製造業、政府和國防、其他)以及地區進行細分。市場預測以美元 (USD) 為單位。
全球接取層交換器市場趨勢及洞察
加速教育領域的校園數位化進程
為了支援混合式學習、物聯網校園以及依賴多Gigabit吞吐量的研究叢集,各大學正在更換傳統交換器。一項針對美國高等教育機構 IT 領導者的 2025 年調查顯示,60% 的機構計劃在兩年內升級其網路。加州大學洛杉磯分校 (UCLA) 在 419 棟建築中部署了支援 2.5 GbE 的 Catalyst 9000 交換機,為其 45,000 名學生提供 Wi-Fi 6E 服務(CISCO.COM)。華盛頓大學則採用了 HPE Aruba CX 交換機,以實現大規模的角色為基礎的網路分段。動態配置和雲端協作縮短了更新周期,使學術機構成為存取層交換器市場中持續成長的領域。
Wi-Fi 6 和 Wi-Fi 7網路基地台的部署正在迅速增加。
Wi-Fi 7 預計將於 2025 年底成為主流,目前已佔據企業無線支出的相當大佔有率。雖然符合 IEEE 802.11be 標準的無線設備需要多Gigabit上行鏈路,但 IEEE 802.3bz 標準允許企業重複使用現有的 Cat 5e 和 Cat 6 線纜,無需重新佈線。 Arista 和 Dell 宣布推出支援 2.5/5 GbE 的園區交換機,並在單一軟體層面上整合了無線遙測功能。根據 IEEE 802.3bt 標準,乙太網路供電 (PoE) 的功率預算已提高至每個連接埠 90 W,這將進一步加速淘汰僅支援 1 GbE 的平台。
通用交換器專用積體電路(ASIC)供應鏈的波動
博通對Tomahawk、Trident和Jericho晶片的實際壟斷加劇了風險。台積電先進製程節點的前置作業時間已從2024年初的六週延長至2025年底的六個月,迫使供應商限制庫存分配。出口限制的不確定性以及多層PCB的瓶頸進一步加劇了供應壓力。雖然Marvell和英特爾也提供替代晶片,但它們的重新設計週期超過兩年,這意味著在可預見的未來,供應商仍將繼續依賴博通。
細分市場分析
到2025年,傳統的1GbE或更低速率的連接埠將佔據52.18%的市場。這主要得益於傳統終端設備的部署規模以及企業出於經濟考量而推遲基礎設施升級,直到產品停止支援期限臨近。基於IEEE 802.3bz標準的2.5/5GbE層預計到2031年將以12.84%的複合年成長率成長,超越所有其他速率等級。企業正將多千兆乙太網路定位為傳統1GbE終端與未來10GbE光纖之間的橋樑,既能滿足Wi-Fi 7回程傳輸的要求,又能保留現有的銅纜。廠商藍圖顯示,多千兆乙太網路和IEEE 802.3bt的功率預算正逐漸成為標準,這意味著1GbE將逐步退出市場。
隨著價格下降,成熟的 10 GbE光學模組正逐步支援上行鏈路和伺服器接入,而 25/40 GbE 及以上規格的光纖仍然主要應用於需要東西向吞吐量的資料中心機架。預計到 2028 年,多千兆接取層交換器的市場規模將與 1 GbE 交換器的市場規模基本持平,從而鞏固其作為新標準的地位。同時,互通性的提升和廠商標準化的推進降低了採用門檻,加速了企業級多千兆基礎設施的普及。
在2025年的配線櫃市場中,由於大量傳統設備的存在,中階24-48埠交換器以42.26%的市佔率佔據主導地位。但隨著替換預算的增加,用戶正擴大轉向更大、固定尺寸的型號,以降低單埠功耗。高密度48-96埠交換器預計將以9.26%的複合年成長率成長,這得益於園區網路整合和機架頂部資料中心設計(可最大限度地減少佈線)。此外,簡化網路架構和減少每個站點實體設備數量的需求也是推動這項轉變的因素。
Extreme Networks 和 Arista 提供的模組化端口組可在單個底盤內混合使用 1 GbE、多千兆和 25 GbE 端口,從而實現分階段遷移,無需進行大規模的一體化升級(即“堆高機式升級”)。隨著企業精簡佈線間並追求規模化營運經濟效益,高密度接入層交換器的市佔率預計將會上升。此外,高密度配置在現代園區部署中也越來越受歡迎,因為它們支援最佳化的機架空間和自動化主導的網路設計。
區域分析
預計到2025年,北美將佔總收入的38.46%,這主要得益於成熟的校園現代化改造、高等教育機構的設備升級以及醫療保健和聯邦機構對零信任架構的早期採用。預算的確定性和成熟的合作夥伴生態系統支撐著可預測的升級週期,而小規模分店升級速度較慢則限制了成長潛力。此外,雲端管理網路和先進安全框架的廣泛應用也持續推動企業園區的穩定需求。
歐洲也緊隨其後,NIS2 和 DORA 的要求強制要求對認證設備進行存取和持續監控。與淨零排放承諾相關的節能乙太網路目標正在推動企業園區 PoE 交換器的升級,而公共部門的核准程序則延長了合約週期。在東歐製造業中心,隨著工業IoT先導計畫的擴展,需求正在逐步成長,歐盟旨在實現數位基礎設施現代化的資助計畫也進一步推動了這一趨勢。
亞太地區是成長最快的地區,複合年成長率達9.54%。印度的「數位印度」計畫已撥款1.5兆印度盧比(約180億美元)用於智慧城市和寬頻項目,而中國的「十四五」規劃則將工業網際網路基礎建設列為優先事項。東協的「智慧城市網路」和日本的「社會5.0」計劃也同樣推動了全部區域的投資成長。這些多年政策使該地區的接入層交換器市場保持穩步發展,新設備的安裝和業務的快速擴張進一步促進了市場成長。
其他好處:
- Excel格式的市場預測(ME)表
- 3個月的分析師支持
目錄
第1章:引言
- 研究假設和市場定義
- 調查範圍
第2章:調查方法
第3章執行摘要
第4章 市場狀況
- 市場概覽
- 市場促進因素
- 加速教育領域校園數位化進程
- Wi-Fi 6 和 Wi-Fi 7網路基地台的部署正在迅速增加。
- 提高分店邊緣運算的工作負載密度
- 受監管行業網路存取控制的合規義務
- 通訊存取領域開放網路和解耦的發展勢頭
- 基於強制性淨零排放的節能乙太網路部署目標
- 市場限制因素
- 用於商家交換器的ASIC晶片供應鏈波動性
- 管理策略主導型架構的技能差距
- 用高階WLAN取代SMB網段的進展
- 公共部門網路的資本投資週期正在延長。
- 產業價值鏈分析
- 監理情勢
- 技術展望
- 宏觀經濟因素對市場的影響
- 波特五力分析
第5章 市場規模與成長預測
- 連接埠速度
- 1 GbE 或更低
- 2.5/5 GbE 多千兆以太網
- 10 GbE
- 25/40 GbE
- 100 GbE
- 400 GbE 或更高
- 按端口密度分類的端口密度
- 小型化(8-24個連接埠)
- 中階(24-48個連接埠)
- 高密度(48-96個端口)
- 超高密度(100 個連接埠或更多)
- 按最終用戶公司規模分類
- 大公司
- 小型企業
- 按最終用戶行業分類
- 資訊科技/通訊
- BFSI
- 醫療保健和生命科學
- 製造業
- 政府/國防
- 教育
- 零售與電子商務
- 其他終端用戶產業
- 按地區
- 北美洲
- 美國
- 加拿大
- 墨西哥
- 南美洲
- 巴西
- 阿根廷
- 其他南美國家
- 歐洲
- 德國
- 英國
- 法國
- 義大利
- 西班牙
- 俄羅斯
- 其他歐洲國家
- 亞太地區
- 中國
- 日本
- 印度
- 韓國
- 澳洲和紐西蘭
- 其他亞太國家
- 中東
- 沙烏地阿拉伯
- 阿拉伯聯合大公國
- 土耳其
- 其他中東國家
- 非洲
- 南非
- 奈及利亞
- 其他非洲國家
- 北美洲
第6章 競爭情勢
- 市場集中度
- 策略趨勢
- 市佔率分析
- 公司簡介
- Cisco Systems, Inc.
- Huawei Technologies Co., Ltd.
- Hewlett Packard Enterprise Company
- Arista Networks, Inc.
- Extreme Networks, Inc.
- Dell Technologies Inc.
- Fortinet, Inc.
- TP-Link Technologies Co., Ltd.
- D-Link Corporation
- Alcatel-Lucent Enterprise(ALE International SAS)
- Ubiquiti Inc.
- Zyxel Communications Corporation
- Ruijie Networks Co., Ltd.
- Edgecore Networks Corporation
- Allied Telesis Holdings KK
- MikroTikls SIA
- Avaya LLC
- NETGEAR, Inc.
- Cumulus Networks
- Sophos Ltd.
第7章 市場機會與未來展望
According to Mordor Intelligence, the access layer switch market size is projected to expand from USD 8.72 billion in 2025 and USD 9.44 billion in 2026 to USD 13.92 billion by 2031, registering a CAGR of 8.07% between 2026 and 2031.
This report is Segmented by Port Speed (1 GbE and Below, 2. 5/5 GbE Multi-Gig, and More), Port Density (Small Form Factor, Mid-Range, High-Density, and More), End-User Enterprise Size (Large Enterprises, and SMEs), End-User Industry (IT and Telecom, BFSI, Healthcare and Lifesciences, Manufacturing, Government and Defense, and More), and Geography. The Market Forecasts are Provided in Terms of Value (USD).
Global Access Layer Switch Market Trends and Insights
Accelerated Campus Digitalization in the Education Vertical
Universities are replacing legacy switches to power hybrid learning, IoT-enabled campuses, and research clusters that depend on multi-gigabit throughput. A 2025 survey of United States higher-education IT leaders found that 60% planned network upgrades within 2 years. UCLA deployed 2.5 GbE-enabled Catalyst 9000 switches across 419 buildings to support Wi-Fi 6E services for 45,000 students CISCO.COM. Washington University adopted HPE Aruba CX switches to enforce role-based segmentation at scale. Dynamic provisioning and cloud orchestration shorten refresh cycles, making academia a steady growth pocket for the access layer switch market.
Surge in Wi-Fi 6 and Wi-Fi 7 Access Point Roll-outs
Wi-Fi 7 reached mainstream status by late 2025 and now represents a sizable share of enterprise wireless spend. IEEE 802.11be radios demand multi-gig uplinks, and the IEEE 802.3bz standard lets enterprises reuse existing Cat 5e and Cat 6 cabling without disruptive rewiring. Arista and Dell introduced 2.5/5 GbE-ready campus switches that integrate wireless telemetry under a single software plane. Power-over-Ethernet budgets rose to 90 W per port under IEEE 802.3bt, further accelerating the retirement of 1 GbE-only platforms.
Supply Chain Volatility of Merchant Switch ASICs
Broadcom's near-monopoly in Tomahawk, Trident, and Jericho chips concentrates risk. TSMC lead times for advanced nodes stretched from six weeks in early 2024 to six months by late 2025, forcing vendors to ration inventory. Export-control uncertainty and multilayer PCB bottlenecks further strain availability. Alternative silicon from Marvell or Intel exists, yet redesign cycles exceed two years, maintaining dependency on Broadcom in the near term.
Other drivers and restraints analyzed in the detailed report include:
- Edge Computing Workload Densification at Branch Sites
- Mandatory Network Access Control Compliance in Regulated Industries
- Skills Gap in Managing Policy-Driven Fabric Architectures
For complete list of drivers and restraints, kindly check the Table Of Contents.
Segment Analysis
Traditional 1 GbE and below ports held 52.18% market share in 2025, sustained by the installed base of legacy endpoints and the economic inertia of organizations deferring infrastructure refresh until end-of-support deadlines force action. The 2.5/5 GbE tier, anchored in IEEE 802.3bz, is forecast to outpace every other speed class with a 12.84 % CAGR through 2031. Enterprises treat multi-gig as a bridge between legacy 1 GbE endpoints and future 10 GbE fiber, preserving existing copper runs while meeting Wi-Fi 7 backhaul needs. Vendor roadmaps now default to multi-gig plus IEEE 802.3bt power budgets, signaling that 1 GbE will gradually enter maintenance mode.
Mature 10 GbE optics support uplinks and server access at falling price points, while 25/40 GbE and above remain concentrated in data-center racks that require east-west throughput. The access layer switch market size for multi-gig is projected to reach meaningful parity with 1 GbE by 2028, solidifying its role as the new default. At the same time, improved interoperability and vendor standardization are reducing deployment friction, accelerating enterprise-wide adoption of multi-gig infrastructure.
Mid-range 24-48-port devices dominated the market with 42.26% market share in 2025 wiring closets due to legacy device counts, yet refresh budgets increasingly tilt toward larger fixed-form-factor models that cut per-port power consumption. High-density 48-96-port switches are expected to grow at 9.26 % CAGR, benefiting from campus-aggregation consolidation and data-center top-of-rack designs that minimize cabling. This shift is also driven by the need to simplify network architecture and reduce the number of physical devices per site.
Extreme Networks and Arista offer modular port groups that mix 1 GbE, multi-gig, and 25 GbE in one chassis, enabling phased migrations without forklift upgrades. The access layer switch market share for high-density platforms is set to climb as organizations rationalize closets and seek operational economies of scale. Additionally, higher-density configurations help optimize rack space and support automation-driven network designs, making them increasingly attractive for modern campus deployments.
Complete Report Scope:
- By Port Speed
- 1 GbE and Below
- 2.5/5 GbE Multi-Gig
- 10 GbE
- 25/40 GbE
- 100 GbE
- 400 GbE and Above
- By Port Density
- Small Form Factor (8-24 ports)
- Mid-Range (24-48 ports)
- High-Density (48-96 ports)
- Ultra-High-Density (100+ ports)
- By End-user Enterprise Size
- Large Enterprises
- SMEs
- By End-User Industry
- IT and Telecom
- BFSI
- Healthcare and Lifesciences
- Manufacturing
- Government and Defense
- Education
- Retail and E-commerce
- Other End User Industries
- By Geography
- North America
- United States
- Canada
- Mexico
- South America
- Brazil
- Argentina
- Rest of South America
- Europe
- Germany
- United Kingdom
- France
- Italy
- Spain
- Russia
- Rest of Europe
- Asia-Pacific
- China
- Japan
- India
- South Korea
- Australia and New Zealand
- Rest of Asia-Pacific
- Middle East
- Saudi Arabia
- United Arab Emirates
- Turkey
- Rest of Middle East
- Africa
- South Africa
- Nigeria
- Rest of Africa
- North America
Geography Analysis
North America held 38.46 % of 2025 revenue due to entrenched campus modernizations, higher-education refreshes, and early zero-trust adoption across healthcare and federal agencies. Budget certainty and mature partner ecosystems underpin a predictable refresh cadence, although slowing replacement in small branches caps upside. In addition, widespread adoption of cloud-managed networking and advanced security frameworks continues to reinforce steady demand across enterprise campuses.
Europe follows closely, propelled by NIS2 and DORA mandates that require authenticated device access and continuous monitoring. Energy-efficient Ethernet goals tied to net-zero pledges spur PoE switch upgrades in corporate campuses, while public-sector approvals prolong deal cycles. Eastern European manufacturing corridors add incremental demand as industrial IoT pilots scale, further supported by EU funding programs aimed at digital infrastructure modernization.
Asia-Pacific is the fastest-growing geography at 9.54 % CAGR. India's Digital India program earmarked INR 1.5 trillion (USD 18 billion) for smart-city and broadband projects, while China's 14th Five-Year Plan prioritizes industrial internet build-outs. ASEAN's Smart Cities Network and Japan's Society 5.0 schemes likewise elevate regional spending. These multi-year directives ensure sustained momentum for the access layer switch market in the region, with greenfield deployments and rapid enterprise expansion driving incremental growth.
- Cisco Systems, Inc.
- Huawei Technologies Co., Ltd.
- Hewlett Packard Enterprise Company
- Arista Networks, Inc.
- Extreme Networks, Inc.
- Dell Technologies Inc.
- Fortinet, Inc.
- TP-Link Technologies Co., Ltd.
- D-Link Corporation
- Alcatel-Lucent Enterprise (ALE International SAS)
- Ubiquiti Inc.
- Zyxel Communications Corporation
- Ruijie Networks Co., Ltd.
- Edgecore Networks Corporation
- Allied Telesis Holdings K.K.
- MikroTikls SIA
- Avaya LLC
- NETGEAR, Inc.
- Cumulus Networks
- Sophos Ltd.
Additional Benefits:
- The market estimate (ME) sheet in Excel format
- 3 months of analyst support
TABLE OF CONTENTS
1 INTRODUCTION
- 1.1 Study Assumptions and Market Definition
- 1.2 Scope of the Study
2 RESEARCH METHODOLOGY
3 EXECUTIVE SUMMARY
4 MARKET LANDSCAPE
- 4.1 Market Overview
- 4.2 Market Drivers
- 4.2.1 Accelerated Campus Digitalization in Education Vertical
- 4.2.2 Surge in Wi-Fi 6 and Wi-Fi 7 Access Point Roll-outs
- 4.2.3 Edge Computing Workload Densification at Branch Sites
- 4.2.4 Mandatory Network Access Control Compliance in Regulated Industries
- 4.2.5 Open-Networking Disaggregation Momentum in Telecom Access
- 4.2.6 Energy-Efficient Ethernet Adoption Targets under Net-Zero Mandates
- 4.3 Market Restraints
- 4.3.1 Supply Chain Volatility of Merchant Switch ASICs
- 4.3.2 Skills Gap in Managing Policy-Driven Fabric Architectures
- 4.3.3 Rising Substitution by High-End WLAN for SMB Segments
- 4.3.4 Prolonged Capex Cycles in Public Sector Networks
- 4.4 Industry Value Chain Analysis
- 4.5 Regulatory Landscape
- 4.6 Technological Outlook
- 4.7 Impact of Macroeconomic Factors on the Market
- 4.8 Porter's Five Forces Analysis
- 4.8.1 Threat of New Entrants
- 4.8.2 Bargaining Power of Suppliers
- 4.8.3 Bargaining Power of Buyers
- 4.8.4 Threat of Substitutes
- 4.8.5 Intensity of Competitive Rivalry
5 MARKET SIZE AND GROWTH FORECASTS (VALUE)
- 5.1 By Port Speed
- 5.1.1 1 GbE and Below
- 5.1.2 2.5/5 GbE Multi-Gig
- 5.1.3 10 GbE
- 5.1.4 25/40 GbE
- 5.1.5 100 GbE
- 5.1.6 400 GbE and Above
- 5.2 By Port Density
- 5.2.1 Small Form Factor (8-24 ports)
- 5.2.2 Mid-Range (24-48 ports)
- 5.2.3 High-Density (48-96 ports)
- 5.2.4 Ultra-High-Density (100+ ports)
- 5.3 By End-user Enterprise Size
- 5.3.1 Large Enterprises
- 5.3.2 SMEs
- 5.4 By End-User Industry
- 5.4.1 IT and Telecom
- 5.4.2 BFSI
- 5.4.3 Healthcare and Lifesciences
- 5.4.4 Manufacturing
- 5.4.5 Government and Defense
- 5.4.6 Education
- 5.4.7 Retail and E-commerce
- 5.4.8 Other End User Industries
- 5.5 By Geography
- 5.5.1 North America
- 5.5.1.1 United States
- 5.5.1.2 Canada
- 5.5.1.3 Mexico
- 5.5.2 South America
- 5.5.2.1 Brazil
- 5.5.2.2 Argentina
- 5.5.2.3 Rest of South America
- 5.5.3 Europe
- 5.5.3.1 Germany
- 5.5.3.2 United Kingdom
- 5.5.3.3 France
- 5.5.3.4 Italy
- 5.5.3.5 Spain
- 5.5.3.6 Russia
- 5.5.3.7 Rest of Europe
- 5.5.4 Asia-Pacific
- 5.5.4.1 China
- 5.5.4.2 Japan
- 5.5.4.3 India
- 5.5.4.4 South Korea
- 5.5.4.5 Australia and New Zealand
- 5.5.4.6 Rest of Asia-Pacific
- 5.5.5 Middle East
- 5.5.5.1 Saudi Arabia
- 5.5.5.2 United Arab Emirates
- 5.5.5.3 Turkey
- 5.5.5.4 Rest of Middle East
- 5.5.6 Africa
- 5.5.6.1 South Africa
- 5.5.6.2 Nigeria
- 5.5.6.3 Rest of Africa
- 5.5.1 North America
6 COMPETITIVE LANDSCAPE
- 6.1 Market Concentration
- 6.2 Strategic Moves
- 6.3 Market Share Analysis
- 6.4 Company Profiles (includes Global Level Overview, Market Level Overview, Core Segments, Financials as available, Strategic Information, Market Rank/Share, Products and Services, Recent Developments)
- 6.4.1 Cisco Systems, Inc.
- 6.4.2 Huawei Technologies Co., Ltd.
- 6.4.3 Hewlett Packard Enterprise Company
- 6.4.4 Arista Networks, Inc.
- 6.4.5 Extreme Networks, Inc.
- 6.4.6 Dell Technologies Inc.
- 6.4.7 Fortinet, Inc.
- 6.4.8 TP-Link Technologies Co., Ltd.
- 6.4.9 D-Link Corporation
- 6.4.10 Alcatel-Lucent Enterprise (ALE International SAS)
- 6.4.11 Ubiquiti Inc.
- 6.4.12 Zyxel Communications Corporation
- 6.4.13 Ruijie Networks Co., Ltd.
- 6.4.14 Edgecore Networks Corporation
- 6.4.15 Allied Telesis Holdings K.K.
- 6.4.16 MikroTikls SIA
- 6.4.17 Avaya LLC
- 6.4.18 NETGEAR, Inc.
- 6.4.19 Cumulus Networks
- 6.4.20 Sophos Ltd.
7 MARKET OPPORTUNITIES AND FUTURE OUTLOOK
- 7.1 White-Space and Unmet-Need Assessment

 葉脊開關:市佔率分析、產業趨勢與統計、成長預測(2026-2031)DIN導軌安裝開關:市場佔有率分析、產業趨勢與統計、成長預測(2026-2031年)乙太網路切換器:市場佔有率分析、產業趨勢與統計、成長預測(2026-2031)支援SDN的交換器:市場佔有率分析、行業趨勢和統計數據以及成長預測(2026-2031年)乙太網路供電 (PoE)++ 交換器:市場佔有率分析、行業趨勢和統計數據以及成長預測 (2026-2031)
 乙太網路切換器市場 - 全球產業規模、佔有率、趨勢、機會、預測:按類型、配置、速度、地區和競爭格局分類,2021-2031年乙太網路供電 (PoE) 交換器:市場佔有率分析、行業趨勢和統計數據以及成長預測 (2026-2031)工業乙太網網路交換器:市場佔有率分析、產業趨勢與統計、成長預測(2026-2031)管理型交換器:市場佔有率分析、產業趨勢與統計、成長預測(2026-2031 年)非網管型交換器:市場佔有率分析、產業趨勢與統計、成長預測(2026-2031 年)