


 |
市場調查報告書
商品編碼
2073024
乙太網路供電 (PoE)++ 交換器:市場佔有率分析、行業趨勢和統計數據以及成長預測 (2026-2031)Power Over Ethernet (PoE) ++ Switch - Market Share Analysis, Industry Trends & Statistics, Growth Forecasts (2026 - 2031) |
||||||

※ 本網頁內容可能與最新版本有所差異。詳細情況請與我們聯繫。
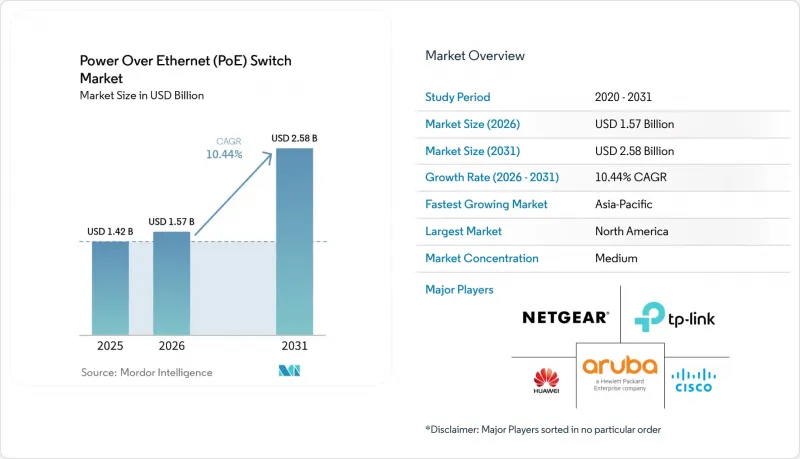
根據 Mordor Intelligence 預測,乙太網路供電 (PoE)++ 交換器市場將從 2025 年的 14.2 億美元和 2026 年的 15.7 億美元成長到 2031 年的 25.8 億美元,2026 年至 2031 年的複合年成長率為 10.44%。
本報告按功率輸出(60瓦及以下、60-90瓦及以上)、交換機類型(非網管型、全網管二層交換器及其他)、端口密度(5-8端口、9-16端口及其他)、應用領域(IP監控和保全攝影機及其他)、最終用戶行業(商業和企業、住宅及其他)以及地區進行細分。市場預測以美元計價。
全球乙太網路供電 (PoE)++ 交換器市場趨勢與洞察
物聯網終端和IP監視錄影機。
連接終端數量的不斷成長仍然是乙太網路供電 (PoE)++ 交換器市場最顯著的需求推動要素。這是因為隨著新增攝影機、網路基地台、感測器叢集或智慧照明節點的增加,存取層的負載也會隨之增加。電腦視覺相機在這方面特別值得關注,因為現代 PTZ 系統整合了分析功能、紅外線照明和運動偵測,所需的功率遠高於傳統的 1080p 設備。據 Axis 稱,Q6358-LE 的功耗高達 51W,這意味著它必須使用支援 802.3bt 的電源才能正常運作。當監控負責人在不升級現有交換設備的情況下更換已安裝的攝影機時,他們通常發現瓶頸不在於光模組或頻寬,而在於連接埠級供電供給能力。這實際上改變了設備更新的時機,因為攝影機部署會持續進行,而交換器升級則會在電源短缺問題出現後立即進行。因此,在許多建築部署中,攝影機更換週期正在成為加速乙太網路供電 (PoE)++ 交換器市場更廣泛硬體投資的因素。
部署每個連接埠需要 60W 或更高功率的 Wi-Fi 6/6E網路基地台。
新型 Wi-Fi 6E 和 Wi-Fi 7網路基地台提高了乙太網路供電 (PoE)++ 交換器市場的基本電源需求,因為如果部署在較舊的 802.3af 或 802.3at 基礎設施上,其功能將受到限制。根據思科 Catalyst 9166 系列的文檔,IEEE 802.3bt UPOE 支援完整的三頻運行、5 Gbps 多Gigabit埠和 USB IoT 輸出,但在低功耗模式下功能有限。同樣,HPE Aruba 的指南將 802.3bt Class 6 定位為新型 Wi-Fi 6E 部署的實用基準,強調了即使在用戶過渡到 Wi-Fi 7 升級週期之前,高功率交換的重要性。思科和瞻博網路也明確指出,其Wi-Fi 7平台(例如CW9178I和AP47)需要Type 4供電才能實現完整的雙4x4多鏈路運行,從而確保在園區規劃的早期階段就考慮到電源設計。一個48埠的平台,每個連接埠功耗為90W,可以滿足4320W的PoE供電預算,這使得機房級規劃從傳統的接取交換器選擇框架轉變為更廣泛的、全設施範圍的電源規劃。因此,無線升級週期現在是乙太網路供電(PoE)++交換器市場最有前景的短期升級途徑之一。
802.3bt交換器組件成本(物料清單)增加和熱設計負擔加重
4 型交換器比傳統的 802.3at 平台更為複雜,這種複雜性持續阻礙乙太網路供電 (PoE)++ 交換器市場的升級進程。每個連接埠透過四對電纜同時傳輸 90W 的功率和數據,需要高效的 DC-DC 轉換、高精度感測電路、更強大的溫度控管以及大規模的內部電源設計。思科 C9350-48HX 清楚地展現了這些要求的規模:在滿載運作時,90W 的功率輸出需要三個 1600W 熱插拔鈦金認證電源以及 StackPower+ 支援。對於中小型企業買家而言,電源、線升級和散熱系統調整的成本可能會使總部署成本達到同等 802.3at 配置的兩到三倍。這種成本差異使得大多數部署方案仍停留在 PoE+ 級別,尤其是在無線和攝影機需求尚未達到需要更高功率閾值的專案中。在北美的大型企業專案之外,這種限制最為明顯,因為在這些專案中,買家往往不太能接受單一週期內硬體和基礎設施成本的急劇成長。
細分市場分析
到2025年,60W以下功率的乙太網路供電(PoE)++交換器市場仍將佔42.2%的佔有率。這是因為VoIP電話、基礎無線網路基地台和傳統IP攝影機等設備的部署仍在持續更新,以適應傳統的供電等級。大規模的部署基數確保了低功率市場在設備需求不斷成長的情況下仍然保持強勁成長,因為在許多分店和樓層級別的升級改造中,持續性和低前期成本仍然至關重要。 60-90W功率的乙太網路供電(PoE)++交換器市場是成長最快的細分市場,預計2026年至2031年的複合年成長率將達到18.4%。這一成長與支援Wi-Fi 6E和Wi-Fi 7的無線設備、AI驅動的PTZ攝影機以及其他需要6級或8級供電才能充分發揮其性能的終端設備直接相關。雖然超過 90 瓦的類別在出貨量方面仍處於早期階段,但思科在 UPOE+ 及其新型多無線電平台的功率特性方面所做的努力表明,在某些部署中,上限已經得到了測試。
乙太網路供電 (PoE)++ 交換器市場也正受到邊緣運算融合的影響,交換器不再只是電源層和傳輸層設備。思科的 C9350 平台,憑藉四核心x86 CPU 和 16 GB DDR5 記憶體的存取層,支援第三方容器在交換器上運行,同時為終端叢集提供高功率 PoE 供電。這正在改變規劃的假設,因為交換器在機房內的熱量和供電條件越來越接近小規模邊緣伺服器環境,而非傳統的評估機房。在歐洲,由於報告和能源監控方面的要求,託管式 802.3bt 平台更具優勢,因為非託管式方案無法在受監管的環境中提供所需的連接埠級可視性。
預計到 2025 年,全管理型二層交換器將佔據乙太網路供電 (PoE++) 交換器市場 46.1% 的佔有率。這反映出,許多企業部署仍依賴基於 VLAN 的策略和存取邊緣的二層智慧。由於許多分店、園區樓層和標準商業部署環境優先考慮操作熟悉性而非架構變更,因此該細分市場依然龐大。非管理型和智慧/混合管理型產品繼續面向中小企業 (SMB) 和中型企業市場,在這些市場中,低前期成本和易於部署比廣泛的自動化功能更為重要。全管理型三層交換器是乙太網路供電 (PoE++) 交換器市場中成長最快的交換器類型,預計 2026 年至 2031 年的複合年成長率 (CAGR) 將達到 18.2%。其主要原因是向 EVPN-VXLAN 園區網路架構的轉變。這種架構允許將 IT 和 IoT 流量分離,而無需讓它們經過更高層的設備,而是透過在存取層進行路由和策略執行來實現。
Juniper 於 2025 年 2 月發布的 EX4000 正是這一發展方向的典型例證,它融合了 802.3bt PoE++、Mist AI 遙測、虛擬機箱堆疊以及快速啟動等功能,可滿足現代接入環境部署的需求。另一個轉變是在連接埠層級應用零信任機制,隨著建築系統和使用者流量共用相同網路邊緣,此機制的重要性日益凸顯。 Fortinet 透過 FortiLink 將其 FortiSwitch 產品線與 FortiGate 整合,無需單獨的設備層即可實現動態 NAC 策略和設備設定檔。這拓展了乙太網路供電 (PoE++) 交換器產業的功能,使其不再局限於簡單的連接,而是成為政府、醫療保健和其他受監管部署中更為核心的控制點。
區域分析
到2025年,北美將佔據乙太網路供電(PoE++)交換器市場37.1%的佔有率,繼續維持其最大的區域市場地位,這主要得益於企業園區和政府機構中管理型交換機的高滲透率。在美國,聯邦政府的智慧建築現代化計畫以及對高性能園區接取網路的持續需求,鞏固了北美市場的領先地位。在加拿大,管理服務的擴展和醫療保健IT的升級帶來了需求的成長,推動了各類機構環境的穩定採購。在墨西哥,工業園區建設和酒店項目帶動了銷售量的成長。這些項目允許在新設施中從一開始就部署高等級的佈線和管理型存取網路。此外,永續性合規性正成為該地區重要的採購因素,因為大規模設施對能夠提供簡單資料傳輸和供電功能,同時具備能源遙測功能的管理型PoE交換器的需求日益成長。
亞太地區是乙太網路供電(PoE)++交換器市場成長最快的地區,預計到2031年將以12.9%的複合年成長率成長。中國是成長的主要驅動力,智慧城市、交通運輸、公共安全和建築自動化專案都在推動對高功率存取層設備的需求。中國工業與資訊化部設定了2028年物聯網聯網設備數量超過100億台、核心物聯網產業規模超過3.5兆元人民幣的目標。根據本分析所採用的2025年平均外匯計算,這相當於4,860億美元,進一步提升了下游基礎設施的需求規模。 2026年3月,中石化天津子公司訂購了以PoE為基礎的照明和影像監控終端,顯示工業買家也加入了該地區的PoE應用浪潮。印度和日本進一步擴大了這個整體情況。印度的數位化和智慧城市計畫正在支援乙太網路主導的接取網路,而日本則在工廠自動化領域增加了更多與機器人引導和邊緣人工智慧攝影機相關的增值用例。
歐洲在乙太網路供電 (PoE)++ 交換器市場中保持著強勁的地位。這得歸功於旨在減少新建和現有非住宅建築(實現零排放)初級能源消耗的政策框架,該框架持續支持維修活動。德國、英國和法國仍然是高階智慧建築市場的核心,但俄羅斯與西方供應鏈的脫鉤正在改變其採購模式,使其轉向國內和中國供應商。南美洲的市場規模雖然小規模,但隨著國際租戶擴大在聖保羅和布宜諾斯艾利斯指定使用符合 LEED 標準的 PoE 基礎設施,巴西和阿根廷的專案主導部署正在興起。中東和非洲的市場規模仍然是最小的區域,但沿岸地區基於「沙烏地阿拉伯 2030 願景」和阿拉伯聯合大公國「數位城市」計畫的項目,正在創造高於平均水平的監控和建築自動化網路需求,而高功率 PoE 交換機在這些網路中備受青睞。
其他好處:
- Excel格式的市場預測(ME)表
- 3個月的分析師支持
目錄
第1章:引言
- 研究假設和市場定義
- 調查範圍
第2章:調查方法
第3章執行摘要
第4章 市場狀況
- 市場概覽
- 市場促進因素
- 物聯網終端和IP監視錄影機。
- 利用PoE供電的LED照明進行智慧建築維修
- 部署每個連接埠需要 60W 或更高功率的 Wi-Fi 6/6E網路基地台。
- 能源效率法規鼓勵遠端電力監控。
- 帶加熱功能和雲台(60瓦或以上)的邊緣AI鏡頭
- 以環境、社會和治理(ESG)為導向,減少企業網路中銅纜數量的目標
- 市場限制因素
- 802.3bt 90W交換器的組件成本上升和散熱設計問題
- Cat5e/Cat6電纜的長度和直徑受到傳統限制
- 新興的 USB-C Power-Delivery-Over-IP 替代技術
- 高效能直流-直流轉換器積體電路的供應鏈面臨壓力。
- 產業價值鏈分析
- 監理情勢
- 技術展望
- 波特五力分析
- 價格分析
第5章 市場規模與成長預測
- 依輸出類型
- 最高可達 60W(PoE/PoE+)
- 60~90 W(PoE++)
- 90瓦或以上(下一代高功率)
- 按開關類型
- 未管理
- 智慧/混合管理
- 完全託管的二樓
- 完全託管的三層
- 按端口密度分類的端口密度
- 5-8個端口
- 9-16個端口
- 17-24個端口
- 25-48個端口
- 48 個或更多端口
- 透過使用
- IP監視錄影機與安防攝影機
- 無線存取點和WLAN基礎設施
- VoIP和整合通訊設備
- LED照明系統
- 建築自動化和智慧控制
- 物聯網閘道器和邊緣運算設備
- 按最終用戶行業分類
- 適用於商業和企業用途
- 工業和製造業
- 政府、國防、智慧城市
- 住宅
- 醫療保健和教育
- 其他終端用戶產業
- 按地區
- 北美洲
- 美國
- 加拿大
- 墨西哥
- 南美洲
- 巴西
- 阿根廷
- 其他南美國家
- 歐洲
- 德國
- 英國
- 法國
- 義大利
- 西班牙
- 俄羅斯
- 其他歐洲國家
- 亞太地區
- 中國
- 日本
- 印度
- 韓國
- ASEAN
- 大洋洲
- 其他亞太國家
- 中東和非洲
- 中東
- 沙烏地阿拉伯
- 阿拉伯聯合大公國
- 土耳其
- 其他中東國家
- 非洲
- 南非
- 奈及利亞
- 其他非洲國家
- 中東
- 北美洲
第6章 競爭情勢
- 市場集中度
- 策略趨勢
- 市佔率分析
- 公司簡介
- Cisco Systems, Inc.
- Huawei Technologies
- Hewlett Packard Enterprise(Aruba)
- Netgear, Inc.
- TP-Link Technologies
- D-Link Corporation
- Ubiquiti Inc.
- Juniper Networks
- Zyxel Communications
- Extreme Networks
- Fortinet Inc.
- TRENDnet Inc.
- MikroTik
- Allied Telesis
- Belden(Hirschmann)
- Siemens AG
- Planet Technology
- Antaira Technologies
- Red Lion Controls
- Ruckus Networks(CommScope)
第7章 市場機會與未來展望
According to Mordor Intelligence, the power over Ethernet (PoE) ++ switch market size is projected to expand from USD 1.42 billion in 2025 and USD 1.57 billion in 2026 to USD 2.58 billion by 2031, registering a CAGR of 10.44% over 2026-2031.
This report is Segmented by Power Output (Up Io 60 W, 60-90 W, and More), Switch Type (Unmanaged, Fully Managed Layer 2, and More), Port Density (5-8 Ports, 9-16 Ports, and More), Application (IP Surveillance and Security Cameras, and More), End-User Industry (Commercial and Enterprise, Residential, and More), and Geography. The Market Forecasts are Provided in Terms of Value (USD).
Global Power Over Ethernet (PoE) ++ Switch Market Trends and Insights
Proliferation of IoT Endpoints and IP Surveillance Cameras
The growth of connected endpoints remains the clearest demand driver for the Power over Ethernet (PoE) ++ switch market, as every new camera, access point, sensor cluster, or smart-lighting node adds to the load on the access layer. Computer-vision cameras stand out in this mix because newer PTZ systems combine analytics, infrared illumination, and motion features that require much more power than older 1080p devices. Axis states that the Q6358-LE can draw up to 51 W, placing it firmly in the range where 802.3bt-capable source equipment is required for full operation. When surveillance operators replace installed cameras without replacing older switching gear, they often find that the bottleneck is not optics or bandwidth, but port-level power availability. That shifts refresh timing in practical ways, because the camera project starts first, but the switch upgrade follows immediately once the power gap becomes visible. In many building deployments, the camera cycle is therefore becoming the event that brings forward broader hardware spending in the Power over Ethernet (PoE) ++ switch market.
Wi-Fi 6/6E Access-Point Roll-Outs Requiring 60 W or More per Port
New Wi-Fi 6E and Wi-Fi 7 access points are raising baseline power expectations in the Power over Ethernet (PoE) ++ switch market, because they lose features when deployed on older 802.3af or 802.3at infrastructure. Cisco documentation for the Catalyst 9166 series shows that IEEE 802.3bt UPOE supports full tri-radio operation, a 5 Gbps Multigigabit port, and USB IoT output, while lower-power modes reduce capability. HPE Aruba guidance similarly positions 802.3bt Class 6 as the practical baseline for new Wi-Fi 6E deployments, which makes higher-power switching relevant even before buyers move into Wi-Fi 7 refresh cycles. Cisco and Juniper also document that Wi-Fi 7 platforms such as the CW9178I and AP47 require Type 4 delivery for full dual-4x4 multi-link operation, which pulls power design into the earliest stages of campus planning. A 48-port platform running 90 W per port can support a 4,320 W PoE budget, shifting closet-level planning from a typical access switch decision to a broader facility power decision. That is why wireless refresh cycles are now creating one of the strongest near-term upgrade paths for the Power over Ethernet (PoE) ++ switch market.
Higher BOM and Thermal Design Burden for 802.3bt Switches
A Type 4 switch is a more complex product than an older 802.3at platform, and that complexity continues to slow some upgrades in the Power over Ethernet (PoE) ++ switch market. Running simultaneous power and data over all 4 cable pairs at 90 W per port requires efficient DC-DC conversion, precision detection circuitry, stronger heat management, and larger internal power design. Cisco's C9350-48HX illustrates the scale of that requirement, because full-density 90 W delivery depends on three hot-swappable 1,600 W Titanium-rated power supplies and StackPower+ support. For SMB and mid-enterprise buyers, the cost of power supplies, cabling upgrades, and cooling adjustments can raise total deployment cost to 2-3 times that of a comparable 802.3at setup. That gap keeps a large part of the installed base in the PoE+ tier, especially in projects where wireless or camera demand has not yet crossed the threshold that forces higher wattage. The restraint is strongest outside large North American enterprise programs, where buyers are less willing to absorb a single-cycle jump in both hardware and infrastructure cost.
Other drivers and restraints analyzed in the detailed report include:
- Smart-Building Retrofits Adopting PoE-Powered LED Lighting
- Energy-Efficiency Regulations Favoring Remote Power Monitoring
- Legacy Cabling Length and Gauge Limitations
For complete list of drivers and restraints, kindly check the Table Of Contents.
Segment Analysis
Up to 60 W retained 42.2% of the Power over Ethernet (PoE) ++ switch market size in 2025, because the installed base of VoIP phones, basic wireless access points, and older IP cameras still renews on legacy power classes. That large base gives the lower-wattage tier durability even as device requirements move upward, since many branch and floor-level refreshes still favor continuity and lower upfront cost. The 60-90 W segment is the fastest-growing tier in the Power over Ethernet (PoE) ++ switch market, with an 18.4% CAGR projected from 2026 to 2031. That growth is tied directly to Wi-Fi 6E and Wi-Fi 7 radios, AI-enabled PTZ cameras, and other endpoints that need Class 6 or Class 8 delivery for full features. The above 90 W category remains early in volume terms, but Cisco's UPOE+ path and the power profiles of newer multiradio platforms show that the upper boundary is already being tested in select deployments.
The Power over Ethernet (PoE) ++ switch market is also being shaped by edge-compute convergence, because the switch is no longer only a power source and transport layer. Cisco's C9350 platform brings a quad-core x86 CPU and 16 GB DDR5 memory into the access layer so that third-party containers can run on the switch while it also supplies high-wattage PoE to endpoint clusters. That shifts planning assumptions, since switch heat output and closet power availability begin to look closer to small edge-server environments than traditional access closets. In Europe, reporting and energy-monitoring obligations further favor managed 802.3bt platforms, because unmanaged alternatives cannot support the same level of per-port visibility needed in regulated settings.
Fully Managed Layer 2 accounted for 46.1% of the Power over Ethernet (PoE++) switch market share in 2025, reflecting how much of the enterprise installed base still depends on VLAN-based policy and Layer 2 intelligence at the access edge. This segment remains large because many branch offices, campus floors, and standard commercial deployments still prioritize operational familiarity over architectural change. Unmanaged and Smart or Hybrid Managed products continue to serve the SMB and mid-market base, where lower upfront cost and simple deployment still matter more than broad automation features. Fully Managed Layer 3 is the fastest-growing switch type in the Power over Ethernet (PoE) ++ switch market, at an 18.2% CAGR from 2026 to 2031. The main reason is the move toward EVPN-VXLAN campus fabrics, where routing and policy enforcement at the access layer help separate IT and IoT traffic without sending flows back through higher-tier devices.
Juniper's February 2025 EX4000 launch is a clear example of this direction, because it pairs 802.3bt PoE++, Mist AI telemetry, Virtual Chassis stacking, and fast boot times for modern access deployments. Another point of change is zero-trust enforcement at the port, which is becoming more important as building systems and user traffic share the same network edge. Fortinet positions its FortiSwitch line with FortiGate integration through FortiLink, allowing dynamic NAC policy and device profiling without the need for a separate appliance layer. That lifts the role of the Power over Ethernet (PoE++) switch industry beyond simple connectivity and makes switching a more central control point in government, healthcare, and other regulated deployments.
Complete Report Scope:
- By Power Output
- Up to 60 W (PoE/PoE+)
- 60 - 90 W (PoE++)
- Above 90 W (next-gen high-power)
- By Switch Type
- Unmanaged
- Smart/Hybrid Managed
- Fully Managed Layer 2
- Fully Managed Layer 3
- By Port Density
- 5-8 Ports
- 9-16 Ports
- 17-24 Ports
- 25-48 Ports
- Above 48 Ports
- By Application
- IP Surveillance and Security Cameras
- Wireless Access Points and WLAN Infrastructure
- VoIP and Unified Communication Devices
- LED Lighting Systems
- Building Automation and Smart Controls
- IoT Gateways and Edge Computing Devices
- By End-User Industry
- Commercial, and Enterprise
- Industrial and Manufacturing
- Government, Defense, and Smart Cities
- Residential
- Healthcare and Education
- Other End-User Industries
- By Geography
- North America
- United States
- Canada
- Mexico
- South America
- Brazil
- Argentina
- Rest of South America
- Europe
- Germany
- United Kingdom
- France
- Italy
- Spain
- Russia
- Rest of Europe
- Asia-Pacific
- China
- Japan
- India
- South Korea
- ASEAN
- Oceania
- Rest of Asia-Pacific
- Middle East and Africa
- Middle East
- Saudi Arabia
- United Arab Emirates
- Turkey
- Rest of the Middle East
- Africa
- South Africa
- Nigeria
- Rest of Africa
- Middle East
- North America
Geography Analysis
North America held 37.1% of the Power over Ethernet (PoE) ++ switch market share in 2025, and it remained the largest regional base because enterprise campuses and government facilities already have deep managed-switch penetration. The United States supported this lead through federal smart-building modernization programs and continued demand for higher-performance campus access networks. Canada added demand through managed services expansion and healthcare IT upgrades, which supported steady purchasing across institutional environments. Mexico contributed incremental volume from industrial zone builds and hospitality projects, where new properties can install higher-grade cabling and managed access networks from the outset. Sustainability compliance is also becoming a stronger buying factor in this region, because large facilities increasingly want managed PoE switches that can provide energy telemetry rather than only transport and power.
Asia-Pacific is the fastest-growing regional block in the Power over Ethernet (PoE) ++ switch market, and it is forecast to expand at a 12.9% CAGR through 2031. China is the main growth engine because smart-city, transportation, public security, and building automation projects are all adding demand for higher-power access-layer equipment. The Ministry of Industry and Information Technology set a target of more than 10 billion IoT device connections by 2028 and a core IoT industry size above CNY 3.5 trillion, equal to USD 486 billion at the 2025 IRS average exchange rate retained in the input, which reinforces the scale of downstream infrastructure demand. In March 2026, Sinopec's Tianjin subsidiary issued procurement for PoE-based lighting and video monitoring terminals, showing that industrial buyers are also joining the regional adoption curve. India and Japan broaden the picture, because India's digitalization and smart-city programs support Ethernet-led access networks while Japan adds higher-value factory automation use cases tied to robotic guidance and edge-AI cameras.
Europe kept a steady position in the Power over Ethernet (PoE) ++ switch market, because the policy framework for zero-emission new construction and lower primary energy use in existing non-residential buildings continues to support retrofit activity. Germany, the United Kingdom, and France remain the core premium smart-building markets, while Russia's separation from Western supply chains is shifting procurement patterns toward domestic and Chinese suppliers. South America is smaller in absolute value, but Brazil and Argentina are still seeing project-led uptake in Sao Paulo and Buenos Aires where international tenants increasingly specify LEED-aligned PoE infrastructure. Middle East and Africa remains the smallest regional block by volume, yet Gulf projects under Saudi Vision 2030 and UAE digital-city programs are creating above-average demand for surveillance and building-automation networks that favor higher-wattage PoE switching.
- Cisco Systems, Inc.
- Huawei Technologies
- Hewlett Packard Enterprise (Aruba)
- Netgear, Inc.
- TP-Link Technologies
- D-Link Corporation
- Ubiquiti Inc.
- Juniper Networks
- Zyxel Communications
- Extreme Networks
- Fortinet Inc.
- TRENDnet Inc.
- MikroTik
- Allied Telesis
- Belden (Hirschmann)
- Siemens AG
- Planet Technology
- Antaira Technologies
- Red Lion Controls
- Ruckus Networks (CommScope)
Additional Benefits:
- The market estimate (ME) sheet in Excel format
- 3 months of analyst support
TABLE OF CONTENTS
1 INTRODUCTION
- 1.1 Study Assumptions and Market Definition
- 1.2 Scope of the Study
2 RESEARCH METHODOLOGY
3 EXECUTIVE SUMMARY
4 MARKET LANDSCAPE
- 4.1 Market Overview
- 4.2 Market Drivers
- 4.2.1 Proliferation of IoT Endpoints and IP Surveillance Cameras
- 4.2.2 Smart-Building Retrofits Adopting PoE-Powered LED Lighting
- 4.2.3 Wi-Fi 6/6E Access-Point Roll-Outs Requiring >=60 W Per Port
- 4.2.4 Energy-Efficiency Regulations Favoring Remote Power Monitoring
- 4.2.5 Edge-AI Cameras With Heaters and Pan-tilt Heads (More than 60 W)
- 4.2.6 ESG-Driven Copper-Cable Reduction Targets in Enterprise Networks
- 4.3 Market Restraints
- 4.3.1 Higher BOM Cost and Thermal Design for 802.3bt 90 W Switches
- 4.3.2 Legacy Cat5e/Cat6 Cabling Length and Gauge Limitations
- 4.3.3 Emerging USB-C Power-Delivery-Over-IP Alternatives
- 4.3.4 Supply-Chain Tightness for High-Efficiency DC-DC Converter ICs
- 4.4 Industry Value-Chain Analysis
- 4.5 Regulatory Landscape
- 4.6 Technological Outlook
- 4.7 Porter's Five Forces Analysis
- 4.7.1 Threat of New Entrants
- 4.7.2 Bargaining Power of Suppliers
- 4.7.3 Bargaining Power of Buyers
- 4.7.4 Threat of Substitutes
- 4.7.5 Competitive Rivalry
- 4.8 Pricing Analysis
5 MARKET SIZE AND GROWTH FORECASTS (VALUE)
- 5.1 By Power Output
- 5.1.1 Up to 60 W (PoE/PoE+)
- 5.1.2 60 - 90 W (PoE++)
- 5.1.3 Above 90 W (next-gen high-power)
- 5.2 By Switch Type
- 5.2.1 Unmanaged
- 5.2.2 Smart/Hybrid Managed
- 5.2.3 Fully Managed Layer 2
- 5.2.4 Fully Managed Layer 3
- 5.3 By Port Density
- 5.3.1 5-8 Ports
- 5.3.2 9-16 Ports
- 5.3.3 17-24 Ports
- 5.3.4 25-48 Ports
- 5.3.5 Above 48 Ports
- 5.4 By Application
- 5.4.1 IP Surveillance and Security Cameras
- 5.4.2 Wireless Access Points and WLAN Infrastructure
- 5.4.3 VoIP and Unified Communication Devices
- 5.4.4 LED Lighting Systems
- 5.4.5 Building Automation and Smart Controls
- 5.4.6 IoT Gateways and Edge Computing Devices
- 5.5 By End-User Industry
- 5.5.1 Commercial, and Enterprise
- 5.5.2 Industrial and Manufacturing
- 5.5.3 Government, Defense, and Smart Cities
- 5.5.4 Residential
- 5.5.5 Healthcare and Education
- 5.5.6 Other End-User Industries
- 5.6 By Geography
- 5.6.1 North America
- 5.6.1.1 United States
- 5.6.1.2 Canada
- 5.6.1.3 Mexico
- 5.6.2 South America
- 5.6.2.1 Brazil
- 5.6.2.2 Argentina
- 5.6.2.3 Rest of South America
- 5.6.3 Europe
- 5.6.3.1 Germany
- 5.6.3.2 United Kingdom
- 5.6.3.3 France
- 5.6.3.4 Italy
- 5.6.3.5 Spain
- 5.6.3.6 Russia
- 5.6.3.7 Rest of Europe
- 5.6.4 Asia-Pacific
- 5.6.4.1 China
- 5.6.4.2 Japan
- 5.6.4.3 India
- 5.6.4.4 South Korea
- 5.6.4.5 ASEAN
- 5.6.4.6 Oceania
- 5.6.4.7 Rest of Asia-Pacific
- 5.6.5 Middle East and Africa
- 5.6.5.1 Middle East
- 5.6.5.1.1 Saudi Arabia
- 5.6.5.1.2 United Arab Emirates
- 5.6.5.1.3 Turkey
- 5.6.5.1.4 Rest of the Middle East
- 5.6.5.2 Africa
- 5.6.5.2.1 South Africa
- 5.6.5.2.2 Nigeria
- 5.6.5.2.3 Rest of Africa
- 5.6.5.1 Middle East
- 5.6.1 North America
6 COMPETITIVE LANDSCAPE
- 6.1 Market Concentration
- 6.2 Strategic Moves
- 6.3 Market Share Analysis
- 6.4 Company Profiles (includes Global level Overview, Market level overview, Core Segments, Financials as available, Strategic Information, Market Rank/Share for key companies, Products and Services, and Recent Developments)
- 6.4.1 Cisco Systems, Inc.
- 6.4.2 Huawei Technologies
- 6.4.3 Hewlett Packard Enterprise (Aruba)
- 6.4.4 Netgear, Inc.
- 6.4.5 TP-Link Technologies
- 6.4.6 D-Link Corporation
- 6.4.7 Ubiquiti Inc.
- 6.4.8 Juniper Networks
- 6.4.9 Zyxel Communications
- 6.4.10 Extreme Networks
- 6.4.11 Fortinet Inc.
- 6.4.12 TRENDnet Inc.
- 6.4.13 MikroTik
- 6.4.14 Allied Telesis
- 6.4.15 Belden (Hirschmann)
- 6.4.16 Siemens AG
- 6.4.17 Planet Technology
- 6.4.18 Antaira Technologies
- 6.4.19 Red Lion Controls
- 6.4.20 Ruckus Networks (CommScope)
7 MARKET OPPORTUNITIES AND FUTURE OUTLOOK
- 7.1 White-Space and Unmet-Need Assessment

 葉脊開關:市佔率分析、產業趨勢與統計、成長預測(2026-2031)DIN導軌安裝開關:市場佔有率分析、產業趨勢與統計、成長預測(2026-2031年)乙太網路切換器:市場佔有率分析、產業趨勢與統計、成長預測(2026-2031)接取層交換:市場佔有率分析、產業趨勢與統計、成長預測(2026-2031)支援SDN的交換器:市場佔有率分析、行業趨勢和統計數據以及成長預測(2026-2031年)
 乙太網路切換器市場 - 全球產業規模、佔有率、趨勢、機會、預測:按類型、配置、速度、地區和競爭格局分類,2021-2031年乙太網路供電 (PoE) 交換器:市場佔有率分析、行業趨勢和統計數據以及成長預測 (2026-2031)工業乙太網網路交換器:市場佔有率分析、產業趨勢與統計、成長預測(2026-2031)管理型交換器:市場佔有率分析、產業趨勢與統計、成長預測(2026-2031 年)非網管型交換器:市場佔有率分析、產業趨勢與統計、成長預測(2026-2031 年)