


 |
市場調查報告書
商品編碼
2072574
乙太網路切換器:市場佔有率分析、產業趨勢與統計、成長預測(2026-2031)Ethernet Switch - Market Share Analysis, Industry Trends & Statistics, Growth Forecasts (2026 - 2031) |
||||||

※ 本網頁內容可能與最新版本有所差異。詳細情況請與我們聯繫。
根據 Mordor Intelligence 預測,乙太網路切換器市場預計將從 2025 年的 344.6 億美元成長到 2026 年的 374.2 億美元,到 2031 年達到 569.8 億美元,2026 年至 2031 年的複合年成長率為 8.74%。
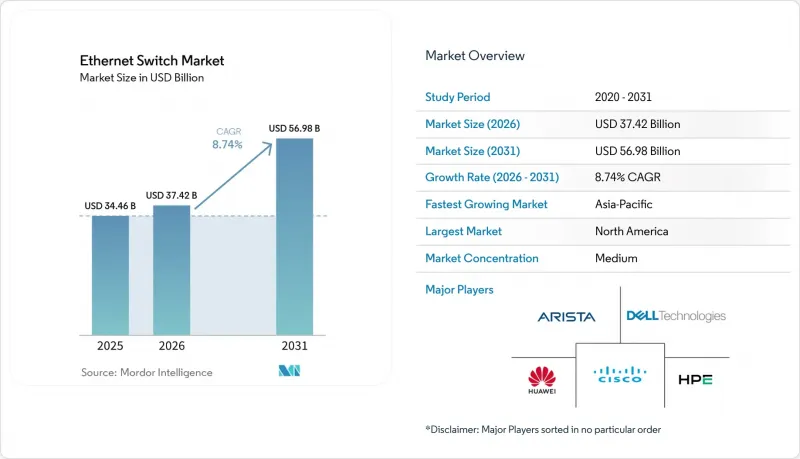
本報告按交換器類型(固定配置交換器和模組化交換器)、連接埠速度(1 GbE 或更低、2.5/5 GbE、10 GbE 及其他)、最終用戶(雲端和資料中心供應商、企業(商業辦公室和園區)、其他)、管理類型(智慧型/Web 管理型交換器、非管理型交換器及其他)和地區進行細分。市場預測以美元 (USD) 為單位。
全球乙太網路切換器市場趨勢與洞察
人工智慧工作負載導致頻寬需求增加
生成式人工智慧訓練叢集需要低延遲的網路架構,而傳統的 100 Gigabit裝置無法滿足這項需求。 Meta 公司的超級電腦「Prometheus」自 2025 年 12 月投入運作以來,將其 GPU 連接到運行速度高達 800 Gigabit的 NVIDIA Spectrum-X 交換機,充分展現了乙太網路相對於 InfiniBand 的成本優勢。 Oracle Cloud 也於 2025 年效仿,表示其平台內建的自適應路由功能已將吞吐量提升了 1.6 倍。超大規模資料中心業者目前的目標是實現 1:1 的超額訂閱比例,這將有效地使每個機架的連接埠數量翻倍。 NVIDIA 已與 Marvell 簽署了一份價值 20 億美元的客製化交換機 ASIC 契約,以確保其 DGX SuperPOD 架構的容量。隨著人工智慧叢集的功耗擴展到 1 GW 以上,800G 乙太網路正逐漸成為新建架構中脊葉式網路配置的標準選擇。
雲端資料中心的快速成長
超大規模資料中心業者持續加大資本支出,在關鍵地區建造價值數十億美元的園區。谷歌於2025年宣布的Virgo AI叢集,將跨可用區串聯客製化的800Gigabit交換機,以降低張量處理單元之間的延遲。微軟決定在阿拉伯聯合大公國投資152億美元建造5GW資料中心,這清楚地表明了對模組化底盤的需求,這種機箱每個主幹網路可聚合576個800Gigabit乙太網路端口,並透過液冷實現更高的機架密度。 SONiC等開放式網路協定棧在這種環境下正迅速普及。微軟、Meta和LinkedIn在2024年提交了超過1000次程式碼,縮短了功能發布週期。
升級到 400G 和 800G 需要大量資金投入。
一台64埠Gigabit交換器的標價接近20萬美元,而光學模組每個埠的成本又會增加1000到3000美元,這對於非超大規模企業來說是一筆不小的預算負擔。 Linear公司的插入式光學模組正在降低每比特的成本。 Arista公司於2026年4月發布的XPO模組,每個模組可提供12.8Tbps的頻寬,同時降低功耗。然而,由於歐洲地區的能源效率法規迫使通訊業者採用每個連接埠頻寬低於Gigabit的平台,許多歐洲公司正在推遲設備升級。基於使用量的租賃協議可以緩解短期現金流壓力,但最終會將成本分攤到更長的期限內。
細分市場分析
到 2025 年,固定配置單元將佔出貨量的 76.38%,成為園區接入層、零售商店和連接埠少於 48 個的工業設施的基礎。模組化底盤由於面積小,以及超大規模超大規模資料中心業者架構的需求,正以 10.18% 的複合年成長率快速成長。 Arista 的 7800R4 平台支援 576 個 800G 端口,總吞吐量達 230.4 Tbps。思科在 2025 年 12 月發布的升級版 Nexus 9800 的吞吐量上限與之相當,達到 115.2 Tbps,並且還具備即時遙測功能。
成本與效能之間的權衡持續影響買家的選擇。非網管型固定交換器以 9.11% 的複合年成長率 (CAGR) 成長,並廣泛應用於物聯網部署,以滿足管理員對即插即用的需求。智慧型 Web 管理型交換器彌合了中小企業部署 VLAN 和 QoS 的差距,使其無需承擔完整的軟體定義網路 (SDN) 的成本。整合身分感知策略和網路分段的全管理型固定設備構成了園區核心網路的基礎。雖然模組化部署預計仍將以超大規模資料中心為主,但中階市場託管服務供應商已開始指定面向未來的底盤,以應對人工智慧租戶流量不可預測的激增。
在注重成本的小規模辦公室和工業感測器領域,傳統的 1Gigabit乙太網路在 2025 年仍將佔據乙太網路切換器市場 31.12% 的佔有率。同時,400Gigabit及以上乙太網路市場正以 13.63% 的複合年成長率成長,因為 GPU叢集和分析管線對舊式網路架構提出了更高的要求。 Meta 將 Prometheus 從 InfiniBand 遷移到採用自適應路由的 800Gigabit乙太網路時,有效吞吐量提升了 1.6 倍。
雖然多Gigabit2.5/5 GbE 正在彌合 Wi-Fi 7 升級的差距,但 10 GbE 仍然是中型資料中心的主幹網路,因為這些資料中心目前尚無法承受部署 100 GbE 的成本。買家跳過 25/40 GbE,直接遷移到 100 GbE,從而壓縮了市場中端產品線。 Arista 於 2026 年 4 月發布的 XPO光學模組顯著降低了每個連接埠的功耗,即使在以前僅限於 100 GbE 的機架頂部環境中也能實現 800 GbE。這些進步將逐步降低傳統產品的市場佔有率,但由於工業終端的龐大需求,1 GbE 可能在未來十年或更長時間內仍將存在。
區域分析
2025年,北美將維持全球35.18%的銷售額,這得益於超大規模企業數十億美元的資金投入高速網路架構的部署。 Meta公司的Prometheus部署項目,耗電量達1GW,並連接了800GbE Spectrum-X交換機,清晰地展現了該地區的技術優勢。憑藉著蒙特婁水力發電的成本優勢和多倫多附近廣闊的土地,加拿大正在崛起為第二個網路中心。隨著企業向WiFi 7過渡並採用零接觸園區架構,企業領域正穩步推進現代化進程。雖然美國的監管力道不如歐洲,但美國能源局即將推出的設備功耗指南可能會長期推動對低功耗晶片的需求。
亞太地區是成長最快的地區,預計到2031年將以10.12%的複合年成長率成長。沙烏地阿拉伯斥資1,000億美元擴建人工智慧基礎設施,其中包括STC與Human合作興建的1GW資料中心,該計畫已於2025年12月啟動。阿拉伯聯合大公國計劃在微軟的支持下建造一個5GW的資料中心園區,並安裝數萬個400GbE和800GbE端口,其規模將超過沙烏地阿拉伯。在印度的二線城市,Yotta Infrastructure、CtrlS和Airtel Nxtra宣布將於2025年建造一系列邊緣運算設施,以支援區域電子商務和政府工作負載。中國的華為和H3C在國內競標佔據主導地位,但出口限制阻礙了它們的全球擴張。日本和韓國在汽車和半導體製造應用領域處於領先地位,對時間敏感型網路的需求日益成長。在澳洲和紐西蘭,基於訂閱的交換器是連接分佈在廣大地理區域的混合辦公環境的首選方案。
在歐洲,更嚴格的能源法規迫使通訊業者針對特定工作負載從 400 GbE 遷移到 100 GbE。歐盟資料中心行為準則建議將電源使用效率 (PUE) 控制在 1.3 以下,這直接影響交換器的選擇標準。在德國,IEEE 802.1DG 標準正在汽車生產線上應用;而在英國,該標準則用於滿足製造機器人的延遲要求。由於宏觀經濟壓力,東歐的基礎設施投資仍然緩慢;受制裁影響的俄羅斯市場則依賴過時的架構。在南美洲,以巴西的 5G回程傳輸計畫為首,5G 發展正在逐步推進;而非洲仍處於起步階段,目前僅在奈及利亞和南非的金融科技中心附近開展了一些小規模的試點計畫。
其他好處:
- Excel格式的市場預測(ME)表
- 3個月的分析師支持
目錄
第1章:引言
- 研究假設和市場定義
- 調查範圍
第2章:調查方法
第3章執行摘要
第4章 市場狀況
- 市場概覽
- 市場促進因素
- 雲端資料中心的快速成長
- PoE和物聯網設備的廣泛應用。
- 人工智慧工作負載導致頻寬需求增加
- 向工業4.0時代的時間敏感網路轉型
- 超大規模網路中的開放乙太網路解耦
- 二線城市邊緣資料中心的成長
- 市場限制因素
- 半導體供應鏈中斷
- 升級到 400G 和 800G 需要大量資金投入。
- 透過替代交換結構(NVLink、CXL)限制連接埠數量的成長
- 能源效率法規導致總擁有成本 (TCO) 增加
- 產業價值鏈分析
- 監理情勢
- 技術展望
- 宏觀經濟因素對市場的影響
- 波特五力分析
第5章 市場規模與成長預測
- 按開關類型
- 固定配置交換機
- 模組化開關
- 連接埠速度
- 1 GbE 或更低
- 2.5/5 GbE 多千兆以太網
- 10 GbE
- 25/40 GbE
- 100 GbE
- 400 GbE 或更高
- 最終用戶
- 雲端和資料中心供應商
- 企業(商業辦公大樓和園區)
- 電信服務供應商
- 政府/國防
- 其他最終用戶
- 依管理類型
- 智慧型/Web管理型交換機
- 非網管型交換機
- 全管理型交換機
- 按地區
- 北美洲
- 美國
- 加拿大
- 墨西哥
- 南美洲
- 巴西
- 阿根廷
- 其他南美國家
- 歐洲
- 德國
- 英國
- 法國
- 義大利
- 西班牙
- 俄羅斯
- 其他歐洲國家
- 亞太地區
- 中國
- 日本
- 印度
- 韓國
- 澳洲和紐西蘭
- 其他亞太國家
- 中東
- 沙烏地阿拉伯
- 阿拉伯聯合大公國
- 土耳其
- 其他中東國家
- 非洲
- 南非
- 奈及利亞
- 其他非洲國家
- 北美洲
第6章 競爭情勢
- 市場集中度
- 策略趨勢
- 市佔率分析
- 公司簡介
- Cisco Systems, Inc.
- Huawei Technologies Co., Ltd.
- Arista Networks, Inc.
- Hewlett Packard Enterprise Company
- Dell Technologies Inc.
- Extreme Networks, Inc.
- NETGEAR, Inc.
- Edgecore Networks Corporation
- D-Link Corporation
- TP-Link Corporation Limited
- Fortinet, Inc.
- Allied Telesis Holdings KK
- Alcatel-Lucent Enterprise(ALE International SAS)
- MikroTikls SIA
- Lenovo Group Limited
- NVIDIA Corporation
- Microchip Technology Inc.
- WAGO
- Edgecore Networks
- Ruijie Networks
第7章 市場機會與未來展望
According to Mordor Intelligence, the ethernet switch market size is expected to increase from USD 34.46 billion in 2025 to USD 37.42 billion in 2026 and reach USD 56.98 billion by 2031, growing at a CAGR of 8.74% over 2026-2031.
This report is Segmented by Switch Type (Fixed Configuration Switches, and Modular Switches), Port Speed (1 GbE and Below, 2. 5/5 GbE, 10 GbE, and More), End User (Cloud and Data Center Providers, Enterprise (Commercial Offices and Campuses), and More), Management Type (Smart / Web-Managed Switches, Unmanaged Switches, and More), and Geography. The Market Forecasts are Provided in Terms of Value (USD).
Global Ethernet Switch Market Trends and Insights
Increasing Bandwidth Demand From AI Workloads
Generative-AI training clusters require low-latency fabrics that legacy 100-gigabit gear cannot satisfy. Meta's Prometheus supercomputer, online since December 2025, connects GPUs with NVIDIA Spectrum-X switches operating at 800 gigabits per second, illustrating Ethernet's cost advantage over InfiniBand. Oracle Cloud followed in 2025, citing a 1.6-times throughput gain from adaptive routing built into the same platform. Hyperscalers are now aiming for 1:1 oversubscription ratios, effectively doubling the number of ports per rack. NVIDIA locked in USD 2 billion of custom switch ASIC supply from Marvell to guarantee capacity for its DGX SuperPOD architecture. As AI clusters scale past 1 GW of power draw, 800G Ethernet emerges as the default spine-and-leaf choice for new builds.
Proliferation of Cloud Data Centers
Capital expense among hyperscalers continues to surge, with multibillion-dollar campuses breaking ground in every major region. Google's Virgo AI cluster, unveiled in 2025, chains custom 800 gigabit switches across availability zones to reduce latency between tensor-processing units. Microsoft's USD 15.2 billion commitment to a 5 GW facility in the United Arab Emirates underscores how liquid cooling enables denser racks, thereby requiring modular chassis capable of aggregating 576 ports of 800 gigabit Ethernet per spine. Open networking stacks such as SONiC are accelerating in these environments; Microsoft, Meta, and LinkedIn submitted more than 1,000 code commits during 2024, trimming feature roll-out cycles.
High CapEx for 400G and 800G Upgrades
A 64-port 800 gigabit switch lists near USD 200,000, and optics add USD 1,000-3,000 per port, straining budgets outside hyperscale circles. Linear pluggable optics are lowering per-bit cost; Arista's XPO modules announced in April 2026 deliver 12.8 Tbps each while trimming power budgets. Even so, many European enterprises defer refreshes because the region's energy-efficiency code pushes operators toward platforms under 100 gigabit per port. Consumption-based leasing eases near-term cash flow but ultimately spreads expenses across longer periods.
Other drivers and restraints analyzed in the detailed report include:
- Growth of Edge Data Centers in Tier-2 Cities
- Rising Adoption of PoE and IoT-Enabled Devices
- Semiconductor Supply Chain Disruptions
For complete list of drivers and restraints, kindly check the Table Of Contents.
Segment Analysis
Fixed configuration units dominated shipments with 76.38% share in 2025, anchoring campus access layers, retail branches, and industrial facilities where port counts hover under 48. Modular chassis, though smaller in footprint, are expanding at a 10.18% CAGR as hyperscalers demand spine fabrics that grow line cards by line card without forklift swaps. Arista's 7800R4 platform supports 576 800 G ports and delivers 230.4 Tbps of aggregate throughput. Cisco's Nexus 9800 refresh in December 2025 rivals that ceiling at 115.2 Tbps while layering in real-time telemetry.
The cost-performance trade-off continues to shape buyer choices. Unmanaged fixed switches posting 9.11% CAGR serve IoT rollouts where administrators favor plug-and-play. Smart web-managed tiers bridge small enterprises into VLAN and QoS without the cost of full software-defined networking. Fully managed fixed gear anchors campus cores, integrating with identity-aware policies and segmentation. Modular adoption will remain hyperscale-centric, but mid-market colocation providers are starting to spec chassis to future-proof against unpredictable AI tenant bursts.
Legacy 1-gigabit still claimed 31.12% of the Ethernet switch market share in 2025, amid cost-sensitive small offices and industrial sensor fields. At the opposite end, the 400-gigabit-and-above tier is charting a 13.63% CAGR as GPU clusters and analytics pipelines overwhelm older fabrics. Meta recorded 1.6X higher effective throughput when shifting Prometheus from InfiniBand to 800 gigabit Ethernet with adaptive routing.
Multi-gigabit 2.5/5 GbE is bridging the gap to WiFi 7 refreshes, while 10 GbE remains the backbone of mid-sized data centers that cannot yet cost-justify 100 GbE. Buyers are leapfrogging 25/40 GbE straight to 100 GbE, compressing the middle of the curve. Arista's April 2026 XPO optics slash per-port power draw, enabling 800 GbE in top-of-rack footprints once limited to 100 GbE. These advances will steadily erode the legacy share, though a long tail of industrial endpoints ensures 1 GbE persists well into the next decade.
Complete Report Scope:
- By Switch Type
- Fixed Configuration Switches
- Modular Switches
- By Port Speed
- 1 GbE and Below
- 2.5/5 GbE Multi-Gig
- 10 GbE
- 25/40 GbE
- 100 GbE
- 400 GbE and Above
- By End-User
- Cloud and Data Center Providers
- Enterprise (Commercial Offices and Campuses)
- Telecommunication Service Providers
- Government and Defense
- Other End-Users
- By Management Type
- Smart / Web-Managed Switches
- Unmanaged Switches
- Fully Managed Switches
- By Geography
- North America
- United States
- Canada
- Mexico
- South America
- Brazil
- Argentina
- Rest of South America
- Europe
- Germany
- United Kingdom
- France
- Italy
- Spain
- Russia
- Rest of Europe
- Asia-Pacific
- China
- Japan
- India
- South Korea
- Australia and New Zealand
- Rest of Asia-Pacific
- Middle East
- Saudi Arabia
- United Arab Emirates
- Turkey
- Rest of Middle East
- Africa
- South Africa
- Nigeria
- Rest of Africa
- North America
Geography Analysis
North America maintained 35.18% of global revenue in 2025 as hyperscale budgets funneled billions into high-speed fabric rollouts. Meta's Prometheus deployment, consuming 1 GW and stitched together by 800 GbE Spectrum-X switches, illustrates the region's technical edge. Canada is emerging as a secondary hub, given Montreal's hydro-powered cost advantages and ample land near Toronto. Enterprise refresh momentum stays steady as organizations migrate to WiFi 7 and explore zero-touch campus architectures. Regulatory scrutiny remains lighter than in Europe, yet forthcoming U.S. Department of Energy guidelines on equipment power draw could shift demand toward lower-wattage silicon over the long term.
Asia-Pacific is the fastest-rising territory, tracking 10.12% CAGR through 2031. Saudi Arabia's USD 100 billion AI capacity drive includes a 1 GW data-center partnership between STC and Humain, launched in December 2025. The United Arab Emirates tops even that with a 5 GW campus backed by Microsoft that will install tens of thousands of 400 and 800 GbE ports. India's tier-2 cities witnessed a burst of edge-facility announcements in 2025 from Yotta Infrastructure, CtrlS, and Airtel Nxtra to serve regional e-commerce and government workloads. China's Huawei and H3C dominate domestic bids, though export controls stunt global reach. Japan and South Korea anchor automotive and semiconductor manufacturing use cases, increasingly adopting time-sensitive networking. Australia and New Zealand favor subscription-managed switches to connect hybrid offices across vast geographies.
Europe confronts tighter energy rules that nudge operators toward 100 GbE rather than 400 GbE for certain workloads. The EU's Code of Conduct for Data Centers recommends power-usage effectiveness below 1.3, which directly influences switch-selection criteria. Germany is deploying IEEE 802.1DG in automotive lines, while the United Kingdom targets manufacturing robotics latency requirements. Eastern European infrastructure spending remains subdued amid macroeconomic pressures, and Russia's sanctions-constrained market relies on older architectures. South America reports incremental gains led by Brazilian 5G backhaul projects, whereas Africa is at a nascent stage with Nigeria and South Africa piloting micro-facilities around fintech hubs.
- Cisco Systems, Inc.
- Huawei Technologies Co., Ltd.
- Arista Networks, Inc.
- Hewlett Packard Enterprise Company
- Dell Technologies Inc.
- Extreme Networks, Inc.
- NETGEAR, Inc.
- Edgecore Networks Corporation
- D-Link Corporation
- TP-Link Corporation Limited
- Fortinet, Inc.
- Allied Telesis Holdings K.K.
- Alcatel-Lucent Enterprise (ALE International SAS)
- MikroTikls SIA
- Lenovo Group Limited
- NVIDIA Corporation
- Microchip Technology Inc.
- WAGO
- Edgecore Networks
- Ruijie Networks
Additional Benefits:
- The market estimate (ME) sheet in Excel format
- 3 months of analyst support
TABLE OF CONTENTS
1 INTRODUCTION
- 1.1 Study Assumptions and Market Definition
- 1.2 Scope of the Study
2 RESEARCH METHODOLOGY
3 EXECUTIVE SUMMARY
4 MARKET LANDSCAPE
- 4.1 Market Overview
- 4.2 Market Drivers
- 4.2.1 Proliferation of Cloud Data Centers
- 4.2.2 Rising Adoption of PoE and IoT-Enabled Devices
- 4.2.3 Increasing Bandwidth Demand From AI Workloads
- 4.2.4 Transition to Time-Sensitive Networking in Industry 4.0
- 4.2.5 Open Ethernet Disaggregation in Hyperscale Networks
- 4.2.6 Growth of Edge Data Centers in Tier-2 Cities
- 4.3 Market Restraints
- 4.3.1 Semiconductor Supply Chain Disruptions
- 4.3.2 High CapEx for 400G and 800G Upgrades
- 4.3.3 Alternative Fabrics (NVLink, CXL) Curtailing Port Growth
- 4.3.4 Energy-Efficiency Regulations Elevating TCO
- 4.4 Industry Value Chain Analysis
- 4.5 Regulatory Landscape
- 4.6 Technological Outlook
- 4.7 Impact of Macroeconomic Factors on the Market
- 4.8 Porter's Five Forces Analysis
- 4.8.1 Threat of New Entrants
- 4.8.2 Bargaining Power of Suppliers
- 4.8.3 Bargaining Power of Buyers
- 4.8.4 Threat of Substitutes
- 4.8.5 Competitive Rivalry
5 MARKET SIZE AND GROWTH FORECASTS (VALUE)
- 5.1 By Switch Type
- 5.1.1 Fixed Configuration Switches
- 5.1.2 Modular Switches
- 5.2 By Port Speed
- 5.2.1 1 GbE and Below
- 5.2.2 2.5/5 GbE Multi-Gig
- 5.2.3 10 GbE
- 5.2.4 25/40 GbE
- 5.2.5 100 GbE
- 5.2.6 400 GbE and Above
- 5.3 By End-User
- 5.3.1 Cloud and Data Center Providers
- 5.3.2 Enterprise (Commercial Offices and Campuses)
- 5.3.3 Telecommunication Service Providers
- 5.3.4 Government and Defense
- 5.3.5 Other End-Users
- 5.4 By Management Type
- 5.4.1 Smart / Web-Managed Switches
- 5.4.2 Unmanaged Switches
- 5.4.3 Fully Managed Switches
- 5.5 By Geography
- 5.5.1 North America
- 5.5.1.1 United States
- 5.5.1.2 Canada
- 5.5.1.3 Mexico
- 5.5.2 South America
- 5.5.2.1 Brazil
- 5.5.2.2 Argentina
- 5.5.2.3 Rest of South America
- 5.5.3 Europe
- 5.5.3.1 Germany
- 5.5.3.2 United Kingdom
- 5.5.3.3 France
- 5.5.3.4 Italy
- 5.5.3.5 Spain
- 5.5.3.6 Russia
- 5.5.3.7 Rest of Europe
- 5.5.4 Asia-Pacific
- 5.5.4.1 China
- 5.5.4.2 Japan
- 5.5.4.3 India
- 5.5.4.4 South Korea
- 5.5.4.5 Australia and New Zealand
- 5.5.4.6 Rest of Asia-Pacific
- 5.5.5 Middle East
- 5.5.5.1 Saudi Arabia
- 5.5.5.2 United Arab Emirates
- 5.5.5.3 Turkey
- 5.5.5.4 Rest of Middle East
- 5.5.6 Africa
- 5.5.6.1 South Africa
- 5.5.6.2 Nigeria
- 5.5.6.3 Rest of Africa
- 5.5.1 North America
6 COMPETITIVE LANDSCAPE
- 6.1 Market Concentration
- 6.2 Strategic Moves
- 6.3 Market Share Analysis
- 6.4 Company Profiles (includes Global Level Overview, Market Level Overview, Core Segments, Financials as available, Strategic Information, Market Rank/Share, Products and Services, Recent Developments)
- 6.4.1 Cisco Systems, Inc.
- 6.4.2 Huawei Technologies Co., Ltd.
- 6.4.3 Arista Networks, Inc.
- 6.4.4 Hewlett Packard Enterprise Company
- 6.4.5 Dell Technologies Inc.
- 6.4.6 Extreme Networks, Inc.
- 6.4.7 NETGEAR, Inc.
- 6.4.8 Edgecore Networks Corporation
- 6.4.9 D-Link Corporation
- 6.4.10 TP-Link Corporation Limited
- 6.4.11 Fortinet, Inc.
- 6.4.12 Allied Telesis Holdings K.K.
- 6.4.13 Alcatel-Lucent Enterprise (ALE International SAS)
- 6.4.14 MikroTikls SIA
- 6.4.15 Lenovo Group Limited
- 6.4.16 NVIDIA Corporation
- 6.4.17 Microchip Technology Inc.
- 6.4.18 WAGO
- 6.4.19 Edgecore Networks
- 6.4.20 Ruijie Networks
7 MARKET OPPORTUNITIES AND FUTURE OUTLOOK
- 7.1 White-Space and Unmet-Need Assessment

 葉脊開關:市佔率分析、產業趨勢與統計、成長預測(2026-2031)DIN導軌安裝開關:市場佔有率分析、產業趨勢與統計、成長預測(2026-2031年)接取層交換:市場佔有率分析、產業趨勢與統計、成長預測(2026-2031)支援SDN的交換器:市場佔有率分析、行業趨勢和統計數據以及成長預測(2026-2031年)乙太網路供電 (PoE)++ 交換器:市場佔有率分析、行業趨勢和統計數據以及成長預測 (2026-2031)
 乙太網路切換器市場 - 全球產業規模、佔有率、趨勢、機會、預測:按類型、配置、速度、地區和競爭格局分類,2021-2031年乙太網路供電 (PoE) 交換器:市場佔有率分析、行業趨勢和統計數據以及成長預測 (2026-2031)工業乙太網網路交換器:市場佔有率分析、產業趨勢與統計、成長預測(2026-2031)管理型交換器:市場佔有率分析、產業趨勢與統計、成長預測(2026-2031 年)非網管型交換器:市場佔有率分析、產業趨勢與統計、成長預測(2026-2031 年)