


 |
市場調查報告書
商品編碼
2073075
支援SDN的交換器:市場佔有率分析、行業趨勢和統計數據以及成長預測(2026-2031年)SDN-Enabled Switch - Market Share Analysis, Industry Trends & Statistics, Growth Forecasts (2026 - 2031) |
||||||

※ 本網頁內容可能與最新版本有所差異。詳細情況請與我們聯繫。
據 Mordor Intelligence 稱,2025 年 SDN 交換機市值為 125 億美元,預計到 2031 年將達到 246.2 億美元,而 2026 年為 137.8 億美元,預測期(2026-2031 年)的複合年成長率為 12.31%。
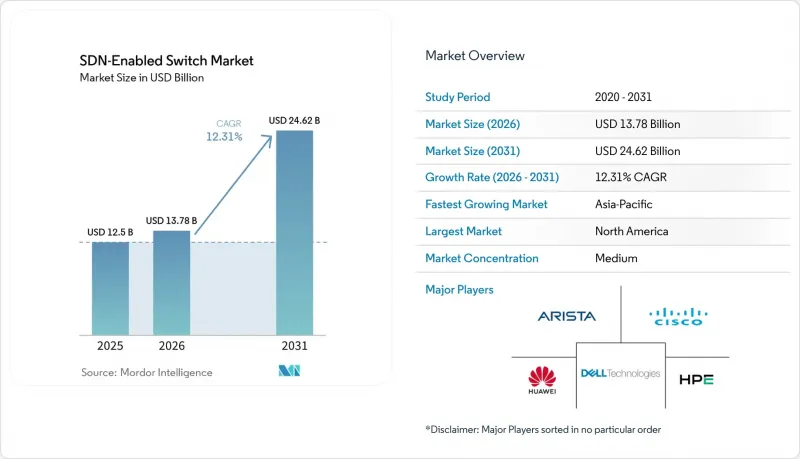
本報告依SDN部署類型(純SDN、混合SDN、Overlay SDN)、連接埠速度(低於1GbE、2.5/5GbE多千兆、10GbE、25/40GbE、100GbE及其他)、網路層(存取層、匯聚層、核心)、最終用戶(細分及資料中心供應商及其他地區進行電信服務供應商、電信服務供應商。市場預測以美元(USD)為單位。
全球SDN交換器市場趨勢及洞察
超大規模資料中心對快速擴展的需求
訓練大規模語言模式所導致的流量激增往往突如其來,毫無預兆,這使得固定功能交換器難以應付。支援軟體定義網路 (SDN) 並採用基於遙測的擁塞控制的硬體,使負責人能夠在數秒內重新分配數千條 400 GbE 鏈路,從而將 GPU 利用率維持在 90% 以上。 Meta 的分散式交換架構在叢集將尾延遲降低了 40%。同樣,谷歌和亞馬遜也決定在其位於德克薩斯州和明尼蘇達州的新園區部署下一代脊葉式網路架構。這些成果印證了軟體定義控制對於百萬兆級運算至關重要的觀點。
微服務架構導致東西向流量激增。
微服務如今已佔資料中心資料包總量的約 80%,顛覆了數十年來佔據主導地位的客戶端-伺服器模式。傳統的 Tier 3 網路已無法應付服務網格編配數百個臨時 Pod 所帶來的流量。支援 SDN 的脊葉式架構可提供無阻塞頻寬和等價多路徑路由,從而避免因過度訂閱而導致的瓶頸。到 2025 年年中,運行中的 Kubernetes叢集數量將超過 560 萬個,每個叢集都需要應用基於 Pod 標籤而非靜態 IP 位址的策略。諸如 SONiC 之類的開放原始碼網路作業系統 (NOS) 解決方案,結合向量資料包處理技術,能夠以低於 10 微秒的抖動處理每秒 1 億個資料包,無需專用 ASIC 即可實現營運商級效能。
整合傳統網路管理工具的複雜性。
諸如HP Network Node Manager和SolarWinds Network Performance Monitor之類的傳統工具依賴於SNMP輪詢和syslog分析,而這些方法無法捕捉SDN控制器即時執行策略所需的亞秒級遙測流。當營運商意識到他們現有的基於手動配置範本和核准流程的變更管理工作流程無法適應SDN平台提供的基於意圖的抽象時,遷移專案往往會停滯不前。一項針對340位網路架構師的2025年調查發現,62%的負責人認為整合複雜性是採用SDN的主要障礙,超過了預算限制和廠商鎖定問題。
細分市場分析
到2025年,混合設計將佔據SDN交換器市場48.72%的佔有率。這是因為營運商可以在保留熟悉的OSPF和BGP流程的同時,繼續使用OpenFlow和NETCONF策略。這種共存模式降低了控制器故障所帶來的風險。純SDN交換器預計到2031年將以13.84%的複合年成長率成長,並在缺乏傳統工具的新型超大規模園區中迅速普及。 NVIDIA Spectrum-4和Arista 7060X6平台已經證明,集中式管理和控制可以媲美線速專有功能,從而推動了純SDN部署中SDN交換機市場的快速擴張。基於VXLAN和NVGRE的疊加網路方案仍被用作分店和硬體升級受限園區的過渡解決方案。
從雙堆疊混合架構到純SDN的逐步過渡,與IPv4到IPv6的過渡相當相似。早期採用者們容忍當前的複雜性,期待未來營運效率的提升。 Arista的P4可程式設計管線可讓負責人整合特定工作負載的遙測數據,這凸顯了下一代晶片的差異化優勢不在於連接埠密度,而在於軟體的靈活性。在PCI-DSS等合規框架禁止大規模硬體更換的環境中,覆蓋網路設備仍然十分重要,但一旦人們對控制器容錯能力的誤解消除,其市場佔有率將會下降。
預計到2025年,25/40 GbE 市場將佔總收入的27.91%,這主要得益於企業級機架頂部 (ToR) 設備的更新換代。然而,隨著人工智慧工廠達到每GPU 200 Gbps 的閾值,400 GbE 及以上市場預計將以18.63%的複合年成長率 (CAGR) 成長。 400 GbE 主幹網路的 SDN 交換器市場規模在北美和亞太地區成長最為迅速,其中瞻博網路 (Juniper) 的 QFX5230 和戴爾 (Dell) 的 PowerSwitch Z9864F 在新設計市場佔據主導地位。同時,1 GbE 仍應用於工業閘道邊緣環境,而 100 GbE 則在資料庫複製叢集集中兼顧了成本和密度。
供應商已開始提供符合 IEEE 802.3ck 標準的 800 GbE 和 1.6 TbE 線卡樣品,為 2027 年後光學模組價格預計下降時擴大量產做準備。 NVIDIA 的 Spectrum-SN5600 整合了 64 埠 400 GbE 模組和 GPU 感知擁塞控制功能,顯示市場競爭正從通用連接埠數量競賽轉向工作負載最佳化晶片的浪潮。此外,建構涵蓋光學模組、線纜和 ASIC 供應鏈的生態系統對於加速商業化進程至關重要。
區域分析
到2025年,北美將佔全球營收的36.84%,這主要得益於維吉尼亞、奧勒岡州、德克薩斯州和愛荷華州超過4,000億美元的超大規模資料中心投資。隨著容量的持續擴張和400GbE網路架構的早期應用,該地區在面向人工智慧和雲端工作負載的軟體定義交換部署方面處於領先地位。諸如美國空軍的「企業IT連接」(Enterprise IT Connect)等積極的聯邦項目,進一步推動了園區網路和廣域網路領域對可程式基礎設施的需求。
預計到2031年,亞太地區的複合年成長率將達到15.94%。這主要得益於印度計劃將其IT負載能力從2026年的略高於2GW提升至2030年代初的8GW。以Google、微軟和亞馬遜為首的超大規模資料超大規模資料中心業者已在印度投資超過400億美元,導致交換器訂單集中度上升,無論是白盒ODM(目的地設計製造商)還是知名品牌製造商都受益於此。中國仍然是該地區最大的單一市場,政府強制要求使用國產網路協議棧的法規使華為、H3C和銳捷等公司佔據了主導地位。
在歐洲,資料主權法規因成員國而異,要求在每個成員國本地化基礎設施,這導致成本增加和更新週期延長,但進展穩步推進。儘管如此,將於2024年10月生效的NIS2指令強制要求通訊業者集中管理網路可見度和策略,這與SDN的「單一管理平台」編配模式相符。在南美洲,巴西對AWS和微軟開放新的雲端區域表示歡迎,展現出初步動能。
其他好處:
- Excel格式的市場預測(ME)表
- 3個月的分析師支持
目錄
第1章:引言
- 研究假設和市場定義
- 調查範圍
第2章:調查方法
第3章執行摘要
第4章 市場狀況
- 市場概覽
- 市場促進因素
- 超大規模資料中心對快速擴充性的需求
- 微服務架構導致東西向流量激增。
- 強制推行網路自動化以降低營運成本
- 一級雲端服務供應商部署白盒交換機
- 開放運算專案帶來的分解趨勢
- 政府為5G交通網路提供資金的努力
- 市場限制因素
- 整合傳統網路管理工具的複雜性
- SDN程式語言熟練人員短缺
- 圍繞集中式控制器的安全風險認知
- 南向API中供應商之間的互通性差距
- 產業價值鏈分析
- 監理情勢
- 技術展望
- 宏觀經濟因素對市場的影響
- 波特五力分析
第5章 市場規模與成長預測
- SDN部署類型
- 純SDN交換機
- 混合SDN交換機
- 疊加式SDN交換機
- 連接埠速度
- 1 GbE 或更低
- 2.5/5 GbE 多千兆以太網
- 10 GbE
- 25/40 GbE
- 100 GbE
- 400 GbE 或更高
- 網路層
- 使用權
- 分配
- 核
- 最終用戶
- 雲端和資料中心供應商
- 企業(商業辦公大樓和園區)
- 電信服務供應商
- 政府/國防
- 其他最終用戶
- 按地區
- 北美洲
- 美國
- 加拿大
- 墨西哥
- 南美洲
- 巴西
- 阿根廷
- 其他南美國家
- 歐洲
- 德國
- 英國
- 法國
- 義大利
- 西班牙
- 俄羅斯
- 其他歐洲國家
- 亞太地區
- 中國
- 日本
- 印度
- 韓國
- 澳洲和紐西蘭
- 其他亞太國家
- 中東
- 沙烏地阿拉伯
- 阿拉伯聯合大公國
- 土耳其
- 其他中東國家
- 非洲
- 南非
- 奈及利亞
- 其他非洲國家
- 北美洲
第6章 競爭情勢
- 市場集中度
- 策略趨勢
- 市佔率分析
- 公司簡介
- Arista Networks Inc.
- Cisco Systems Inc.
- Hewlett Packard Enterprise Company
- Dell Technologies Inc.
- Huawei Technologies Co. Ltd.
- NEC Corporation
- Extreme Networks Inc.
- NVIDIA Corporation(Mellanox Technologies)
- Edgecore Networks Corporation
- Cumulus Networks LLC
- Pica8 Inc.
- NoviFlow Inc.
- Centec Networks Co. Ltd.
- Quanta Cloud Technology LLC
- Pluribus Networks Inc.
- Volta Networks Inc.
- Barefoot Networks Inc.
- Fortinet Inc.
- Ruijie Networks Co. Ltd.
- ZTE Corporation
- MikroTik SIA
- Radisys Corporation
第7章 市場機會與未來展望
According to Mordor Intelligence, the SDN-enabled switch market size was valued at USD 12.5 billion in 2025 and estimated to grow from USD 13.78 billion in 2026 to reach USD 24.62 billion by 2031, at a CAGR of 12.31% during the forecast period (2026-2031).
This report is Segmented by SDN Implementation Type (Pure SDN, Hybrid SDN, and Overlay-Based SDN), Port Speed (1 GbE and Below, 2. 5/5 GbE Multi-Gig, 10 GbE, 25/40 GbE, 100 GbE, and More), Network Layer (Access, Distribution, and Core), End-User (Cloud and Data Center Providers, Enterprise, Telecommunication Service Providers, and More), and Geography. The Market Forecasts are Provided in Terms of Value (USD).
Global SDN-Enabled Switch Market Trends and Insights
Rapid Scalability Needs in Hyperscale Data Centers
Traffic surges triggered by large-language-model training often spike without notice, making fixed-function switches impractical. SDN-enabled hardware with telemetry-driven congestion control lets operators reassign thousands of 400 GbE links in seconds, sustaining GPU utilization above 90%. Meta's distributed switch fabric cut tail latency by 40% in clusters with more than 100,000 servers. Similarly, Google and Amazon committed to next-generation spine-leaf fabrics in new Texas and Minnesota campuses. These outcomes reinforce the view that software-defined control is a prerequisite for operating at exascale.
Surge in East-West Traffic Owing to Microservices Architectures
Microservices now produce roughly 80% of intra-data-center packets, reversing the client-server model that dominated past decades. Legacy three-tier networks buckle under the chatter of service meshes that orchestrate hundreds of ephemeral pods. SDN-enabled spine-leaf designs offer non-blocking bandwidth and equal-cost multipath routing, preventing oversubscription bottlenecks. Kubernetes passed 5.6 million production clusters by mid-2025, each requiring policy enforcement that references pod labels, not static IP addresses. Open-source NOS options such as SONiC, integrated with Vector Packet Processing, process 100 million packets per second at sub-10 microsecond jitter, delivering carrier-grade performance without proprietary ASICs.
Complexity of Integrating Legacy Network Management Tools
Legacy tools such as HP Network Node Manager and SolarWinds Network Performance Monitor rely on SNMP polling and syslog parsing, which cannot capture the sub-second telemetry streams that SDN controllers require for real-time policy enforcement. Migration projects frequently stall when operators discover that existing change-management workflows, built around manual configuration templates and approval chains, cannot accommodate the intent-based abstractions that SDN platforms expose. A 2025 survey of 340 network architects found that 62% cited integration complexity as the primary barrier to SDN adoption, ahead of budget constraints or vendor lock-in concerns.
Other drivers and restraints analyzed in the detailed report include:
- Network Automation Mandates to Lower OPEX
- Adoption of White-Box Switches by Tier-1 Cloud Providers
- Limited Skilled Workforce for SDN Programming Languages
For complete list of drivers and restraints, kindly check the Table Of Contents.
Segment Analysis
Hybrid designs accounted for 48.72% of the SDN-enabled switch market share in 2025, as they allow operators to keep familiar OSPF and BGP processes alongside OpenFlow or NETCONF policies. This coexistence lowers the perceived risk of controller outages. Pure SDN switches, projected to grow at a 13.84% CAGR through 2031, gain traction in greenfield hyperscale campuses where no legacy tooling exists. The SDN-enabled switch market size for pure deployments is set to expand rapidly as NVIDIA Spectrum-4 and Arista 7060X6 platforms prove that centralized control can match proprietary features at line rate. Overlay-based variants, reliant on VXLAN or NVGRE, remain a bridge solution for branches and campuses constrained by hardware refreshes.
The gradual shift from dual-stack hybrids to pure SDN echoes the IPv4-to-IPv6 migration: early adopters absorb added complexity for a future of leaner operations. Arista's P4-programmable pipelines enable operators to embed workload-specific telemetry, underscoring how software freedom, not port density, will differentiate next-generation silicons. Overlay appliances still retain importance where compliance frameworks such as PCI-DSS forbid large-scale hardware swaps, yet their share will decline once controller resilience myths fade.
The 25/40 GbE tier delivered 27.91% revenue in 2025, underpinned by enterprise top-of-rack refreshes. However, 400 GbE and above will accelerate at an 18.63% CAGR as AI factories saturate 200 Gbps-per-GPU thresholds. The SDN-enabled switch market size for 400 GbE spines is climbing fastest in North America and Asia-Pacific, where Juniper QFX5230 and Dell PowerSwitch Z9864F dominate new designs. Meanwhile, 1 GbE persists at the edge in industrial gateways, and 100 GbE balances cost versus density for database replication clusters.
Vendors already sample 800 GbE and 1.6 TbE line cards standardized under IEEE 802.3ck, preparing for post-2027 ramps once optics prices fall. NVIDIA's Spectrum-SN5600 couples 64-port 400 GbE blocks with GPU-aware congestion control, hinting at a wave of workload-optimized silicon in place of generic port-count races. Additionally, ecosystem readiness across optics, cabling, and ASIC supply chains will be critical to accelerate commercialization timelines.
Complete Report Scope:
- By SDN Implementation Type
- Pure SDN Switches
- Hybrid SDN Switches
- Overlay-based SDN Switches
- By Port Speed
- 1 GbE and Below
- 2.5/5 GbE Multi-Gig
- 10 GbE
- 25/40 GbE
- 100 GbE
- 400 GbE and Above
- By Network Layer
- Access
- Distribution
- Core
- By End User
- Cloud and Data Center Providers
- Enterprise (Commercial Offices and Campuses)
- Telecommunication Service Providers
- Government and Defense
- Other End Users
- By Geography
- North America
- United States
- Canada
- Mexico
- South America
- Brazil
- Argentina
- Rest of South America
- Europe
- Germany
- United Kingdom
- France
- Italy
- Spain
- Russia
- Rest of Europe
- Asia-Pacific
- China
- Japan
- India
- South Korea
- Australia and New Zealand
- Rest of Asia-Pacific
- Middle East
- Saudi Arabia
- United Arab Emirates
- Turkey
- Rest of Middle East
- Africa
- South Africa
- Nigeria
- Rest of Africa
- North America
Geography Analysis
North America contributed 36.84% of 2025 revenue, anchored by more than USD 400 billion in hyperscale data-center spending across Virginia, Oregon, Texas, and Iowa. Continuous capacity additions and early adoption of 400 GbE fabrics place the region at the forefront of software-defined switching deployments for AI and cloud workloads. Stringent federal programs such as the United States Air Force's Enterprise IT CONNECT further expand demand for programmable infrastructure in campus and wide-area domains.
Asia-Pacific is forecast to post a 15.94% CAGR through 2031, propelled by India's plan to lift installed IT load from just above 2 GW in 2026 toward 8 GW by the early 2030s. Hyperscalers led by Google, Microsoft, and Amazon have committed more than USD 40 billion to the country, funneling switch orders to white-box original design manufacturers and branded incumbents alike. China remains the single-largest national market inside the region, where government mandates for domestically designed networking stacks favor Huawei, H3C, and Ruijie.
Europe advances at a steadier clip as fragmented data-sovereignty rules require localized infrastructure in each member state, adding cost and elongating refresh cycles. Even so, the NIS2 Directive, effective October 2024, obliges operators to centralize network visibility and policy, which aligns with SDN's single-pane orchestration model. The Middle East and Africa, though smaller in revenue, are seeing first-wave commercial 5G-Advanced slicing projects that rely on SDN controllers to assure end-to-end quality of service, while South America shows early momentum as Brazil welcomes new cloud regions from AWS and Microsoft.
- Arista Networks Inc.
- Cisco Systems Inc.
- Hewlett Packard Enterprise Company
- Dell Technologies Inc.
- Huawei Technologies Co. Ltd.
- NEC Corporation
- Extreme Networks Inc.
- NVIDIA Corporation (Mellanox Technologies)
- Edgecore Networks Corporation
- Cumulus Networks LLC
- Pica8 Inc.
- NoviFlow Inc.
- Centec Networks Co. Ltd.
- Quanta Cloud Technology LLC
- Pluribus Networks Inc.
- Volta Networks Inc.
- Barefoot Networks Inc.
- Fortinet Inc.
- Ruijie Networks Co. Ltd.
- ZTE Corporation
- MikroTik SIA
- Radisys Corporation
Additional Benefits:
- The market estimate (ME) sheet in Excel format
- 3 months of analyst support
TABLE OF CONTENTS
1 INTRODUCTION
- 1.1 Study Assumptions and Market Definition
- 1.2 Scope of the Study
2 RESEARCH METHODOLOGY
3 EXECUTIVE SUMMARY
4 MARKET LANDSCAPE
- 4.1 Market Overview
- 4.2 Market Drivers
- 4.2.1 Rapid Scalability Needs in Hyperscale Data Centers
- 4.2.2 Surge in East-West Traffic Owing to Micro-services Architectures
- 4.2.3 Network Automation Mandates to Lower OPEX
- 4.2.4 Adoption of White-Box Switches by Tier-1 Cloud Providers
- 4.2.5 Disaggregation Trend Enabled by Open Compute Project
- 4.2.6 Government Initiatives Funding 5G Transport Networks
- 4.3 Market Restraints
- 4.3.1 Complexity of Integrating Legacy Network Management Tools
- 4.3.2 Limited Skilled Workforce for SDN Programming Languages
- 4.3.3 Perceived Security Risks around Centralised Controllers
- 4.3.4 Vendor Interoperability Gaps in Southbound APIs
- 4.4 Industry Value Chain Analysis
- 4.5 Regulatory Landscape
- 4.6 Technological Outlook
- 4.7 Impact of Macroeconomic Factors on the Market
- 4.8 Porter's Five Forces Analysis
- 4.8.1 Threat of New Entrants
- 4.8.2 Bargaining Power of Suppliers
- 4.8.3 Bargaining Power of Buyers
- 4.8.4 Threat of Substitutes
- 4.8.5 Intensity of Competitive Rivalry
5 MARKET SIZE AND GROWTH FORECASTS (VALUE)
- 5.1 By SDN Implementation Type
- 5.1.1 Pure SDN Switches
- 5.1.2 Hybrid SDN Switches
- 5.1.3 Overlay-based SDN Switches
- 5.2 By Port Speed
- 5.2.1 1 GbE and Below
- 5.2.2 2.5/5 GbE Multi-Gig
- 5.2.3 10 GbE
- 5.2.4 25/40 GbE
- 5.2.5 100 GbE
- 5.2.6 400 GbE and Above
- 5.3 By Network Layer
- 5.3.1 Access
- 5.3.2 Distribution
- 5.3.3 Core
- 5.4 By End User
- 5.4.1 Cloud and Data Center Providers
- 5.4.2 Enterprise (Commercial Offices and Campuses)
- 5.4.3 Telecommunication Service Providers
- 5.4.4 Government and Defense
- 5.4.5 Other End Users
- 5.5 By Geography
- 5.5.1 North America
- 5.5.1.1 United States
- 5.5.1.2 Canada
- 5.5.1.3 Mexico
- 5.5.2 South America
- 5.5.2.1 Brazil
- 5.5.2.2 Argentina
- 5.5.2.3 Rest of South America
- 5.5.3 Europe
- 5.5.3.1 Germany
- 5.5.3.2 United Kingdom
- 5.5.3.3 France
- 5.5.3.4 Italy
- 5.5.3.5 Spain
- 5.5.3.6 Russia
- 5.5.3.7 Rest of Europe
- 5.5.4 Asia-Pacific
- 5.5.4.1 China
- 5.5.4.2 Japan
- 5.5.4.3 India
- 5.5.4.4 South Korea
- 5.5.4.5 Australia and New Zealand
- 5.5.4.6 Rest of Asia-Pacific
- 5.5.5 Middle East
- 5.5.5.1 Saudi Arabia
- 5.5.5.2 United Arab Emirates
- 5.5.5.3 Turkey
- 5.5.5.4 Rest of Middle East
- 5.5.6 Africa
- 5.5.6.1 South Africa
- 5.5.6.2 Nigeria
- 5.5.6.3 Rest of Africa
- 5.5.1 North America
6 COMPETITIVE LANDSCAPE
- 6.1 Market Concentration
- 6.2 Strategic Moves
- 6.3 Market Share Analysis
- 6.4 Company Profiles (includes Global Level Overview, Market Level Overview, Core Segments, Financials as available, Strategic Information, Market Rank/Share, Products and Services, Recent Developments)
- 6.4.1 Arista Networks Inc.
- 6.4.2 Cisco Systems Inc.
- 6.4.3 Hewlett Packard Enterprise Company
- 6.4.4 Dell Technologies Inc.
- 6.4.5 Huawei Technologies Co. Ltd.
- 6.4.6 NEC Corporation
- 6.4.7 Extreme Networks Inc.
- 6.4.8 NVIDIA Corporation (Mellanox Technologies)
- 6.4.9 Edgecore Networks Corporation
- 6.4.10 Cumulus Networks LLC
- 6.4.11 Pica8 Inc.
- 6.4.12 NoviFlow Inc.
- 6.4.13 Centec Networks Co. Ltd.
- 6.4.14 Quanta Cloud Technology LLC
- 6.4.15 Pluribus Networks Inc.
- 6.4.16 Volta Networks Inc.
- 6.4.17 Barefoot Networks Inc.
- 6.4.18 Fortinet Inc.
- 6.4.19 Ruijie Networks Co. Ltd.
- 6.4.20 ZTE Corporation
- 6.4.21 MikroTik SIA
- 6.4.22 Radisys Corporation
7 MARKET OPPORTUNITIES AND FUTURE OUTLOOK
- 7.1 White-Space and Unmet-Need Assessment

 葉脊開關:市佔率分析、產業趨勢與統計、成長預測(2026-2031)DIN導軌安裝開關:市場佔有率分析、產業趨勢與統計、成長預測(2026-2031年)乙太網路切換器:市場佔有率分析、產業趨勢與統計、成長預測(2026-2031)接取層交換:市場佔有率分析、產業趨勢與統計、成長預測(2026-2031)乙太網路供電 (PoE)++ 交換器:市場佔有率分析、行業趨勢和統計數據以及成長預測 (2026-2031)
 乙太網路切換器市場 - 全球產業規模、佔有率、趨勢、機會、預測:按類型、配置、速度、地區和競爭格局分類,2021-2031年乙太網路供電 (PoE) 交換器:市場佔有率分析、行業趨勢和統計數據以及成長預測 (2026-2031)工業乙太網網路交換器:市場佔有率分析、產業趨勢與統計、成長預測(2026-2031)管理型交換器:市場佔有率分析、產業趨勢與統計、成長預測(2026-2031 年)非網管型交換器:市場佔有率分析、產業趨勢與統計、成長預測(2026-2031 年)