

 |
市場調查報告書
商品編碼
2065491
美國資料中心GPU:市場佔有率分析、產業趨勢與統計及成長預測(2026-2031年)United States Data Center GPU - Market Share Analysis, Industry Trends & Statistics, Growth Forecasts (2026 - 2031) |
||||||
※ 本網頁內容可能與最新版本有所差異。詳細情況請與我們聯繫。
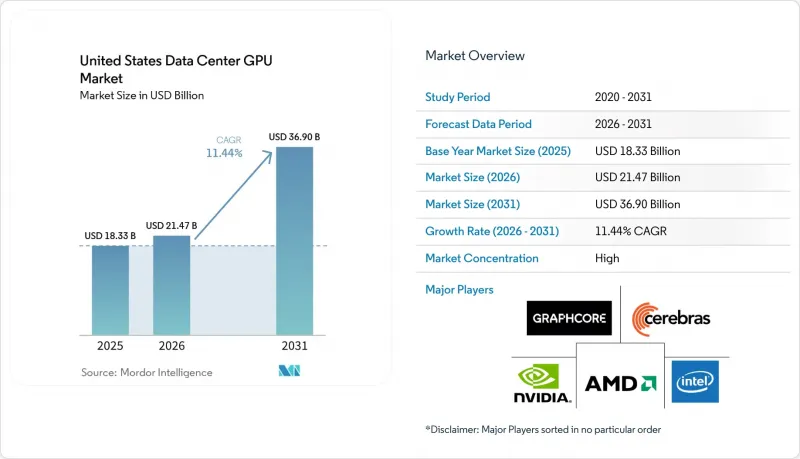
2025 年美國資料中心 GPU 市值為 183.3 億美元,預計到 2031 年將達到 369 億美元,而 2026 年為 214.7 億美元,在預測期(2026-2031 年)內複合年成長率為 11.44%。
本報告按部署類型(雲端資料中心、企業/私人資料中心等)、GPU 類型(訓練 GPU 和推理 GPU)、互連方式(基於 PCIe 的 GPU 和高頻寬互連 GPU)、工作負載類型(人工智慧和機器學習、高效能運算、資料分析等)以及最終用戶(超大規模資料中心業者/雲端服務供應商、企業等)進行細分。市場預測以美元計價。
美國資料中心GPU市場趨勢與洞察。
人工智慧模型日益複雜,加速了GPU的升級週期。
目前,參數規模達 1 兆的變壓器需要機架級叢集,總合記憶體容量超過 10 TB,這迫使超大規模資料中心業者在大約 18 個月內淘汰 Hopper 系統,並加快 Blackwell 和 Rubin 的採購週期。 NVIDIA 的 Vera Rubin NVL72 整合了 72 個 Rubin GPU 和 36 個 Vera CPU,實現了 3.6 TB/s 的互連速度,使每千兆次浮點運算所需的 GPU 數量減少了四分之一。持續的基於代理的工作負載正將投資重點從“密集型臨時訓練”轉向“始終運作集群”,使得預留實例合約比現貨價格更具吸引力。 OpenAI 的多年晶圓級合約表明,模型提供者可以確保未來數年的容量。因此,更新周期正在縮短,不常用 GPU 的次市場蓬勃發展。
更嚴格的能源效率法規正在推動先進GPU的發展。
美國環保署 (EPA) 的「能源之星 v4.0」標準對空閒功耗設定了限制,並力求將 PUE 值控制在 1.3 以下,這使得舊款 Pascal 和 Volta 架構的顯示卡處於劣勢。此外,美國能源局指南要求按季度報告 GPU 利用率,鼓勵各機構遷移到 Blackwell 和 Rubin 架構的顯示卡,這些顯示卡每瓦的 FP8 效能是前者的四倍。加州「第 24 號法規」(將於 2026 年 1 月生效)規定,GPU 集群的平均性能必須達到每千瓦 50 TFLOPS,而只有液冷 Blackwell 和 AMD MI400 系統才能達到這一水平。託管服務提供者正在維修到晶片間液冷系統,這推高了維吉尼亞北部和鳳凰城等地區的租金。聯邦和州政府的聯合法規正在將市場分類為傳統的風冷資料中心和下一代液冷資料中心兩大陣營。
先進封裝基板的供應鏈限制
台積電的CoWoS產能至少在2027年之前仍將限制在每月約3萬片晶圓,這將減緩Blackwell和Rubin的生產進度。 SK海力士在2025年面臨HBM3e良率問題,導致出貨延遲長達12週。儘管數十億美元的晶圓廠項目正在進行中,但ASML的交付延遲限制了其向先進節點的擴張。美光計畫於2025年下半年開始生產HBM,但初期產量主要針對行動應用,而非資料中心需求。因此,供應商優先考慮利潤較高的機架式系統,導致中型企業的前置作業時間延長。
細分市場分析
2025年,雲端資料中心占美國資料中心GPU銷售額的64.76%,而邊緣資料中心預計到2031年將以12.89%的年均成長率成長。這反映了對延遲敏感的推理工作負載正從集中式超大規模資料中心業者資料中心轉移到分散式邊緣站點。 AWS、微軟Azure和Google雲端等超大規模資料中心業者仍主導資本支出。
NVIDIA 的「Omniverse on DGX Cloud」將於 2026 年 2 月發布,其搭載的 L40 GPU 針對 RTX 渲染和低延遲串流媒體進行了最佳化,旨在滿足工業數位化數位雙胞胎工作流程對可擴展 GPU 資源的需求,同時無需客戶自行管理基礎設施。這使得雲端管理的 GPU 服務成為那些不願投資本地叢集的企業的理想選擇。邊緣資料中心,尤其是那些支援自動駕駛車隊和智慧製造的資料中心,正在部署熱設計功耗 (TDP) 為 50-150 瓦、採用被動散熱的強大 GPU 伺服器,以在非受控環境中運作。在這一領域,NVIDIA Jetson 和 AMD Radeon PRO 平台在軟體生態系統成熟度和長期供貨保障方面展開競爭。
2025年,訓練GPU的市佔率為59.88%,而推理GPU預計將以每年12.77%的速度成長至2031年,因為模型提供者將資金從一次性預訓練轉向支援持續性基於代理工作負載的多年推理叢集。其經濟邏輯很簡單:初始訓練一個擁有兆個參數的模型需要5000萬至1億美元以及1萬至2萬個GPU,但大規模運行該模型在其整個生命週期內所需的推理能力是初始訓練的5到10倍,這從根本上改變了超大規模資料中心業者和模型開發人員的資本配置方式。 NVIDIA 的 Groq 3 LPX 推理機架整合了 256 個語言處理單元、128 GB 的片上 SRAM 和每秒 40 Petabyte的總頻寬,旨在為基於代理的推理工作負載產生低延遲令牌,其中亞毫秒級的回應時間意味著更高的價格。
儘管訓練GPU對於開發基礎模型和進行訓練後微調仍然至關重要,但新模型的發布速度已經放緩,GPT-5和Llama 4的訓練週期現在從6-9個月延長至12-18個月。這降低了持續擴展訓練叢集的迫切性,使超大規模資料中心業者能夠更長時間地分攤其訓練基礎設施的成本。 「推理時計算擴展」的出現——模型在推理過程中迭代地微調其輸出,而不是僅僅依賴預訓練的規模——模糊了訓練和推理工作負載之間的界限,增加了對既支持高吞吐量批量訓練又支持低延遲互動式的混合GPU架構的需求。
其他好處:
- Excel格式的市場預測(ME)表
- 3個月的分析師支持
目錄
第1章:引言
- 研究假設和市場定義
- 調查範圍
第2章:調查方法
第3章執行摘要
第4章 市場狀況
- 市場概覽
- 市場促進因素
- 人工智慧模型日益複雜,加速了GPU的更換週期。
- 更嚴格的能源效率法規正在推動先進GPU的發展。
- 邊緣推理技術的普及加速了低延遲GPU的需求。
- 在企業研發中引進雲端原生高效能運算工作流程;
- 多租戶GPU虛擬化平台的出現
- 美國政府對國內半導體生產能力的誘因
- 市場限制因素
- 先進封裝基板的供應鏈限制
- 與用於推理應用的 ASIC 替代方案相比,總擁有成本 (TCO) 增加。
- 傳統資料中心電力與冷卻瓶頸
- 地緣政治出口限制導致GPU供應僅限於特定使用者。
- 產業價值鏈分析
- 監理情勢
- 技術展望
- 宏觀經濟因素對市場的影響
- 波特五力分析
第5章 市場規模與成長預測
- 依部署類型
- 雲端資料中心
- 企業/私人資料中心
- 邊緣資料中心
- 按GPU類型
- 訓練 GPU
- 用於推理的GPU
- 透過連接方式
- 基於 PCIe 的 GPU
- 高頻寬互連GPU
- 依工作負載類型
- 人工智慧(AI)和機器學習(ML)
- 高效能運算(HPC)(科學運算,不包括人工智慧)
- 資料分析(資料庫加速、查詢處理)
- 圖形和視覺化(VDI、渲染、數位雙胞胎)
- 最終用戶
- 超大規模資料中心業者雲端服務供應商/雲端服務供應商
- 公司
- 政府和研究機構
第6章 競爭情勢
- 市場集中度
- 策略趨勢
- 市佔率分析
- 公司簡介
- NVIDIA Corporation
- Advanced Micro Devices, Inc.
- Intel Corporation
- Qualcomm Technologies, Inc.
- Alphabet Inc.(Google Cloud TPU ecosystem)
- Amazon Web Services, Inc.
- Microsoft Corporation
- Meta Platforms, Inc.
- IBM Corporation
- Graphcore Ltd.
- Cerebras Systems Inc.
- Marvell Technology, Inc.
- Samsung Electronics Co., Ltd.
第7章 市場機會與未來展望
According to Mordor Intelligence, the united states data center GPU market size was valued at USD 18.33 billion in 2025 and estimated to grow from USD 21.47 billion in 2026 to reach USD 36.90 billion by 2031, at a CAGR of 11.44% during the forecast period (2026-2031).
This report is Segmented by Deployment Type (Cloud Data Centers, Enterprise / Private Data Centers, and More), GPU Type (Training GPUs and Inference GPUs), Interconnect (PCIe-Based GPUs and High-Bandwidth Interconnect GPUs), Workload Type (AI and ML, HPC, Data Analytics, and More), and End-User (Hyperscalers/CSPs, Enterprises, and More). The Market Forecasts are Provided in Value (USD).
United States Data Center GPU Market Trends and Insights
Growing AI Model Complexity Driving GPU Refresh Cycles
Trillion-parameter transformers now demand rack-scale clusters with aggregate memory exceeding 10 TB, pushing hyperscalers to retire Hopper systems after roughly 18 months and to accelerate Blackwell and Rubin procurement cycles. NVIDIA's Vera Rubin NVL72 couples 72 Rubin GPUs with 36 Vera CPUs, delivering a 3.6 TB/s interconnect that cuts GPU counts by one-quarter per petaflop. Continuous agentic workloads have shifted spending from one-time training bursts to always-on inference fleets, favoring reserved-instance contracts over spot pricing. OpenAI's multi-year wafer-scale deal demonstrates how model providers can lock in capacity years in advance. The result is a shortened refresh cadence that strengthens secondary markets for lightly used GPUs.
Escalating Energy Efficiency Mandates Favoring Advanced GPUs
The Environmental Protection Agency's ENERGY STAR v4.0 caps idle power and targets PUE below 1.3, disadvantaging legacy Pascal and Volta cards. Department of Energy guidelines now require quarterly reporting of GPU utilization, nudging agencies toward Blackwell and Rubin devices that quadruple FP8 performance per watt. California Title 24, effective January 2026, mandates GPU fleet averages of 50 TFLOPS per kilowatt, a level only liquid-cooled Blackwell and AMD MI400 systems meet. Colocation providers are retrofitting with direct-to-chip liquid cooling, raising rent premiums in Northern Virginia and Phoenix. Together, federal and state rules are splitting the market into legacy air-cooled sites and next-generation liquid-cooled campuses.
Supply Chain Constraints for Advanced Packaging Substrates
TSMC's CoWoS capacity remains capped at around 30,000 wafers per month until at least 2027, slowing Blackwell and Rubin's output. SK hynix experienced HBM3e yield issues in 2025, delaying shipments by up to 12 weeks. ASML delivery backlogs limit advanced-node expansion despite multibillion-dollar fab projects. Micron entered HBM production in late 2025, yet early volumes are targeted at mobile rather than data center demand. Vendors therefore prioritize the highest-margin rack-scale systems, leaving mid-market enterprises with prolonged lead times.
Other drivers and restraints analyzed in the detailed report include:
- Proliferation of Edge Inference Accelerating Low-Latency GPU Demand
- Adoption of Cloud-Native HPC Workflows in Enterprise Research and Development
- Rising Total Cost of Ownership Versus ASIC Alternatives for Inference
For complete list of drivers and restraints, kindly check the Table Of Contents.
Segment Analysis
Cloud data centers accounted for 64.76% of United States data center GPU revenue in 2025, yet edge data centers are forecast to grow at 12.89% annually through 2031, reflecting the migration of latency-sensitive inference workloads from centralized hyperscaler facilities to distributed edge sites. Hyperscalers such as AWS, Microsoft Azure, and Google Cloud continue to dominate capital expenditure.
NVIDIA's Omniverse on DGX Cloud, launched in February 2026 with optimized L40 GPUs for RTX rendering and low-latency streaming, targets industrial digitalization and digital twin workflows that require scalable GPU resources without customer infrastructure management, positioning cloud-managed GPU services as an on-ramp for enterprises hesitant to commit capital to on-premise clusters. Edge data centers, particularly those supporting autonomous vehicle fleets and smart manufacturing, are deploying ruggedized GPU servers with 50-150 watt thermal envelopes and passive cooling to operate in non-climate-controlled environments, a segment where NVIDIA Jetson and AMD Radeon PRO platforms compete on software ecosystem maturity and long-term supply commitments.
Training GPUs commanded 59.88% of market share in 2025, yet inference GPUs are forecast to grow at 12.77% annually through 2031 as model providers shift capital from one-time pretraining toward multi-year inference fleets that serve continuous agentic workloads. The economic logic is straightforward: a trillion-parameter model requires USD 50-100 million and 10,000-20,000 GPUs for initial training, but serving that model at scale demands 5-10x more inference capacity over its operational lifetime, fundamentally altering the capital allocation calculus for hyperscalers and model builders. NVIDIA's Groq 3 LPX inference rack, integrating 256 language processing units with 128 gigabytes of on-chip SRAM and 40 petabytes per second of aggregate bandwidth, targets low-latency token generation for agentic reasoning workloads where sub-millisecond response times unlock premium pricing tiers.
Training GPUs remain essential for foundation model development and post-training fine-tuning, yet the cadence of new model releases is slowing GPT-5 and Llama 4 training runs are stretching to 12-18 months versus 6-9 months for prior generations, reducing the urgency of continuous training cluster expansion and allowing hyperscalers to amortize training infrastructure over longer periods. The emergence of test-time compute scaling, where models iteratively refine outputs during inference rather than relying solely on pretraining scale, is blurring the boundary between training and inference workloads and driving demand for hybrid GPU architectures that support both high-throughput batch training and low-latency interactive inference.
List of Companies Covered in this Report:
- NVIDIA Corporation
- Advanced Micro Devices, Inc.
- Intel Corporation
- Qualcomm Technologies, Inc.
- Alphabet Inc. (Google Cloud TPU ecosystem)
- Amazon Web Services, Inc.
- Microsoft Corporation
- Meta Platforms, Inc.
- IBM Corporation
- Graphcore Ltd.
- Cerebras Systems Inc.
- Marvell Technology, Inc.
- Samsung Electronics Co., Ltd.
Additional Benefits:
- The market estimate (ME) sheet in Excel format
- 3 months of analyst support
TABLE OF CONTENTS
1 INTRODUCTION
- 1.1 Study Assumptions and Market Definition
- 1.2 Scope of the Study
2 RESEARCH METHODOLOGY
3 EXECUTIVE SUMMARY
4 MARKET LANDSCAPE
- 4.1 Market Overview
- 4.2 Market Drivers
- 4.2.1 Growing AI Model Complexity Driving GPU Refresh Cycles
- 4.2.2 Escalating Energy Efficiency Mandates Favoring Advanced GPUs
- 4.2.3 Proliferation of Edge Inference Accelerating Low-latency GPU Demand
- 4.2.4 Adoption of Cloud-native HPC Workflows in Enterprise R&D
- 4.2.5 Emergence of Multi-tenant GPU Virtualization Platforms
- 4.2.6 U.S. Government Incentives For Domestic Semiconductor Capacity
- 4.3 Market Restraints
- 4.3.1 Supply Chain Constraints For Advanced Packaging Substrates
- 4.3.2 Rising Total Cost of Ownership Versus ASIC Alternatives For Inference
- 4.3.3 Data Center Power and Cooling Bottlenecks in Legacy Facilities
- 4.3.4 Geopolitical Export Controls Limiting GPU Availability To Certain Users
- 4.4 Industry Value Chain Analysis
- 4.5 Regulatory Landscape
- 4.6 Technological Outlook
- 4.7 Impact of Macroeconomic Factors on the Market
- 4.8 Porter's Five Forces Analysis
- 4.8.1 Threat of New Entrants
- 4.8.2 Bargaining Power of Suppliers
- 4.8.3 Bargaining Power of Buyers
- 4.8.4 Threat of Substitutes
- 4.8.5 Industry Rivalry
5 MARKET SIZE AND GROWTH FORECASTS (VALUE)
- 5.1 By Deployment Type
- 5.1.1 Cloud Data Centers
- 5.1.2 Enterprise / Private Data Centers
- 5.1.3 Edge Data Centers
- 5.2 By GPU Type
- 5.2.1 Training GPUs
- 5.2.2 Inference GPUs
- 5.3 By Interconnect
- 5.3.1 PCIe-Based GPUs
- 5.3.2 High-Bandwidth Interconnect GPUs
- 5.4 By Workload Type
- 5.4.1 Artificial Intelligence (AI) and Machine Learning (ML)
- 5.4.2 High-Performance Computing (HPC) (non-AI scientific computing)
- 5.4.3 Data Analytics (database acceleration, query processing)
- 5.4.4 Graphics and Visualization (VDI, rendering, digital twins)
- 5.5 By End-User
- 5.5.1 Hyperscalers / Cloud Service Providers
- 5.5.2 Enterprises
- 5.5.3 Government and Research Institutions
6 COMPETITIVE LANDSCAPE
- 6.1 Market Concentration
- 6.2 Strategic Moves
- 6.3 Market Share Analysis
- 6.4 Company Profiles (includes Global Level Overview, Market Level Overview, Core Segments, Financials as available, Strategic Information, Market Rank/Share, Products and Services, Recent Developments)
- 6.4.1 NVIDIA Corporation
- 6.4.2 Advanced Micro Devices, Inc.
- 6.4.3 Intel Corporation
- 6.4.4 Qualcomm Technologies, Inc.
- 6.4.5 Alphabet Inc. (Google Cloud TPU ecosystem)
- 6.4.6 Amazon Web Services, Inc.
- 6.4.7 Microsoft Corporation
- 6.4.8 Meta Platforms, Inc.
- 6.4.9 IBM Corporation
- 6.4.10 Graphcore Ltd.
- 6.4.11 Cerebras Systems Inc.
- 6.4.12 Marvell Technology, Inc.
- 6.4.13 Samsung Electronics Co., Ltd.
7 MARKET OPPORTUNITIES AND FUTURE OUTLOOK
- 7.1 White-Space and Unmet-Need Assessment
 中國資料中心GPU:市場佔有率分析、產業趨勢與統計及成長預測(2026-2031年)亞太地區資料中心GPU:市場佔有率分析、產業趨勢與統計及成長預測(2026-2031年)北美資料中心GPU:市佔率分析、產業趨勢與統計及成長預測(2026-2031年)德國資料中心GPU:市場佔有率分析、產業趨勢與統計及成長預測(2026-2031年)日本資料中心GPU市場:市佔率分析、產業趨勢與統計及成長預測(2026-2031年)歐洲資料中心GPU:市佔率分析、產業趨勢與統計及成長預測(2026-2031年)英國資料中心GPU:市佔率分析、產業趨勢與統計及成長預測(2026-2031年)
 資料中心圖形處理器 (GPU) 市場預測至 2034 年:按部署模式、功能、最終用戶和地區分類的全球分析AI資料中心GPU:市佔率分析、產業趨勢與統計及成長預測(2026-2031年)
 資料中心GPU市場:2026年至2032年全球市場預測,依產品、記憶體容量、伺服器密度、功耗範圍、應用、部署模式及最終用戶分類