

 |
市場調查報告書
商品編碼
2062024
美國食品物流:市場佔有率分析、產業趨勢與統計、成長預測(2026-2031)United States Food Logistics - Market Share Analysis, Industry Trends & Statistics, Growth Forecasts (2026 - 2031) |
||||||
※ 本網頁內容可能與最新版本有所差異。詳細情況請與我們聯繫。
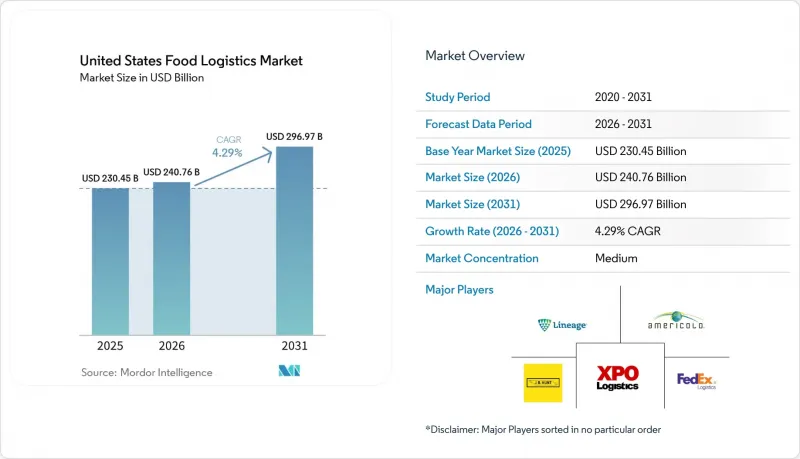
據 Mordor Intelligence 稱,2025 年美國食品物流市場價值 2304.5 億美元,預計到 2031 年將達到 2969.7 億美元,而 2026 年為 2407.6 億美元,預測期(2026-2031 年)複合年成長率為 4.29%。
本報告按服務類型(運輸、倉儲、附加價值服務及其他)、溫控類型(低溫運輸和非低溫運輸)以及最終產品類別(肉類和魚貝類、乳製品和冷凍甜點、水果和蔬菜、食品和飲料及其他)進行分類。市場預測以美元計價。
美國食品物流市場的趨勢與洞察
電子商務和線上雜貨銷售的成長
2025年第四季,美國零售電商銷售額達3,161億美元,年增5.3%。 2025年全年線上零售額將達1.23兆美元,市場滲透率達16.4%。這導致美國食品物流市場中溫控配送的需求增加,以及最後一公里配送協調的複雜性提升。 2026年1月,食品雜貨和餐飲銷售額達775億美元,年增1.9%。這表明,在需求旺盛的地區,微型倉配和暗店模式對於提供可靠的服務仍然至關重要。物流網路正從中心輻射型模式轉變為輻射型模式,強調高訂單頻率但低配送量。這使得精準的配送時段分配和即時視覺性在美國食品物流市場顯得格外重要。在生鮮食品履約,對替代品或延誤的接受度極低,因此企業正在應用溫度遠端資訊處理、動態路線規劃和預測性人員配置等技術來維持服務水準並減少浪費。預計到2026年,電子商務滲透率將進一步提高,零售商也將擴大自有車隊規模並提供線上訂購線下取貨服務,食品飲料行業預計將在美國食品物流市場保持成長勢頭。這將帶來更有效率的產品配送和利潤率的重新平衡。
低溫運輸基礎設施的擴展
美國農業部(USDA)的「韌性食品系統基礎設施」計畫旨在透過資助收集、加工和冷藏保管能力,消除美國食品物流市場中對溫度敏感的生鮮食品供應鏈中段的瓶頸。 2024年,該計劃還將向獨立的肉類和家禽加工商提供額外津貼,以幫助其實現屠宰能力多元化,並減少對高度集中的加工叢集的依賴,從而避免扭曲區域間的物流流動。美國農業部對特色作物的20億美元投資,反映了其對新鮮農產品高昂物流成本的重視,並將支持溫控運輸資產,以減少漿果、綠葉蔬菜和其他易損商品在運輸過程中的損耗。私人資本也在積極響應這項變化。 DHL供應鏈與RLCold於2026年2月簽署了一份合作備忘錄,旨在建造一座佔地超過500萬平方英尺的新一代多溫區冷庫,該冷庫將採用符合FSMA標準的控制系統和氣密設計,以取代美國食品物流市場中老舊的設施。從破土動工到全面運作,24至36個月的工期充滿挑戰,但預租協議和關鍵租戶的敲定將有助於最終確定租戶和定價。這將提高依賴低溫運輸可靠性的美國食品物流市場托運人的計畫透明度。
司機短缺和勞動力挑戰
2025年8月,運輸業的失業率達到5.9%,高於4.5%的全國平均。同時,儘管卡車運輸業的就業人數年增0.4%,但運輸能力依然緊張,暴露出美國食品物流市場司機供需失衡的問題。美國勞工統計局預測,到2034年,重型卡車和半拖車司機的年均職位空缺將達到237,600個,主要原因是退休和人員離職,這意味著儘管需求強勁,招聘壓力仍將持續。駕駛時間規定將每日駕駛時間限制在14小時內的11小時以內,並強制每週重置。這限制了車輛的運轉率導致貨物裝卸點的成本增加,尤其是在需要嚴格控制溫度的設施中,高峰時段更是如此。美國食品物流市場的行業領導企業正在投資自動化和機器人揀選,以穩定加工能力、降低每筆訂單的人事費用並保持高水準的服務。
細分市場分析
到2025年,運輸服務將占美國食品物流市場佔有率的53.78%,凸顯了公路、鐵路、水路和航空網路在國內和跨境物流中,於服務窗口期內交付生鮮食品發揮的核心作用。道路運輸支援最後一公里精準配送和門到門溫控,而鐵路多式聯運和冷藏集裝箱在時間要求可接受的領域,例如冷凍蛋白質和穀物,即使運輸需要數天時間,市場佔有率也在不斷物流。在海運進口方面,農產品和水產品經由薩凡納、長灘和紐瓦克港運輸,而空運仍是高附加價值水產品的主要運輸方式。隨著附加價值服務採用聯合包裝、套件組裝、貼標和後期加工等策略來降低成品風險並快速響應美國食品物流市場的實際需求訊號,增值服務正以每年5.8%的速度成長。這些特性正在將利潤來源從簡單的負載容量轉移到支援受監管類別和快速管道轉變的複雜性管理和可追溯性實施。
倉儲營運對於生產和運輸流程之間的越庫作業、訂單整合以及溫度穩定至關重要,其停留時間反映了目標類別內事件層級檢驗所需的額外可追溯性程序。美國食品物流市場的領先網路正在實施自動化揀貨和倉庫管理軟體,以縮短揀貨到出貨週期、保護產品完整性並降低每個托盤的能耗。雖然沒有進行自動化或節能維修的老舊設施正面臨著人事費用和公用事業成本上漲的壓力,但技術先進的設施透過提供整合包裝營運和隨時可審計的可視化功能,正在設定更高的價格。在美國食品物流市場,能夠將運輸、倉儲和增值營運整合到單一控制塔下,從而降低處理頻率和異常率的供應商備受青睞。預計從2026年到2031年,美國食品物流市場的附加價值服務市場規模將以5.8%的複合年成長率成長,這反映了市場對可追溯性、售後和合規性支援的持續需求。在美國食品物流產業,企業如果能夠在其各個分支機構中標準化地實施自動化、軟體和可再生能源,就能提高利潤率,並增強應對人事費用和能源價格波動的能力。
其他好處:
- Excel格式的市場預測(ME)表
- 3個月的分析師支持
目錄
第1章:引言
- 市場分析與定義的前提條件
- 分析範圍
第2章 分析方法
第3章執行摘要
第4章 市場狀況
- 市場概覽
- 市場促進因素
- 電子商務和線上雜貨市場的成長
- 低溫運輸基礎設施的擴展
- 食品安全法規和可追溯性
- 消費者對新鮮農產品和生鮮食品的需求
- 餐飲業復甦
- 永續發展和減少廢棄物舉措
- 市場限制因素
- 促進要素短缺和勞動力挑戰
- 高昂的低溫運輸基礎設施成本
- 食物浪費和腐敗的風險
- 基礎設施限制和堵塞
- 價值鍊和供應鏈分析
- 監理情勢
- 技術展望
- 波特五力分析
- 超本地化履約網路的興起
- 加速第三方物流專業化進程
第5章:預測市場規模與成長率
- 按服務
- 運輸
- 路
- 鐵路
- 水運
- 航空
- 倉儲
- 附加價值服務及其他
- 運輸
- 溫度控制方法
- 低溫運輸
- 室溫(15-25 度C)
- 冷藏(2-8°C)
- 冷凍(低於0度C)
- 除了低溫運輸之外
- 低溫運輸
- 按最終產品類別
- 肉類和水產品
- 乳製品和冷凍甜點
- 水果和蔬菜
- 食品/飲料
- 其他
第6章 競爭情勢
- 市場集中度
- 策略趨勢
- 市佔率分析
- 公司簡介
- Lineage Logistics
- Americold Logistics
- XPO Logistics
- JB Hunt Transport Services
- FedEx Logistics
- United Parcel Service, Inc.
- CH Robinson Worldwide
- DHL Group
- Kuehne+Nagel
- CTW Logistics
- Buske Logistics
- Kenco Logistics
- Covenant Logistics Group
- Transervice Logistics
- RLS Logistics
- Expeditors
- GEODIS
- Penske Logistics
- Matson Logistics
- Averitt Express
第7章 市場機會與未來展望
According to Mordor Intelligence, the united states food logistics market size was valued at USD 230.45 billion in 2025 and is estimated to grow from USD 240.76 billion in 2026 to reach USD 296.97 billion by 2031, at a CAGR of 4.29% during the forecast period (2026-2031).
This report is Segmented by Services (Transportation, Warehousing, Value-Added Services and Others), by Temperature-Control Type (Cold Chain and Non-Cold Chain), by End-Product Category (Meat & Seafood, Dairy & Frozen Desserts, Fruits & Vegetables, Food and Beverages, and Others). The Market Forecasts are Provided in Terms of Value USD.
United States Food Logistics Market Trends and Insights
E-commerce and Online Grocery Growth
United States retail e-commerce sales reached USD 316.1 billion in Q4 2025, up 5.3% year over year, and full-year 2025 online retail hit USD 1.23 trillion with a 16.4% penetration rate, which increases temperature-controlled deliveries and raises last-mile orchestration complexity across the United States food logistics market. Grocery and food and beverage stores report USD 77.5 billion in January 2026 sales, up 1.9% year over year, underscoring the continued importance of micro-fulfillment and dark-store models for reliable service windows near high-density demand. Networks shift from hub-spoke to spoke-spoke layouts and emphasize smaller drop sizes with higher order frequency, which puts a premium on slotting accuracy and real-time visibility in the United States food logistics market. Perishable fulfillment leaves little tolerance for substitutions or delays, so operators deploy temperature telematics, dynamic routing, and predictive labor planning to protect service levels and reduce spoilage. E-commerce penetration is expected to edge higher in 2026, with food and beverage maintaining momentum as retailers expand owned fleets and click-and-collect options that streamline handoffs and rebalance margin capture in the United States food logistics market.
Cold Chain Infrastructure Expansion
USDA's Resilient Food Systems Infrastructure program is channeling funding to aggregation, processing, and cold storage capacity to ease mid-supply chain bottlenecks in perishable categories that rely on dependable temperature control in the United States food logistics market. Additional 2024 awards to independent meat and poultry processors help diversify slaughter capacity and reduce exposure to highly concentrated processing clusters that distort regional flows. USDA's USD 2 billion for specialty crops recognizes the higher logistics costs for fresh produce and supports climate-controlled transport assets that can lower in-transit loss in berries, leafy greens, and other sensitive SKUs. Private capital aligns with this shift, as DHL Supply Chain's February 2026 MOU with RLCold targets more than five million square feet of next-generation multi-temperature capacity with FSMA-ready controls and airtight designs that replace aging stock in the United States food logistics market. Groundbreaking-to-ramp timelines of 24 to 36 months stage the relief, but pre-leasing and anchor commitments lock in tenants and pricing, which improves planning horizons for shippers that depend on cold-chain reliability in the United States food logistics market.
Driver Shortage and Labor Challenges
Transportation sector unemployment reached 5.9% in August 2025, above the national 4.5% rate, while truck transportation employment grew 0.4% year over year, which kept capacity tight and exposed mismatches in driver supply for the United States food logistics market. The Bureau of Labor Statistics projects 237,600 average annual openings for heavy and tractor-trailer drivers through 2034, driven largely by retirements and career exits, which sustains recruiting pressure despite solid demand. Hours-of-service limits cap daily driving at 11 hours within a 14-hour window and require weekly resets, which constrain asset utilization and force fleets to carry more tractors and drivers for a given route network. Wage inflation in labor-intensive functions such as loading and receiving adds cost at docks, especially in temperature-controlled facilities that must maintain strict standards during peak windows. Leaders invest in automation and robotic retrieval to stabilize throughput, reduce per-order labor, and keep service levels high in the United States food logistics market.
Other drivers and restraints analyzed in the detailed report include:
- Consumer Demand for Fresh and Perishable Foods
- Restaurant and Foodservice Industry Recovery
- Infrastructure Constraints and Congestion
For complete list of drivers and restraints, kindly check the Table Of Contents.
Segment Analysis
Transportation services captured 53.78% of the United States food logistics market share in 2025, confirming the central role of road, rail, water, and air networks to align perishables with service windows across national and cross-border flows. Road transport supports last-mile precision and door-to-door control over temperature, while rail intermodal and refrigerated containers gain share where time sensitivity allows multi-day transits for frozen proteins and grains. Waterborne imports move produce and seafood through Savannah, Long Beach, and Newark, and air remains a targeted option for high-value seafood. Value-added services expand at 5.8% annually as operators embed co-packing, kitting, labeling, and postponement tactics that reduce finished-goods risk and respond faster to real demand signals in the United States food logistics market. These capabilities move the profit pool from cubic footage toward complexity management and traceability-ready execution that supports regulated categories and rapid channel shifts.
Warehousing anchors cross-docking, order consolidation, and temperature stabilization between production and outbound flows, and dwell lengths reflect the added traceability steps required for event-level verification in covered categories. Leading networks deploy automated retrieval and warehouse execution software to compress pick-to-ship cycles, protect product integrity, and reduce energy per pallet in the United States food logistics market. Legacy facilities without automation or energy retrofits face pressure from rising labor and utility costs, while technology-forward nodes price at a premium for bundled co-packing and audit-ready visibility. The United States food logistics market rewards providers that integrate transportation, warehousing, and value-added operations under one control tower to reduce touches and exception rates. The United States food logistics market size for value-added services is projected to expand at a 5.8% CAGR between 2026 and 2031, reflecting durable demand for traceability, postponement, and compliance support. Operators in the United States food logistics industry that standardize automation, software, and renewable energy adoption across sites improve margins and resilience against labor and energy volatility.
List of Companies Covered in this Report:
- Lineage Logistics
- Americold Logistics
- XPO Logistics
- J.B. Hunt Transport Services
- FedEx Logistics
- United Parcel Service, Inc.
- C.H. Robinson Worldwide
- DHL Group
- Kuehne + Nagel
- CTW Logistics
- Buske Logistics
- Kenco Logistics
- Covenant Logistics Group
- Transervice Logistics
- RLS Logistics
- Expeditors
- GEODIS
- Penske Logistics
- Matson Logistics
- Averitt Express
Additional Benefits:
- The market estimate (ME) sheet in Excel format
- 3 months of analyst support
TABLE OF CONTENTS
1 Introduction
- 1.1 Study Assumptions & Market Definition
- 1.2 Scope of the Study
2 Research Methodology
3 Executive Summary
4 Market Landscape
- 4.1 Market Overview
- 4.2 Market Drivers
- 4.2.1 E-commerce and Online Grocery Growth
- 4.2.2 Cold Chain Infrastructure Expansion
- 4.2.3 Food Safety Regulations and Traceability
- 4.2.4 Consumer Demand for Fresh and Perishable Foods
- 4.2.5 Restaurant and Foodservice Industry Recovery
- 4.2.6 Sustainability and Waste Reduction Initiatives
- 4.3 Market Restraints
- 4.3.1 Driver Shortage and Labor Challenges
- 4.3.2 High Cold Chain Infrastructure Costs
- 4.3.3 Food Waste and Spoilage Risks
- 4.3.4 Infrastructure Constraints and Congestion
- 4.4 Value / Supply-Chain Analysis
- 4.5 Regulatory Landscape
- 4.6 Technological Outlook
- 4.7 Porter's Five Forces
- 4.7.1 Threat of New Entrants
- 4.7.2 Bargaining Power of Suppliers
- 4.7.3 Bargaining Power of Buyers
- 4.7.4 Threat of Substitutes
- 4.7.5 Competitive Rivalry
- 4.8 Hyperlocal Fulfillment Networks Emerging
- 4.9 Third-Party Logistics Specialization Accelerating
5 Market Size & Growth Forecasts (Value)
- 5.1 By Services
- 5.1.1 Transportation
- 5.1.1.1 Road
- 5.1.1.2 Rail
- 5.1.1.3 Water
- 5.1.1.4 Air
- 5.1.2 Warehousing
- 5.1.3 Value-Added Services and Others
- 5.1.1 Transportation
- 5.2 By Temperature-Control Type
- 5.2.1 Cold Chain
- 5.2.1.1 Ambient 15-25 °C
- 5.2.1.2 Chilled 2-8 °C
- 5.2.1.3 Frozen Less than 0 °C
- 5.2.2 Non-Cold Chain
- 5.2.1 Cold Chain
- 5.3 By End-Product Category
- 5.3.1 Meat & Seafood
- 5.3.2 Dairy & Frozen Desserts
- 5.3.3 Fruits & Vegetables
- 5.3.4 Food and Beverages
- 5.3.5 Others
6 Competitive Landscape
- 6.1 Market Concentration
- 6.2 Strategic Moves
- 6.3 Market Share Analysis
- 6.4 Company Profiles (includes Global level Overview, Market level overview, Core Segments, Financials as available, Strategic Information, Market Rank/Share for key companies, Products & Services, and Recent Developments)
- 6.4.1 Lineage Logistics
- 6.4.2 Americold Logistics
- 6.4.3 XPO Logistics
- 6.4.4 J.B. Hunt Transport Services
- 6.4.5 FedEx Logistics
- 6.4.6 United Parcel Service, Inc.
- 6.4.7 C.H. Robinson Worldwide
- 6.4.8 DHL Group
- 6.4.9 Kuehne + Nagel
- 6.4.10 CTW Logistics
- 6.4.11 Buske Logistics
- 6.4.12 Kenco Logistics
- 6.4.13 Covenant Logistics Group
- 6.4.14 Transervice Logistics
- 6.4.15 RLS Logistics
- 6.4.16 Expeditors
- 6.4.17 GEODIS
- 6.4.18 Penske Logistics
- 6.4.19 Matson Logistics
- 6.4.20 Averitt Express
7 Market Opportunities & Future Outlook
 德國食品物流:市場佔有率分析、產業趨勢與統計及成長預測(2026-2031)法國食品物流:市場佔有率分析、產業趨勢與統計及成長預測(2026-2031)
 食品物流市場機會、成長要素、產業趨勢分析及2026-2035年預測。中東食品物流:市場佔有率分析、產業趨勢與統計及成長預測(2026-2031)
 食品物流市場:依運輸方式、溫度控制、產品類型、服務類型及最終用戶分類-2026-2032年全球市場預測英國食品物流:市場佔有率分析、產業趨勢與統計、成長預測(2026-2031)日本食品物流:市場佔有率分析、產業趨勢與統計、成長預測(2026-2031)亞太地區食品物流:市場佔有率分析、產業趨勢與統計及成長預測(2026-2031)
 食品物流市場規模、佔有率、趨勢和預測:按運輸方式、產品類型、服務類型、細分市場和地區分類,2026-2034年食品運輸市場:依產品類型、運輸方式及地區分類(2026-2034 年)