


 |
市場調查報告書
商品編碼
1939594
越南貨運與物流:市場佔有率分析、產業趨勢與統計、成長預測(2026-2031)Vietnam Freight And Logistics - Market Share Analysis, Industry Trends & Statistics, Growth Forecasts (2026 - 2031) |
||||||
※ 本網頁內容可能與最新版本有所差異。詳細情況請與我們聯繫。
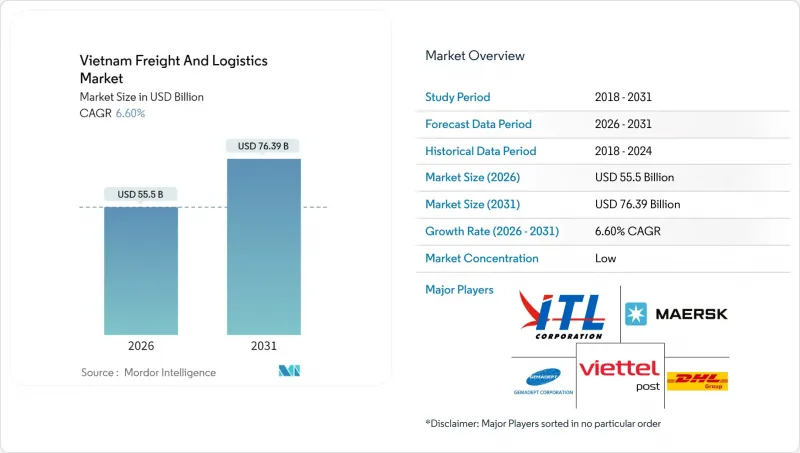
預計越南貨運和物流市場規模將從 2025 年的 520.6 億美元成長到 2026 年的 555 億美元,到 2031 年將達到 763.9 億美元,2026 年至 2031 年的複合年成長率為 6.6%。
這一成長軌跡反映了製造業的持續湧入、電子商務小包裹的成長以及150億美元的公共投資,這些投資用於道路、港口和機場建設。結構性利多因素包括來自中國的近岸外包、東協單一窗口海關清關的數位化以及對溫控運輸需求的成長,這些因素推動了陸運、海運和空運走廊貨運量的成長。隨著國際一體化企業加強在越南的業務佈局,以及國內業者透過低溫運輸和最後一公里投資擴大規模,競爭日益激烈。因此,越南的貨運和物流市場正受惠於基礎建設、貿易自由化和數位轉型帶來的良性循環,這縮短了貨物停留時間並開拓了新的服務領域。
越南貨運及物流市場趨勢及展望
電子商務小包裹熱潮推動最後一公里配送創新
預計到2024年,隨著線上市場的擴張和社交電商帶來的地理限制的放寬,越南國內小包裹量將成長45%。在越南的貨運和物流市場,宅配網路正在採用自動化分類機和人工智慧路線規劃引擎,將平均遞送時間從48小時縮短至24小時。然而,由於最後一公里網路的碎片化,越南的小包裹遞送成本比泰國高出28%,這促使營運商透過微型樞紐共用和群眾外包司機的方式將服務擴展到農村地區。監理支持也在推動經濟發展。價值低於200美元的小包裹清關程序已簡化,海關滯留時間從5天縮短至1天。資本正順應需求,ViettelPost開設了15個機器人分類中心,Giao Hang Nhanh承諾在2025年實現鄉級覆蓋。這些措施將加強數位化基礎,加速未來包裹量的成長,並鞏固CEP(宅配)作為越南貨運和物流市場成長最快細分市場的地位。
近岸外包正在改變製造業物流
隨著電子和服裝產業從中國轉移,預計到2024年,越南製造業物流需求將增加28%,全球品牌紛紛尋求對沖地緣政治和成本風險。在北部叢集,高附加價值電子產品的分銷優先依賴空運,內排機場的零件吞吐量年增35%。這導致運力增加和航班時刻重新分配。光是三星的擴張就需要每月2,400個標準箱的貨運量,富士康和立訊精密也分別運作通往出口門戶的閉合迴路通道。服裝製造商正在利用海陸聯運,將前置作業時間縮短至比傳統中國路線縮短40%。提供套件組裝、退貨處理和品管倉儲服務的營運商如今獲得了更高的利潤,這標誌著越南貨運和物流市場正從純粹的運輸模式轉向綜合合約物流模式。
貨櫃短缺造成成本壓力
由於越南的進出口比例為3:1,大量空貨櫃滯留在內陸,導致平均搬遷成本上升,20英尺貨櫃為85美元,40英尺貨櫃為170美元。 2024年,在咖啡和紡織品旺季,貨櫃運轉率降至70%以下,導致貨櫃不平衡附加費上漲25%。貨運代理商正利用物聯網追蹤標籤和共用池來提高運轉率,並將單次運輸成本降低15-20%,但結構性的貿易失衡使得短途運輸附加費短期內不太可能降低。這導致越南貨運和物流市場波動,擠壓了中小托運人的利潤空間。
細分市場分析
到2025年,製造業將佔越南貨運和物流市場佔有率的35.12%,這主要得益於電子產品和服飾中心對與海外買家精準庫存同步的需求。嚴格的週期要求推動了RFID技術在零件配套和延遲倉儲方面的應用,從而提高了第三方物流(3PL)的滲透率。批發和零售業正在迎頭趕上,預計2026年至2031年將以6.98%的複合年成長率成長,這主要得益於現代超市、D2C品牌和跨境電商平台不斷擴大SKU和分銷點。在海鮮、水果和疫苗產業,運輸失敗造成的損失遠超過物流溢價,因此需要採用GDP認證的合作夥伴並完善低溫運輸通訊協定。日益嚴格的藥品可追溯性監管提高了進入門檻,促使市場更加關注擁有檢驗流程的營運商,並加劇了越南貨運和物流市場的整合。
農業和建築等傳統行業的核心運輸量保持不變,但運輸方式正在轉變。湄公河三角洲的駁船和鐵路試驗正在將米和沙子等大宗貨物從擁擠的公路運輸中轉移出去。石油、天然氣和礦業物流仍然高度專業化,高安全標準和複雜的包機安排更有利於那些專注於特定領域的貨運代理。
截至2025年,出口製造業在大宗貨物運輸中主導,佔越南貨運和物流市場的64.12%。然而,隨著社群電商和跨境購物的蓬勃發展,宅配、速遞和小包裹業務的收入持續成長,預計2026年至2031年的複合年成長率將達到7.52%。集中式出口包裹遞送(宅配)的快速成長正推動營運商實現樞紐自動化並整合海關API,將交貨週期縮短一半。倉儲業也順應數位化趨勢,預計在水產養殖和疫苗供應鏈的推動下,溫控倉儲資產在2026年至2031年間的複合年成長率將達到7.89%。隨著區塊鏈載貨證券和物聯網感測器網路的普及,服務邊界正在變得模糊。在越南貨運和物流市場,貨運代理商正將即時視覺性與增值包裝相結合,以確保在商品同質化趨勢下獲得利潤。
儘管貨運仍佔據主導地位,但運輸方式正在轉變。道路運輸的規模將在2031年之前保持穩定,但空運和快遞將在速度比成本更重要的特定運輸領域佔據更大佔有率。數位化貨運平台將整合現貨貨運,使卡車運轉率提高12%,並解決空駛返程和人工文書工作等挑戰。綜合規劃將實現公路、海運和鐵路相結合的多模態路線,從而減少二氧化碳排放,並吸引具有環境、社會和治理(ESG)意識的出口商。
其他福利:
- Excel格式的市場預測(ME)表
- 3個月的分析師支持
目錄
第1章 引言
- 研究假設和市場定義
- 調查範圍
第2章調查方法
第3章執行摘要
第4章 市場情勢
- 市場概覽
- 人口統計數據
- 按經濟活動分類的GDP分配
- 按經濟活動分類的GDP成長
- 通貨膨脹
- 經濟表現和公司概況
- 電子商務產業的趨勢
- 製造業趨勢
- 運輸和倉儲業的GDP
- 出口趨勢
- 進口趨勢
- 燃油價格
- 卡車運輸營運成本
- 卡車運輸車隊規模(按類型)
- 主要卡車供應商
- 物流績效
- 按交通方式分享
- 海運船隊運力
- 班輪運輸連接
- 停靠港口和演出
- 貨運費率趨勢
- 貨物噸位趨勢
- 基礎設施
- 法規結構(公路和鐵路)
- 法規結構(海事和航空)
- 價值鍊和通路分析
- 市場促進因素
- 電子商務小包(B2C 和 C2C)的蓬勃發展
- 電子產品和服裝生產向越南近岸外包
- 東協「單一窗口」海關數位化
- 跨境公路貨運量迅速成長,目的地為中國、寮國和柬埔寨
- 進口可再生能源零件(風力發電機葉片、太陽能發電相關零件)
- 水產養殖出口和疫苗物流的低溫運輸需求
- 市場限制
- 國內貨櫃供需失衡及空貨櫃搬遷成本
- 卡車駕駛人短缺和勞動力老化
- 由於最後一公里網路分散,高成本(每站里程成本)
- 由於排放交易體系(ETS)導致碳排放監管成本增加
- 市場創新
- 波特五力分析
- 新進入者的威脅
- 供應商的議價能力
- 買方的議價能力
- 替代品的威脅
- 競爭對手之間的競爭
第5章 市場規模與成長預測
- 終端用戶產業
- 農業、漁業、林業
- 建設業
- 製造業
- 石油天然氣、採礦和採石
- 批發和零售
- 其他
- 物流職能
- 宅配、快捷郵件和小包裹(CEP)
- 按目的地
- 國內的
- 國際的
- 按目的地
- 貨運代理
- 透過交通工具
- 航空
- 海路和內河航道
- 其他
- 透過交通工具
- 貨物運輸
- 透過交通工具
- 航空
- 管道
- 鐵路
- 路
- 海路和內河航道
- 透過交通工具
- 倉儲
- 透過溫度控制
- 非溫控型
- 溫度控制
- 透過溫度控制
- 其他服務
- 宅配、快捷郵件和小包裹(CEP)
第6章 競爭情勢
- 市場集中度
- 重大策略舉措
- 市佔率分析
- 公司簡介
- AP Moller-Maersk
- Aviation Logistics Corporation
- Bee Logistics Corporation
- DHL Group
- DSV A/S(Including DB Schenker)
- Expeditors International of Washington, Inc.
- FedEx
- Gemadept
- Giao Hang Nhanh
- Hai Minh Group
- Hop Nhat International Joint Stock Company
- Indo Trans Logistics Corporation
- Kuehne+Nagel
- MACS Maritime Joint Stock Company
- Noi Bai Express and Trading Joint Stock Company
- NYK(Nippon Yusen Kaisha)Line
- PetroVietnam Transportation Corporation(PVTrans)
- Phuong Trang Bus Joint Stock Company-FUTA Bus Lines
- Saigon Cargo Service Corporation(SCSC)
- Samsung SDS
- Sojitz Corporation
- Transimex
- U&I Logistics Corporation
- United Parcel Service of America, Inc.(UPS)
- Vietfracht HoChiMinh
- Vietnam Foreign Trade Logistics Joint Stock Company(VINATRANS)
- Vietnam Maritime Corporation(Vinalines)
- ViettelPost(Including Viettel Logistics)
- Voltrans Logistics
- ZIM Integrated Shipping Services, Ltd.
第7章 市場機會與未來展望
The Vietnam freight and logistics market is expected to grow from USD 52.06 billion in 2025 to USD 55.5 billion in 2026 and is forecast to reach USD 76.39 billion by 2031 at 6.6% CAGR over 2026-2031.
This trajectory reflects sustained manufacturing inflows, e-commerce parcel growth, and public spending of USD 15 billion on roads, ports, and airports. Structural tailwinds include near-shoring from China, ASEAN single-window customs digitalization, and rising demand for temperature-controlled distribution that together lift volumes across road, sea, and air corridors. Competitive intensity is sharpening as international integrators deepen local footprints while domestic operators scale through cold-chain and last-mile investments. The Vietnam freight and logistics market, therefore, benefits from a virtuous cycle of infrastructure, trade liberalization, and digital transformation that reduces dwell times and unlocks new service niches.
Vietnam Freight And Logistics Market Trends and Insights
E-commerce Parcel Boom Drives Last-Mile Innovation
Domestic parcel volumes jumped 45% in 2024 as online marketplaces proliferated and social-commerce blunted geographic constraints. The Vietnam freight and logistics market has seen courier networks deploy automated sorters and AI route engines that shrink average delivery windows from 48 to 24 hours. Yet fragmented last-mile networks mean per-parcel delivery costs remain 28% above Thailand, spurring providers to pool micro-hubs and leverage crowdsourced drivers to widen rural reach. Regulatory momentum adds tailwind: simplified clearance for parcels under USD 200 now cuts customs dwell from five days to one. Capital follows demand, with ViettelPost opening 15 robotic sort centers and Giao Hang Nhanh pledging commune-level coverage by 2025. These moves embed digital density that accelerates future volume scaling and entrenches CEP as the fastest-growing slice of the Vietnam freight and logistics market.
Near-Shoring Transforms Manufacturing Logistics
Electronics and apparel relocations from China lifted manufacturing logistics demand 28% in 2024 as global brands hedged geopolitical and cost risk. Northern clusters host high-value electronics flows that prefer airfreight; component uplift at Noi Bai Airport climbed 35% year-over-year, forcing capacity additions and slot reprioritization. Samsung's expansion alone requires 2,400 TEU moves monthly, while Foxconn and Luxshare each operate closed-loop corridors to export gateways. Apparel producers leverage road-sea combinations, redirecting lead times 40% shorter than legacy China lanes. Providers offering kitting, return-handling, and quality-control warehousing now command premium margins, signaling a shift from pure transport to integrated contract logistics within the Vietnam freight and logistics market.
Container Imbalance Creates Cost Pressures
An export-to-import ratio of 3:1 strands empties inland, raising average repositioning outlay to USD 85 per 20-foot box and USD 170 for 40-foot units. Container imbalance charges rose 25% in 2024 as availability dipped below 70% during peak coffee and textile seasons. Forwarders deploy tracking IoT tags and shared pools to lift utilization and shave 15-20% from separate carrier costs, yet structural trade asymmetry means headhaul surcharges are unlikely to abate quickly. The Vietnam freight and logistics market thus endures volatility that squeezes margins for SME shippers.
Other drivers and restraints analyzed in the detailed report include:
- ASEAN Single Window Accelerates Cross-Border Efficiency
- Cross-Border Road Freight Corridor Expansion
- Workforce Shortages Constrain Capacity Growth
For complete list of drivers and restraints, kindly check the Table Of Contents.
Segment Analysis
Manufacturing drove 35.12% of Vietnam freight and logistics market share in 2025, anchored by electronics and garment hubs that mandate precise inventory sync with overseas buyers. Tight cycle times spur RFID-enabled component kitting and postponement warehousing, raising third-party logistics penetration. Wholesale and retail trade is catching up, projected to rise 6.98% CAGR (2026-2031) as modern grocery, direct-to-consumer brands, and cross-border marketplaces widen SKUs and delivery nodes. Cold-chain protocols expand with seafood, fruit, and vaccines, where shipment failure costs far exceed logistics premiums and justify GDP-certified partners. Regulatory pushes for pharmaceutical traceability raise barriers, funneling demand toward players with validated processes, reinforcing consolidation trends inside the Vietnam freight and logistics market.
Traditional sectors such as agriculture and construction keep baseline tonnage but face modal substitution; barge and rail pilots in the Mekong Delta shift bulky rice and sand away from congested highways. Oil, gas, and mining logistics remain specialist, with higher safety compliance and charter-party complexity that reward niche forwarders.
Freight transport generated 64.12% of the Vietnam freight and logistics market size in 2025 as export manufacturing dictated bulk cargo flows. Yet courier, express, and parcel revenue is on course for a 7.52% CAGR (2026-2031), commandeering incremental share as social-commerce and cross-border shopping proliferate. The CEP surge pushes operators to automate hubs and integrate customs APIs, compressing cut-off-to-delivery cycles by half. Warehousing follows digital cues; temperature-controlled assets are set to grow at 7.89% CAGR (2026-2031), supported by aquaculture and vaccine supply chains. As blockchain bills of lading and IoT sensor networks become standard, service boundaries blur; freight transporters bundle real-time visibility and value-added packaging to secure margin against commoditization in the Vietnam freight and logistics market.
Continued freight-transport primacy masks intra-modal shifts. Road retains scale through 2031, but airfreight and express haulage capture discretionary shipments where velocity trumps cost. Digital freight platforms aggregate spot loads that raise truck utilization by 12%, attacking pain points of empty backhauls and manual paperwork. Integrated planning unlocks multimodal itineraries that blend road, sea, and rail, trimming CO2 and appealing to ESG-minded exporters.
The Vietnam Freight and Logistics Market Report is Segmented by End User Industry (Agriculture, Fishing, and Forestry, Construction, Manufacturing, Oil and Gas, Mining and Quarrying, Wholesale and Retail Trade, and Others) and by Logistics Function (Courier, Express, and Parcel (CEP), Freight Forwarding, Freight Transport, Warehousing and Storage, and Other Services). The Market Forecasts are Provided in Terms of Value (USD).
List of Companies Covered in this Report:
- A.P. Moller - Maersk
- Aviation Logistics Corporation
- Bee Logistics Corporation
- DHL Group
- DSV A/S (Including DB Schenker)
- Expeditors International of Washington, Inc.
- FedEx
- Gemadept
- Giao Hang Nhanh
- Hai Minh Group
- Hop Nhat International Joint Stock Company
- Indo Trans Logistics Corporation
- Kuehne+Nagel
- MACS Maritime Joint Stock Company
- Noi Bai Express and Trading Joint Stock Company
- NYK (Nippon Yusen Kaisha) Line
- PetroVietnam Transportation Corporation (PVTrans)
- Phuong Trang Bus Joint Stock Company - FUTA Bus Lines
- Saigon Cargo Service Corporation (SCSC)
- Samsung SDS
- Sojitz Corporation
- Transimex
- U&I Logistics Corporation
- United Parcel Service of America, Inc. (UPS)
- Vietfracht HoChiMinh
- Vietnam Foreign Trade Logistics Joint Stock Company (VINATRANS)
- Vietnam Maritime Corporation (Vinalines)
- ViettelPost (Including Viettel Logistics)
- Voltrans Logistics
- ZIM Integrated Shipping Services, Ltd.
Additional Benefits:
- The market estimate (ME) sheet in Excel format
- 3 months of analyst support
TABLE OF CONTENTS
1 Introduction
- 1.1 Study Assumptions and Market Definition
- 1.2 Scope of the Study
2 Research Methodology
3 Executive Summary
4 Market Landscape
- 4.1 Market Overview
- 4.2 Demographics
- 4.3 GDP Distribution by Economic Activity
- 4.4 GDP Growth by Economic Activity
- 4.5 Inflation
- 4.6 Economic Performance and Profile
- 4.6.1 Trends in E-Commerce Industry
- 4.6.2 Trends in Manufacturing Industry
- 4.7 Transport and Storage Sector GDP
- 4.8 Export Trends
- 4.9 Import Trends
- 4.10 Fuel Price
- 4.11 Trucking Operational Costs
- 4.12 Trucking Fleet Size by Type
- 4.13 Major Truck Suppliers
- 4.14 Logistics Performance
- 4.15 Modal Share
- 4.16 Maritime Fleet Load Carrying Capacity
- 4.17 Liner Shipping Connectivity
- 4.18 Port Calls and Performance
- 4.19 Freight Pricing Trends
- 4.20 Freight Tonnage Trends
- 4.21 Infrastructure
- 4.22 Regulatory Framework (Road and Rail)
- 4.23 Regulatory Framework (Sea and Air)
- 4.24 Value Chain and Distribution Channel Analysis
- 4.25 Market Drivers
- 4.25.1 E-Commerce Parcel Boom (B2C and C2C)
- 4.25.2 Near-Shoring of Electronics and Apparel Production into Vietnam
- 4.25.3 ASEAN "Single Window" Customs Digitalisation
- 4.25.4 Surge in Cross-Border Road Freight to China-Laos-Cambodia
- 4.25.5 Renewable-Energy Component Imports (Wind-Turbine Blades, Solar)
- 4.25.6 Cold-Chain Demand for Aquaculture Exports and Vaccine Logistics
- 4.26 Market Restraints
- 4.26.1 Domestic Container Imbalance and Empty-Repositioning Costs
- 4.26.2 Truck Driver Shortages and Ageing Workforce
- 4.26.3 Fragmented Last-Mile Network Driving High Mile-Per-Stop Cost
- 4.26.4 Increasing Carbon-Emission Compliance Costs (ETS-Style)
- 4.27 Technology Innovations in the Market
- 4.28 Porter's Five Forces Analysis
- 4.28.1 Threat of New Entrants
- 4.28.2 Bargaining Power of Suppliers
- 4.28.3 Bargaining Power of Buyers
- 4.28.4 Threat of Substitutes
- 4.28.5 Competitive Rivalry
5 Market Size and Growth Forecasts (Value, USD)
- 5.1 End User Industry
- 5.1.1 Agriculture, Fishing, and Forestry
- 5.1.2 Construction
- 5.1.3 Manufacturing
- 5.1.4 Oil and Gas, Mining and Quarrying
- 5.1.5 Wholesale and Retail Trade
- 5.1.6 Others
- 5.2 Logistics Function
- 5.2.1 Courier, Express, and Parcel (CEP)
- 5.2.1.1 By Destination Type
- 5.2.1.1.1 Domestic
- 5.2.1.1.2 International
- 5.2.1.1 By Destination Type
- 5.2.2 Freight Forwarding
- 5.2.2.1 By Mode of Transport
- 5.2.2.1.1 Air
- 5.2.2.1.2 Sea and Inland Waterways
- 5.2.2.1.3 Others
- 5.2.2.1 By Mode of Transport
- 5.2.3 Freight Transport
- 5.2.3.1 By Mode of Transport
- 5.2.3.1.1 Air
- 5.2.3.1.2 Pipelines
- 5.2.3.1.3 Rail
- 5.2.3.1.4 Road
- 5.2.3.1.5 Sea and Inland Waterways
- 5.2.3.1 By Mode of Transport
- 5.2.4 Warehousing and Storage
- 5.2.4.1 By Temperature Control
- 5.2.4.1.1 Non-Temperature Controlled
- 5.2.4.1.2 Temperature Controlled
- 5.2.4.1 By Temperature Control
- 5.2.5 Other Services
- 5.2.1 Courier, Express, and Parcel (CEP)
6 Competitive Landscape
- 6.1 Market Concentration
- 6.2 Key Strategic Move
- 6.3 Market Share Analysis
- 6.4 Company Profiles (Includes Global Level Overview, Market Level Overview, Core Segments, Financials as Available, Strategic Information, Market Rank/Share for Key Companies, Products and Services, and Recent Developments)
- 6.4.1 A.P. Moller - Maersk
- 6.4.2 Aviation Logistics Corporation
- 6.4.3 Bee Logistics Corporation
- 6.4.4 DHL Group
- 6.4.5 DSV A/S (Including DB Schenker)
- 6.4.6 Expeditors International of Washington, Inc.
- 6.4.7 FedEx
- 6.4.8 Gemadept
- 6.4.9 Giao Hang Nhanh
- 6.4.10 Hai Minh Group
- 6.4.11 Hop Nhat International Joint Stock Company
- 6.4.12 Indo Trans Logistics Corporation
- 6.4.13 Kuehne+Nagel
- 6.4.14 MACS Maritime Joint Stock Company
- 6.4.15 Noi Bai Express and Trading Joint Stock Company
- 6.4.16 NYK (Nippon Yusen Kaisha) Line
- 6.4.17 PetroVietnam Transportation Corporation (PVTrans)
- 6.4.18 Phuong Trang Bus Joint Stock Company - FUTA Bus Lines
- 6.4.19 Saigon Cargo Service Corporation (SCSC)
- 6.4.20 Samsung SDS
- 6.4.21 Sojitz Corporation
- 6.4.22 Transimex
- 6.4.23 U&I Logistics Corporation
- 6.4.24 United Parcel Service of America, Inc. (UPS)
- 6.4.25 Vietfracht HoChiMinh
- 6.4.26 Vietnam Foreign Trade Logistics Joint Stock Company (VINATRANS)
- 6.4.27 Vietnam Maritime Corporation (Vinalines)
- 6.4.28 ViettelPost (Including Viettel Logistics)
- 6.4.29 Voltrans Logistics
- 6.4.30 ZIM Integrated Shipping Services, Ltd.
7 Market Opportunities and Future Outlook
- 7.1 White-Space and Unmet-Need Assessment
 2026年全球零碳運輸市場報告
 貨運及物流市場分析及預測(至2035年):依類型、產品類型、服務、技術、組件、應用、流程、最終使用者及運輸方式分類
 2026-2030年全球貨物審核與支付市場
 中東歐貨運與物流:市場佔有率分析、產業趨勢與統計、成長預測(2026-2031 年)亞太地區貨運與物流:市場佔有率分析、產業趨勢與統計、成長預測(2026-2031)南美貨運與物流:市場佔有率分析、產業趨勢與統計、成長預測(2026-2031)東協貨運與物流:市場佔有率分析、產業趨勢與統計、成長預測(2026-2031)泰國貨運與物流:市場佔有率分析、產業趨勢與統計、成長預測(2026-2031)美國貨運和物流:市場佔有率分析、行業趨勢和統計數據、成長預測(2026-2031 年)英國貨運與物流:市場佔有率分析、產業趨勢與統計、成長預測(2026-2031)