


 |
市場調查報告書
商品編碼
1939007
亞太地區貨運與物流:市場佔有率分析、產業趨勢與統計、成長預測(2026-2031)Asia Pacific Freight And Logistics - Market Share Analysis, Industry Trends & Statistics, Growth Forecasts (2026 - 2031) |
||||||
※ 本網頁內容可能與最新版本有所差異。詳細情況請與我們聯繫。
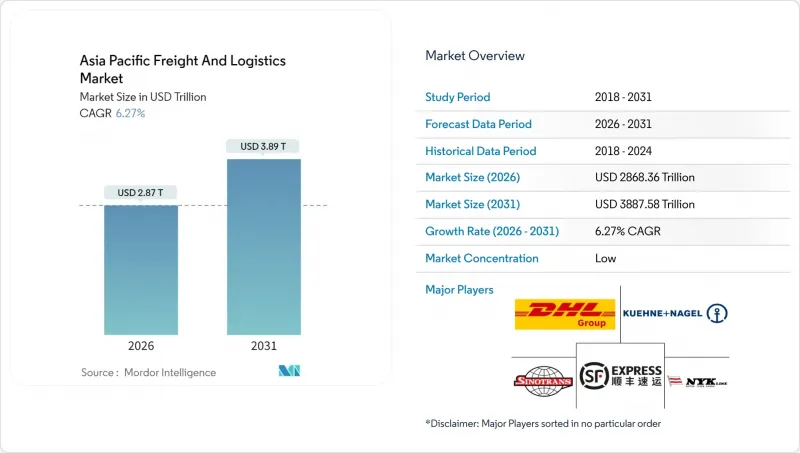
預計到 2026 年,亞太地區貨運和物流市場規模將達到 28,683.6 億美元。
這意味著從 2025 年的 2,6,983.8 億美元成長到 2031 年的 3,8,875.8 億美元,2026 年至 2031 年的複合年成長率為 6.27%。
強勁的區域內貿易、全球供應鏈的重組以及政策主導的基礎設施建設,可望推動亞太貨運物流市場的持續成長。製造業向東南亞的轉移以及跨境電子商務交易量的成長,正在重塑運輸路線的密度和服務組合,同時降低對傳統東西向幹線的依賴。同時,大型公共部門計劃釋放港口、公路和鐵路網路的潛力,增強亞太貨運物流市場的長期競爭力。日益嚴峻的氣候和安全風險促使托運人拓展業務範圍並投資於數位化視覺化,從而支撐了亞太貨運物流市場對獲利端到端物流解決方案的需求。
亞太地區貨運及物流市場趨勢及洞察
電子商務小包裹量快速成長
行動裝置的快速普及和電商平台的廣泛滲透正推動亞洲都市區小包裹量創下歷史新高。主要中央包裹服務供應商(宅配)預計到2025年將實現兩位數的包裹量成長,這促使自動化分揀中心和微型倉配中心迅速部署。小包裹密度的提高降低了單位配送成本,並實現了更具競爭力的價格,進一步加速了線上消費。為緩解交通堵塞,市府正在實施路邊取貨區和非尖峰時段貨運限制措施,間接推動了對技術驅動型末端物流平台的需求。這些因素共同作用,正推動亞太地區的貨運和物流市場轉向高頻次、小批量配送模式。
製造業轉移及近岸外包至東南亞
2024年,東協外國直接投資超過3,290億美元,這主要得益於電子、汽車和可再生能源公司將生產從單一國家集中化。越南的出口成長和泰國的東部經濟走廊是現代產業叢集如何創造新的零件和成品流通的典型例證,而這需要保稅倉庫、特殊的處理程序和同步的多模態能力。隨著近岸工廠的成熟,回程傳輸不平衡現象正在縮小,從而為亞太貨運和物流市場的承運人和貨運代理提高了運輸效率。
海關系統和文書工作分散
儘管東協單一窗口已經推出,但不同的單證規則仍然導致區域內運輸耗時更長。在某些市場,物流成本超過GDP的16%,主要原因是海關延誤和人工操作流程。區塊鏈試點計畫和可信任貿易業者計畫展現出一定的潛力,但實施不均衡阻礙了擴充性。中小型出口商承擔著不成比例的合規負擔,限制了它們參與亞太地區的貨運和物流市場。制定統一的數位化海關標準仍然是一項中期挑戰。
細分市場分析
至2025年,製造業35.74%的營收佔有率將來自電子、汽車和機械產業鏈對跨境物流同步化的需求。這一部分將成為貨運代理、倉儲業者和承運商合約費率和基本密度的基礎。
然而,批發和零售將成為成長最快的客戶群,複合年成長率將達到6.62%(2026-2031年)。全通路零售商對敏捷履約的依賴正在推動對區域配送中心、前瞻性庫存策略和退貨管理能力的投資。這些需求正在推動亞太地區貨運和物流市場服務結構的重組。
到2025年,貨運將佔亞太地區貨運和物流市場收入佔有率的60.12%,凸顯其在該地區貨運和物流市場規模中的關鍵地位。儘管由於大量製造原料和成品的運輸,整車運輸和貨櫃運輸路線仍保持高密度,但隨著需求轉向小包裹和更短的交貨時間,預計成長速度將放緩。
受數位商務蓬勃發展和消費者服務期望不斷提高的推動,預計2026年至2031年間,宅配、速遞和小包裹業務收入將以6.74%的複合年成長率成長。為因應包裹處理量的激增,大型業者正在其樞紐部署高速分類機和自動導引運輸車。展望未來,預計亞太地區貨運和物流市場的運輸方式將進一步向快遞(宅配 )傾斜,小包裹佔有率將持續下降。
其他福利:
- Excel格式的市場預測(ME)表
- 3個月的分析師支持
目錄
第1章 引言
- 研究假設和市場定義
- 調查範圍
第2章調查方法
第3章執行摘要
第4章 市場情勢
- 市場概覽
- 人口統計數據
- 按經濟活動分類的GDP分配
- 按經濟活動分類的GDP成長
- 通貨膨脹
- 經濟表現及概覽
- 電子商務產業的趨勢
- 製造業趨勢
- 運輸和倉儲業的GDP
- 出口趨勢
- 進口趨勢
- 燃油價格
- 卡車運輸營運成本
- 卡車運輸車隊規模(按類型)
- 主要卡車供應商
- 物流績效
- 按交通方式分享
- 海運船隊運力
- 班輪運輸連接
- 停靠港口和演出
- 貨運費率趨勢
- 貨物噸位趨勢
- 基礎設施
- 法規結構(公路和鐵路)
- 澳洲
- 中國
- 印度
- 印尼
- 日本
- 馬來西亞
- 泰國
- 越南
- 法規結構(海事和航空)
- 澳洲
- 中國
- 印度
- 印尼
- 日本
- 馬來西亞
- 泰國
- 越南
- 價值鍊和通路分析
- 市場促進因素
- 電子商務小包裹數量快速成長
- 製造業轉移及近岸外包至東南亞
- 透過政府主導的大型企劃發展港口、鐵路和公路
- 端到端供應鏈數位化和視覺化工具
- 跨境B2B2C樞紐可實現3-5天送達
- 與環境、社會及公司治理(ESG)掛鉤的綠色走廊獎勵和永續燃料信用額度
- 市場限制
- 海關系統和文書工作分散
- 主要港口和機場長期堵塞
- 碳定價機制增加了出口運費成本
- 二、三線物流中心數位人才短缺
- 市場創新
- 波特五力分析
- 新進入者的威脅
- 買方的議價能力
- 供應商的議價能力
- 替代品的威脅
- 競爭對手之間的競爭
第5章 市場規模與成長預測
- 終端用戶產業
- 農業、漁業、林業
- 建造
- 製造業
- 石油天然氣、採礦和採石
- 批發和零售
- 其他
- 物流職能
- 快遞小包裹(CEP)
- 按目的地類型
- 國內的
- 國際的
- 按目的地類型
- 貨運代理
- 透過交通工具
- 航空
- 海路和內河航道
- 其他
- 透過交通工具
- 貨物運輸
- 透過交通工具
- 航空
- 管道
- 鐵路
- 路
- 海路和內河航道
- 透過交通工具
- 倉儲
- 透過溫度控制
- 非溫控型
- 溫度控制
- 透過溫度控制
- 其他服務
- 快遞小包裹(CEP)
- 國家
- 澳洲
- 中國
- 印度
- 印尼
- 日本
- 馬來西亞
- 泰國
- 越南
- 亞太其他地區
第6章 競爭情勢
- 市場集中度
- 關鍵策略舉措
- 市佔率分析
- 公司簡介
- AP Moller-Maersk
- CH Robinson
- CJ Logistics Corporation
- DHL Group
- DP World
- DSV A/S(Including DB Schenker)
- Expeditors International of Washington, Inc.
- FedEx
- J&T Express
- JD Logistics
- Kuehne+Nagel
- LOGISTEED, Ltd.(Including Alps Logistics)
- NYK(Nippon Yusen Kaisha)Line
- SF Express(KEX-SF)
- SG Holdings Co., Ltd.
- Sinotrans, Ltd.
- Toll Group
- United Parcel Service of America, Inc.(UPS)
- XPO, Inc.
- YCH Group
第7章 市場機會與未來展望
Asia-Pacific freight and logistics market size in 2026 is estimated at USD 2,868.36 billion, growing from 2025 value of USD 2,698.38 billion with 2031 projections showing USD 3,887.58 billion, growing at 6.27% CAGR over 2026-2031.
Robust intra-Asian trade, the re-ordering of global supply chains, and policy-driven infrastructure upgrades position the Asia-Pacific freight and logistics market for sustained expansion. Manufacturing relocations into Southeast Asia, coupled with rising cross-border e-commerce volumes, are reshaping route density and service mix while tempering reliance on the traditional East-West mainline. At the same time, public-sector megaprojects are unlocking latent capacity in ports, highways, and rail links, reinforcing the long-term competitiveness of the Asia-Pacific freight and logistics market. Heightened climate and security risks are prompting shippers to diversify nodes and invest in digital visibility, supporting demand for higher-margin end-to-end logistics solutions across the Asia-Pacific freight and logistics market.
Asia Pacific Freight And Logistics Market Trends and Insights
Exploding E-commerce Parcel Volumes
Surging mobile adoption and marketplace penetration are pushing parcel counts to record highs across urban Asia. Leading CEP operators reported double-digit shipment growth in 2025, prompting rapid roll-out of automated sortation centers and micro-fulfillment hubs. Larger parcel densities are compressing unit delivery costs, enabling competitive pricing that further accelerates online spending. Urban governments are responding with curbside delivery zones and off-peak freight rules to manage congestion, indirectly reinforcing demand for technology-enabled last-mile platforms. Together, these forces are moving the Asia-Pacific freight and logistics market toward a higher-frequency, small-lot delivery paradigm.
Manufacturing Shift and Near-shoring into Southeast Asia
Foreign direct investment into ASEAN surpassed USD 329 billion in 2024, as electronics, automotive, and renewable-energy firms diversified production footprints away from single-country concentration. Vietnam's export growth and Thailand's Eastern Economic Corridor exemplify how modern industrial clusters are creating fresh flows of components and finished goods that require bonded warehousing, special-handling protocols, and synchronized multimodal capacity. As near-shored plants mature, backhaul imbalances are narrowing, unlocking rate efficiencies for carriers and forwarding agents across the Asia-Pacific freight and logistics market.
Fragmented Customs Regimes and Paperwork
Despite the ASEAN Single Window, disparate documentation rules still add several days to intra-regional transit. Logistics costs in some markets exceed 16% of GDP, driven largely by clearance delays and manual processes. While blockchain pilots and trusted-trader programs show promise, uneven implementation hinders scalability. Smaller exporters shoulder disproportionate compliance burdens, constraining their participation in the Asia-Pacific freight and logistics market. Progress toward harmonized digital customs standards remains a medium-term necessity.
Other drivers and restraints analyzed in the detailed report include:
- Government Megaprojects Upgrading Ports, Rail and Roads
- End-to-End Supply-chain Digitalization and Visibility Tools
- Chronic Congestion at Tier-1 Ports / Airports
For complete list of drivers and restraints, kindly check the Table Of Contents.
Segment Analysis
Manufacturing's 35.74% revenue share in 2025 derives from electronics, automotive, and machinery chains requiring synchronized cross-border logistics. The segment anchors contract rates and builds base density for forwarders, warehousing providers, and carriers.
Wholesale and retail trade, however, is the fastest-expanding customer pool with a 6.62% CAGR (2026-2031). Omnichannel retailers rely on responsive fulfillment frameworks, driving investment in regional distribution centers, inventory postponement strategies, and returns management capacity. These needs are recasting service menus across the Asia-Pacific freight and logistics market.
Freight transport accounted for 60.12% of 2025 revenue share, underscoring its anchor role in the Asia-Pacific freight and logistics market size. Bulk flows of manufacturing inputs and finished goods keep full-truckload and container lanes dense, yet growth is tapering as demand shifts toward smaller, faster consignments.
Courier, express, and parcel revenues are projected to rise 6.74% CAGR between 2026-2031, powered by digital-commerce momentum and rising consumer service expectations. Integrators are retrofitting hubs with high-speed sorters and autonomous guided vehicles to process soaring parcel counts. Over time, modal allocation is expected to tilt further toward CEP, moderating freight transport's share of the Asia-Pacific freight and logistics market.
The Asia Pacific Freight and Logistics Market Report is Segmented by End User Industry (Agriculture, Fishing, and Forestry, Construction, Manufacturing, and More), by Logistics Function (Courier, Express, and Parcel (CEP), Freight Forwarding, Freight Transport, Warehousing and Storage, and Other Services), and by Country (China, India, Indonesia, Malaysia, Japan, and More). The Market Forecasts are Provided in Terms of Value (USD).
List of Companies Covered in this Report:
- A.P. Moller - Maersk
- C.H. Robinson
- CJ Logistics Corporation
- DHL Group
- DP World
- DSV A/S (Including DB Schenker)
- Expeditors International of Washington, Inc.
- FedEx
- J&T Express
- JD Logistics
- Kuehne+Nagel
- LOGISTEED, Ltd. (Including Alps Logistics)
- NYK (Nippon Yusen Kaisha) Line
- SF Express (KEX-SF)
- SG Holdings Co., Ltd.
- Sinotrans, Ltd.
- Toll Group
- United Parcel Service of America, Inc. (UPS)
- XPO, Inc.
- YCH Group
Additional Benefits:
- The market estimate (ME) sheet in Excel format
- 3 months of analyst support
TABLE OF CONTENTS
1 Introduction
- 1.1 Study Assumptions and Market Definition
- 1.2 Scope of the Study
2 Research Methodology
3 Executive Summary
4 Market Landscape
- 4.1 Market Overview
- 4.2 Demographics
- 4.3 GDP Distribution by Economic Activity
- 4.4 GDP Growth by Economic Activity
- 4.5 Inflation
- 4.6 Economic Performance and Profile
- 4.6.1 Trends in E-Commerce Industry
- 4.6.2 Trends in Manufacturing Industry
- 4.7 Transport and Storage Sector GDP
- 4.8 Export Trends
- 4.9 Import Trends
- 4.10 Fuel Price
- 4.11 Trucking Operational Costs
- 4.12 Trucking Fleet Size by Type
- 4.13 Major Truck Suppliers
- 4.14 Logistics Performance
- 4.15 Modal Share
- 4.16 Maritime Fleet Load Carrying Capacity
- 4.17 Liner Shipping Connectivity
- 4.18 Port Calls and Performance
- 4.19 Freight Pricing Trends
- 4.20 Freight Tonnage Trends
- 4.21 Infrastructure
- 4.22 Regulatory Framework (Road and Rail)
- 4.22.1 Australia
- 4.22.2 China
- 4.22.3 India
- 4.22.4 Indonesia
- 4.22.5 Japan
- 4.22.6 Malaysia
- 4.22.7 Thailand
- 4.22.8 Vietnam
- 4.23 Regulatory Framework (Sea and Air)
- 4.23.1 Australia
- 4.23.2 China
- 4.23.3 India
- 4.23.4 Indonesia
- 4.23.5 Japan
- 4.23.6 Malaysia
- 4.23.7 Thailand
- 4.23.8 Vietnam
- 4.24 Value Chain and Distribution Channel Analysis
- 4.25 Market Drivers
- 4.25.1 Exploding E-Commerce Parcel Volumes
- 4.25.2 Manufacturing Shift and Near-Shoring into SE Asia
- 4.25.3 Government Megaprojects Upgrading Ports, Rail and Roads
- 4.25.4 End-To-End Supply-Chain Digitalization and Visibility Tools
- 4.25.5 Cross-Border B2B2C Hubs Enabling 3-5-Day Delivery
- 4.25.6 ESG-Linked Green-Corridor Incentives and Sustainable-Fuel Credits
- 4.26 Market Restraints
- 4.26.1 Fragmented Customs Regimes and Paperwork
- 4.26.2 Chronic Congestion at Tier-1 Ports / Airports
- 4.26.3 Carbon-Pricing Schemes Hiking Export Freight Costs
- 4.26.4 Digital-Talent Shortages in Tier-2/3 Logistics Nodes
- 4.27 Technology Innovations in the Market
- 4.28 Porter's Five Forces Analysis
- 4.28.1 Threat of New Entrants
- 4.28.2 Bargaining Power of Buyers
- 4.28.3 Bargaining Power of Suppliers
- 4.28.4 Threat of Substitutes
- 4.28.5 Intensity of Competitive Rivalry
5 Market Size and Growth Forecasts (Value, USD)
- 5.1 End User Industry
- 5.1.1 Agriculture, Fishing, and Forestry
- 5.1.2 Construction
- 5.1.3 Manufacturing
- 5.1.4 Oil and Gas, Mining and Quarrying
- 5.1.5 Wholesale and Retail Trade
- 5.1.6 Others
- 5.2 Logistics Function
- 5.2.1 Courier, Express, and Parcel (CEP)
- 5.2.1.1 By Destination Type
- 5.2.1.1.1 Domestic
- 5.2.1.1.2 International
- 5.2.1.1 By Destination Type
- 5.2.2 Freight Forwarding
- 5.2.2.1 By Mode of Transport
- 5.2.2.1.1 Air
- 5.2.2.1.2 Sea and Inland Waterways
- 5.2.2.1.3 Others
- 5.2.2.1 By Mode of Transport
- 5.2.3 Freight Transport
- 5.2.3.1 By Mode of Transport
- 5.2.3.1.1 Air
- 5.2.3.1.2 Pipelines
- 5.2.3.1.3 Rail
- 5.2.3.1.4 Road
- 5.2.3.1.5 Sea and Inland Waterways
- 5.2.3.1 By Mode of Transport
- 5.2.4 Warehousing and Storage
- 5.2.4.1 By Temperature Control
- 5.2.4.1.1 Non-Temperature Controlled
- 5.2.4.1.2 Temperature Controlled
- 5.2.4.1 By Temperature Control
- 5.2.5 Other Services
- 5.2.1 Courier, Express, and Parcel (CEP)
- 5.3 Country
- 5.3.1 Australia
- 5.3.2 China
- 5.3.3 India
- 5.3.4 Indonesia
- 5.3.5 Japan
- 5.3.6 Malaysia
- 5.3.7 Thailand
- 5.3.8 Vietnam
- 5.3.9 Rest of Asia-Pacific
6 Competitive Landscape
- 6.1 Market Concentration
- 6.2 Key Strategic Moves
- 6.3 Market Share Analysis
- 6.4 Company Profiles (Includes Global Level Overview, Market Level Overview, Core Segments, Financials as Available, Strategic Information, Market Rank/Share for Key Companies, Products and Services, and Recent Developments)
- 6.4.1 A.P. Moller - Maersk
- 6.4.2 C.H. Robinson
- 6.4.3 CJ Logistics Corporation
- 6.4.4 DHL Group
- 6.4.5 DP World
- 6.4.6 DSV A/S (Including DB Schenker)
- 6.4.7 Expeditors International of Washington, Inc.
- 6.4.8 FedEx
- 6.4.9 J&T Express
- 6.4.10 JD Logistics
- 6.4.11 Kuehne+Nagel
- 6.4.12 LOGISTEED, Ltd. (Including Alps Logistics)
- 6.4.13 NYK (Nippon Yusen Kaisha) Line
- 6.4.14 SF Express (KEX-SF)
- 6.4.15 SG Holdings Co., Ltd.
- 6.4.16 Sinotrans, Ltd.
- 6.4.17 Toll Group
- 6.4.18 United Parcel Service of America, Inc. (UPS)
- 6.4.19 XPO, Inc.
- 6.4.20 YCH Group
7 Market Opportunities and Future Outlook
- 7.1 White-Space and Unmet-Need Assessment
 全球貨運和物流市場:市場規模、佔有率、趨勢和成長分析(2026-2034 年)
 2026年全球貨車市場報告2026年全球貨運和物流市場報告2026年全球零碳運輸市場報告
 貨運及物流市場分析及預測(至2035年):依類型、產品類型、服務、技術、組件、應用、流程、最終使用者及運輸方式分類
 2026-2030年全球貨物審核與支付市場
 中東歐貨運與物流:市場佔有率分析、產業趨勢與統計、成長預測(2026-2031 年)南美貨運與物流:市場佔有率分析、產業趨勢與統計、成長預測(2026-2031)東協貨運與物流:市場佔有率分析、產業趨勢與統計、成長預測(2026-2031)泰國貨運與物流:市場佔有率分析、產業趨勢與統計、成長預測(2026-2031)