


 |
市場調查報告書
商品編碼
1939591
美國貨運和物流:市場佔有率分析、行業趨勢和統計數據、成長預測(2026-2031 年)United States Freight And Logistics - Market Share Analysis, Industry Trends & Statistics, Growth Forecasts (2026 - 2031) |
||||||
※ 本網頁內容可能與最新版本有所差異。詳細情況請與我們聯繫。
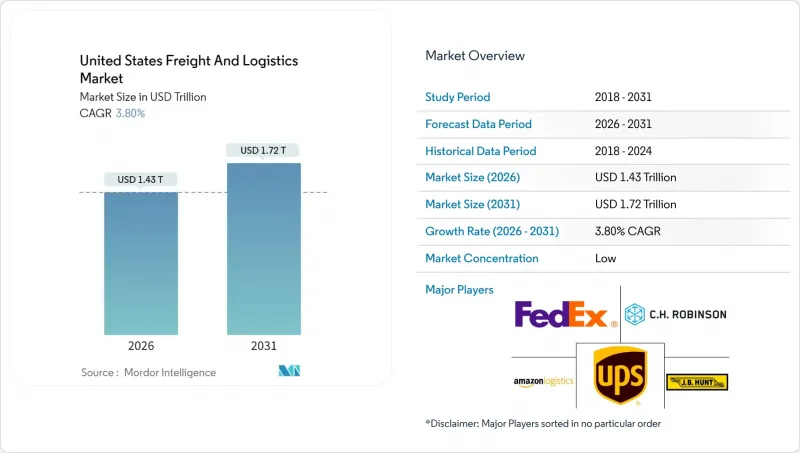
美國貨運和物流市場預計將從 2025 年的 13810.9 億美元成長到 2026 年的 14335.8 億美元,到 2031 年達到 17246 億美元,2026 年至 2031 年的複合年成長率為 3.8%。
這種溫和的成長軌跡反映了一個日益成熟且富有韌性的產業格局,該格局由電子商務履約、近岸外包主導的製造業流動以及技術的快速應用所塑造。托運人正從資產密集型模式轉向數位化協調的網路,從而實現運力最佳化和跨運輸方式的即時可視性。 《聯邦基礎設施投資與就業法案》(IIJA) 為公路、鐵路和港口提供的資金支持了網路的長期可靠性,而零排放卡車試驗則標誌著向永續交通的轉型正在加速。大型併購正在重塑全球貨運能力,而區域專業公司則在最後一公里配送和溫控服務領域開闢了利基市場,加劇了競爭。
美國貨運及物流市場趨勢及洞察
B2C電子商務小包裹量爆炸性成長
2024年國內小包裹量成長,推動了高頻短程運輸的需求。亞馬遜與聯邦快遞於2025年2月達成合作,共同開展超大包裹遞送業務,進一步強化了分散式履約模式,模糊了零售商和承運商之間的界線。消費者期望當日達和隔日達服務,迫使企業在淡季確保運力。區域性和末端配送專家正在擴大市場佔有率,而隨著高階空運被陸運取代,現有企業面臨利潤壓力。向直接面對消費者通路的轉變,正將貨運方式從托盤運輸轉向小型包裹,重塑路線密度和資產利用率要求。
以回流主導的國內製造業貨物流
《晶片製造和生產法案》(CHIPS Act)和《通貨膨脹控制法案》(Control of Inflation Act)共提供2,800億美元的激勵措施,正在加速供應鏈的在地化進程。半導體、汽車和製藥計劃正將貨運需求集中在五大湖區和東南走廊。隨著國內運輸距離的縮短,對時效性零件的卡車運輸依賴性日益增強,而對有限的長途運輸能力的競爭也日益激烈。儘管鐵路和港口擴建仍在繼續,但由於製造業回流導致貨運量增加,現有網路正面臨巨大壓力,從而導致製造業密集運輸路線的運費上漲。各州層級的獎勵措施正在鼓勵加強區域貨運樞紐建設,進一步凸顯了多模態的重要性。
長途司機日益短缺和薪資上漲
2024年,大型運輸公司仍將面臨離職率的困境,老化勞動力和生活方式的考量阻礙了新員工的加入。招聘獎金、增加居家時間以及擴大福利待遇提高了員工的薪資水平。然而,電子記錄設備(ELD)的強制使用和駕駛員工時限制,即使車輛充足,也降低了有效運輸能力。女性和年輕人的勞動參與率仍然很低,導致勞動力持續短缺。儘管學徒計畫和車隊現代化改善了招募環境,但仍不足以彌補勞動力缺口。
細分市場分析
到2025年,製造業將占美國貨運和物流市場的28.54%,這主要得益於零件流入量的增加以及由於回流激勵政策而帶來的成品分銷成長。該行業傾向於採用兼顧成本和週期時間的多模態解決方案,其中高價值電子產品和藥品依賴加急配送服務。儘管批發和零售業的規模較小,但隨著全通路零售不斷拓展微型倉配點和提高小包裹配送密度,其在2026年至2031年間的複合年成長率將達到4.05%,成為成長最快的產業。由於公共基礎設施支出,建築和物流業將保持穩定,而石油、天然氣、採礦和採石業則會受到大宗商品價格和能源政策變化的影響,出現波動。
農業、漁業和林業維持著穩定的散裝和冷藏貨物需求,但季節性波動需要靈活的運輸能力。可再生能源組件、醫療設備和資料中心設備等新興產業需要專業的處理和合規的監管,這增加了對具備行業知識的操作人員的需求。各行各業的供應鏈都在日益區域化,導致區域卡車運輸路線的貨運量增加。在成長型地區,對司機和倉儲工人的競爭也日益激烈。
到2025年,貨運將占美國貨運和物流市場佔有率的62.85%,主要由卡車運輸、鐵路運輸和多式聯運網路組成,為大宗貨物和製造業供應鏈提供支援。儘管規模較小,但小包裹遞送(CEP)預計將在2026年至2031年間實現最高的複合年成長率(CAGR),達到4.38%,這主要得益於電子商務小包裹密度集中在大都會圈履約中心附近。國內小包裹遞送服務將維持76.05%的市場佔有率,而國際小小包裹運輸量則因跨境電子商務需求以及簡化的最低限額海關規則而不斷成長。倉儲需求強勁,到2025年,非溫控設施將佔總容量的92.05%。由於藥品和生鮮食品物流的需求,溫控設施的面積正在加速。
營運商正模糊功能邊界,並透過整合運輸、倉儲和附加價值服務來獲取更大的市場佔有率。數位化編配平台支援跨設施網路的即時模式選擇和庫存調整。快速運輸業者正在實施自動化分類系統和人工智慧驅動的路線最佳化,以應對勞動力短缺問題。在貨運領域,零排放卡車試驗和由國際工業發展聯盟(IIJA)資助的走廊開發項目正在改變車隊結構並提升區域效率。服務融合使全端式服務提供者能夠掌握結構性變革帶來的機遇,而專注於速度、合規性和產品完整性的細分領域專家則蓬勃發展。
其他福利:
- Excel格式的市場預測(ME)表
- 分析師支持(3個月)
目錄
第1章 引言
- 研究假設和市場定義
- 調查範圍
第2章調查方法
第3章執行摘要
第4章 市場情勢
- 市場概覽
- 人口統計數據
- 按經濟活動分類的GDP分配
- 按經濟活動分類的GDP成長
- 通貨膨脹
- 經濟表現和公司概況
- 電子商務產業的趨勢
- 製造業趨勢
- 運輸和倉儲業的GDP
- 出口趨勢
- 進口趨勢
- 燃油價格
- 卡車運輸營運成本
- 卡車運輸車隊規模(按類型)
- 主要卡車供應商
- 物流績效
- 按交通方式分享
- 海運船隊運力
- 班輪運輸連接
- 停靠港口和演出
- 貨運費率趨勢
- 貨物噸位趨勢
- 基礎設施
- 法規結構(公路和鐵路)
- 法規結構(海事和航空)
- 價值鍊和通路分析
- 市場促進因素
- B2C電子商務小包裹處理量呈爆炸性成長
- 由於製造業回流,國內製造業貨運趨勢
- 中型托運人中第三方/第四方物流外包業務的擴張
- 聯邦基礎設施投資和就業法案(IIJA)資金
- 數位化貨運市場和基於API的運力聚合
- 零排放卡車走廊試點計畫(氫燃料/純電動汽車)
- 市場限制
- 長途司機嚴重短缺,但薪資不斷上漲
- 港口、鐵路樞紐和都市區壅塞造成的瓶頸
- 網路風險保險和合規成本飆升
- 「核彈級」陪審團裁決導致汽車保險價格飆升
- 市場創新
- 波特五力分析
- 新進入者的威脅
- 替代品的威脅
- 供應商的議價能力
- 買方的議價能力
- 競爭對手之間的競爭
第5章 市場規模與成長預測
- 終端用戶產業
- 農業、漁業、林業
- 建設業
- 製造業
- 石油天然氣、採礦和採石
- 批發和零售
- 其他
- 物流職能
- 快遞、快捷郵件和小包裹(CEP)
- 按目的地
- 國內的
- 國際的
- 按目的地
- 貨運代理
- 透過交通工具
- 航空
- 海路和內河航道
- 其他
- 透過交通工具
- 貨物運輸
- 透過交通工具
- 航空
- 管道
- 鐵路
- 路
- 海路和內河航道
- 透過交通工具
- 倉儲
- 透過溫度控制
- 非溫控型
- 溫度控制
- 透過溫度控制
- 其他服務
- 快遞、快捷郵件和小包裹(CEP)
第6章 競爭情勢
- 市場集中度
- 關鍵策略舉措
- 市佔率分析
- 公司簡介
- Amazon Logistics
- CH Robinson
- DHL Group
- DSV A/S(Including DB Schenker)
- Expeditors International of Washington, Inc.
- FedEx
- GXO Logistics, Inc.
- JB Hunt Transport, Inc.
- Kuehne+Nagel
- Landstar System, Inc.
- Lineage, Inc.
- AP Moller-Maersk
- NFI Industries
- Old Dominion Freight Line
- Penske Corporation, Inc.
- Ryder System, Inc.
- Schneider National, Inc.
- SEKO Logistics
- United Parcel Service of America, Inc.(UPS)
- XPO, Inc.
第7章 市場機會與未來展望
The United States freight and logistics market is expected to grow from USD 1,381.09 billion in 2025 to USD 1,433.58 billion in 2026 and is forecast to reach USD 1,724.6 billion by 2031 at 3.8% CAGR over 2026-2031.
This moderate trajectory reflects a maturing yet resilient landscape shaped by e-commerce fulfillment, nearshoring-driven manufacturing flows, and rapid technology adoption. Shippers shift from asset-heavy to digitally orchestrated networks, unlocking capacity optimization and real-time visibility across modes. Federal Infrastructure Investment and Jobs Act (IIJA) funds earmarked for roads, rail, and ports underpin long-term network reliability, while zero-emission truck pilots signal an accelerating transition toward sustainable transport. Competitive intensity tightens as large mergers reshape global forwarding capabilities, even as regional specialists carve niche positions around last-mile and temperature-controlled services.
United States Freight And Logistics Market Trends and Insights
Explosive B2C E-Commerce Parcel Volumes
Domestic parcel shipments increased in 2024, intensifying demand for high-frequency, short-haul movements. Amazon's February 2025 collaboration with FedEx on large packages reinforces distributed fulfillment models that blur lines between retailers and carriers. Consumers expect same-day and next-day delivery, compelling providers to hold reserve capacity during off-peak periods. Regional carriers and last-mile specialists gain share as incumbents manage margin pressure from the groundification of formerly premium air services. The shift toward direct-to-consumer channels reroutes freight from palletized to parcel flows, reshaping lane density and asset utilization requirements.
Reshoring-Driven Domestic Manufacturing Freight Flows
Supply-chain localization accelerates, supported by the CHIPS Act and the Inflation Reduction Act incentives totaling USD 280 billion. Semiconductor, automotive, and pharmaceutical projects concentrate freight demand in the Great Lakes and Southeast corridors. Shorter domestic routes increase reliance on trucking for time-critical components while competing for limited long-haul capacity. Rate premiums emerge on dense manufacturing lanes as reshored volumes stress existing networks, despite ongoing rail and port expansions. State-level incentives amplify regional freight nodes, reinforcing multimodal connectivity priorities.
Acute Long-Haul Driver Shortage and Wage Inflation
Large carriers continued battling elevated turnover in 2024 as an aging workforce and lifestyle concerns deter new entrants. Wage packages climbed as fleets offered signing bonuses, improved home time, and benefit enhancements. Electronic Logging Device mandates and hours-of-service limits reduce effective capacity even when equipment is available. Female and younger worker participation remains low, keeping the labor pool tight. Apprenticeship programs and modernized fleet amenities improve recruitment optics but have yet to close the gap.
Other drivers and restraints analyzed in the detailed report include:
- Expansion of 3PL/4PL Outsourcing Across Mid-Market Shippers
- Infrastructure Investment and Jobs Act (IIJA) Funding
- Port, Rail-Ramp and Urban Congestion Bottlenecks
For complete list of drivers and restraints, kindly check the Table Of Contents.
Segment Analysis
Manufacturing contributed 28.54% to the United States freight and logistics market size in 2025 as component inflows and finished-goods distribution multiplied with reshoring incentives. The sector favors multimodal solutions that balance cost and cycle-time, with high-value electronics and pharmaceuticals leaning on expedited services. Wholesale and retail trade, though smaller, posts the fastest 4.05% CAGR (2026-2031) as omnichannel retailing scales micro-fulfillment nodes and parcel density. Construction logistics remain steady on public infrastructure outlays, while oil, gas, mining, and quarrying see volatility tied to commodity pricing and energy policy transitions.
Agriculture, fishing, and forestry maintain a stable baseline of bulk and refrigerated moves, though seasonal variability drives flexible capacity requirements. Emerging verticals, renewable energy components, healthcare devices, and data-center equipment demand specialized handling and regulatory compliance, favoring providers with sector expertise. Across industries, supply-chain localization shifts more volume onto regional trucking lanes, intensifying competition for drivers and warehouse labor in growth corridors.
Freight transport captured 62.85% of the United States freight and logistics market share in 2025, anchored by trucking, rail, and intermodal networks that serve bulk commodities and manufacturing supply chains. CEP, while smaller, posted the strongest 4.38% CAGR (2026-2031) outlook, fueled by e-commerce parcel density clustering around metropolitan fulfillment hubs. Domestic CEP services held 76.05% share, though international small-parcel flows rise on Cross-Border e-commerce demand, supported by simplified de minimis clearance rules. Warehousing and storage demand remains robust, with non-temperature facilities comprising 92.05% of capacity in 2025, yet temperature-controlled square footage expands faster on pharmaceuticals and fresh-food logistics.
Providers blur functional lines as integrated offerings combine transportation, warehousing, and value-added services to capture deeper wallet share. Digital orchestration platforms enable real-time mode selection and inventory balancing across facility networks. CEP operators deploy automated sortation and AI-driven route optimization to offset labor constraints. In freight transport, zero-emission truck pilots and IIJA-funded corridor upgrades will alter fleet mix and regional efficiencies. The convergence of services positions full-stack providers to capitalize on secular shifts while niche specialists succeed by focusing on speed, compliance, or product integrity.
The United States Freight and Logistics Market Report is Segmented by End User Industry (Agriculture, Fishing, and Forestry, Construction, Manufacturing, Oil and Gas, Mining and Quarrying, Wholesale and Retail Trade, and Others) and by Logistics Function (Courier, Express, and Parcel (CEP), Freight Forwarding, Freight Transport, Warehousing and Storage, and Other Services). The Market Forecasts are Provided in Terms of Value (USD).
List of Companies Covered in this Report:
- Amazon Logistics
- C.H. Robinson
- DHL Group
- DSV A/S (Including DB Schenker)
- Expeditors International of Washington, Inc.
- FedEx
- GXO Logistics, Inc.
- J.B. Hunt Transport, Inc.
- Kuehne+Nagel
- Landstar System, Inc.
- Lineage, Inc.
- A.P. Moller - Maersk
- NFI Industries
- Old Dominion Freight Line
- Penske Corporation, Inc.
- Ryder System, Inc.
- Schneider National, Inc.
- SEKO Logistics
- United Parcel Service of America, Inc. (UPS)
- XPO, Inc.
Additional Benefits:
- The market estimate (ME) sheet in Excel format
- 3 months of analyst support
TABLE OF CONTENTS
1 Introduction
- 1.1 Study Assumptions and Market Definition
- 1.2 Scope of the Study
2 Research Methodology
3 Executive Summary
4 Market Landscape
- 4.1 Market Overview
- 4.2 Demographics
- 4.3 GDP Distribution by Economic Activity
- 4.4 GDP Growth by Economic Activity
- 4.5 Inflation
- 4.6 Economic Performance and Profile
- 4.6.1 Trends in E-Commerce Industry
- 4.6.2 Trends in Manufacturing Industry
- 4.7 Transport and Storage Sector GDP
- 4.8 Export Trends
- 4.9 Import Trends
- 4.10 Fuel Price
- 4.11 Trucking Operational Costs
- 4.12 Trucking Fleet Size by Type
- 4.13 Major Truck Suppliers
- 4.14 Logistics Performance
- 4.15 Modal Share
- 4.16 Maritime Fleet Load Carrying Capacity
- 4.17 Liner Shipping Connectivity
- 4.18 Port Calls and Performance
- 4.19 Freight Pricing Trends
- 4.20 Freight Tonnage Trends
- 4.21 Infrastructure
- 4.22 Regulatory Framework (Road and Rail)
- 4.23 Regulatory Framework (Sea and Air)
- 4.24 Value Chain and Distribution Channel Analysis
- 4.25 Market Drivers
- 4.25.1 Explosive B2C E-Commerce Parcel Volumes
- 4.25.2 Reshoring-Driven Domestic Manufacturing Freight Flows
- 4.25.3 Expansion of 3PL/4PL Outsourcing Across Mid-Market Shippers
- 4.25.4 Federal Infrastructure Investment and Jobs Act (IIJA) Funding
- 4.25.5 Digital Freight Marketplaces and API-Based Capacity Aggregation
- 4.25.6 Zero-Emission Truck Corridor Pilots (Hydrogen / BEV)
- 4.26 Market Restraints
- 4.26.1 Acute Long-Haul Driver Shortage and Wage Inflation
- 4.26.2 Port, Rail-Ramp and Urban Congestion Bottlenecks
- 4.26.3 Escalating Cyber-Risk Insurance and Compliance Costs
- 4.26.4 "Nuclear" Jury Verdicts Driving Motor-Carrier Insurance Spikes
- 4.27 Technology Innovations in the Market
- 4.28 Porter's Five Forces Analysis
- 4.28.1 Threat of New Entrants
- 4.28.2 Threat of Substitutes
- 4.28.3 Bargaining Power of Suppliers
- 4.28.4 Bargaining Power of Buyers
- 4.28.5 Competitive Rivalry
5 Market Size and Growth Forecasts (Value, USD)
- 5.1 End User Industry
- 5.1.1 Agriculture, Fishing, and Forestry
- 5.1.2 Construction
- 5.1.3 Manufacturing
- 5.1.4 Oil and Gas, Mining and Quarrying
- 5.1.5 Wholesale and Retail Trade
- 5.1.6 Others
- 5.2 Logistics Function
- 5.2.1 Courier, Express, and Parcel (CEP)
- 5.2.1.1 By Destination Type
- 5.2.1.1.1 Domestic
- 5.2.1.1.2 International
- 5.2.1.1 By Destination Type
- 5.2.2 Freight Forwarding
- 5.2.2.1 By Mode of Transport
- 5.2.2.1.1 Air
- 5.2.2.1.2 Sea and Inland Waterways
- 5.2.2.1.3 Others
- 5.2.2.1 By Mode of Transport
- 5.2.3 Freight Transport
- 5.2.3.1 By Mode of Transport
- 5.2.3.1.1 Air
- 5.2.3.1.2 Pipelines
- 5.2.3.1.3 Rail
- 5.2.3.1.4 Road
- 5.2.3.1.5 Sea and Inland Waterways
- 5.2.3.1 By Mode of Transport
- 5.2.4 Warehousing and Storage
- 5.2.4.1 By Temperature Control
- 5.2.4.1.1 Non-Temperature Controlled
- 5.2.4.1.2 Temperature Controlled
- 5.2.4.1 By Temperature Control
- 5.2.5 Other Services
- 5.2.1 Courier, Express, and Parcel (CEP)
6 Competitive Landscape
- 6.1 Market Concentration
- 6.2 Key Strategic Moves
- 6.3 Market Share Analysis
- 6.4 Company Profiles (Includes Global Level Overview, Market Level Overview, Core Segments, Financials as Available, Strategic Information, Market Rank/Share for Key Companies, Products and Services, and Recent Developments)
- 6.4.1 Amazon Logistics
- 6.4.2 C.H. Robinson
- 6.4.3 DHL Group
- 6.4.4 DSV A/S (Including DB Schenker)
- 6.4.5 Expeditors International of Washington, Inc.
- 6.4.6 FedEx
- 6.4.7 GXO Logistics, Inc.
- 6.4.8 J.B. Hunt Transport, Inc.
- 6.4.9 Kuehne+Nagel
- 6.4.10 Landstar System, Inc.
- 6.4.11 Lineage, Inc.
- 6.4.12 A.P. Moller - Maersk
- 6.4.13 NFI Industries
- 6.4.14 Old Dominion Freight Line
- 6.4.15 Penske Corporation, Inc.
- 6.4.16 Ryder System, Inc.
- 6.4.17 Schneider National, Inc.
- 6.4.18 SEKO Logistics
- 6.4.19 United Parcel Service of America, Inc. (UPS)
- 6.4.20 XPO, Inc.
7 Market Opportunities and Future Outlook
- 7.1 White-Space and Unmet-Need Assessment
 2026年全球零碳運輸市場報告
 貨運及物流市場分析及預測(至2035年):依類型、產品類型、服務、技術、組件、應用、流程、最終使用者及運輸方式分類
 2026-2030年全球貨物審核與支付市場
 中東歐貨運與物流:市場佔有率分析、產業趨勢與統計、成長預測(2026-2031 年)亞太地區貨運與物流:市場佔有率分析、產業趨勢與統計、成長預測(2026-2031)南美貨運與物流:市場佔有率分析、產業趨勢與統計、成長預測(2026-2031)東協貨運與物流:市場佔有率分析、產業趨勢與統計、成長預測(2026-2031)泰國貨運與物流:市場佔有率分析、產業趨勢與統計、成長預測(2026-2031)英國貨運與物流:市場佔有率分析、產業趨勢與統計、成長預測(2026-2031)西班牙貨運與物流:市場佔有率分析、產業趨勢與統計、成長預測(2026-2031)