


 |
市場調查報告書
商品編碼
1907302
印尼貨運與物流:市場佔有率分析、產業趨勢、統計及成長預測(2026-2031)Indonesia Freight And Logistics - Market Share Analysis, Industry Trends & Statistics, Growth Forecasts (2026 - 2031) |
||||||
※ 本網頁內容可能與最新版本有所差異。詳細情況請與我們聯繫。
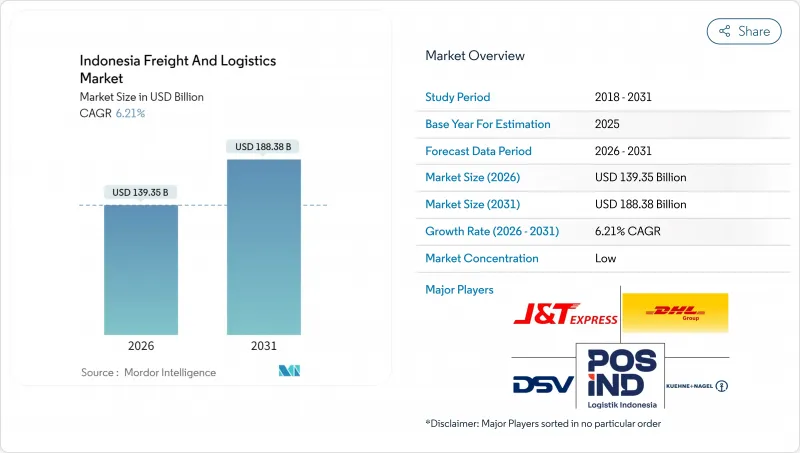
預計到 2026 年,印尼的貨物和物流市場規模將達到 1,393.5 億美元。
這意味著從 2025 年的 1,312 億美元成長到 2031 年的 1,883.8 億美元,2026 年至 2031 年的年複合成長率(CAGR)為 6.21%。
印尼電子商務的快速成長、2700公里新建收費公路的建設以及出口導向製造業產出的成長,都在推動該國的經濟成長。同時,大型企劃正將業務範圍擴展到爪哇島以外的地區。對國家物流生態系統(NLE)等數位化平台的投資,正在縮短清關時間、降低行政成本,進而提升印尼貨運和物流市場的結構性效率。此外,低溫運輸設施的擴建、航空貨運能力的提升以及多模態網路的升級,也為營運商提供了差異化服務的途徑。在競爭激烈的市場環境中,那些能夠利用數據驅動的路線最佳化和即時視覺化工具來應對嚴重的都市區堵塞、燃油價格波動以及法規重疊等挑戰的技術型供應商更勝一籌。
印尼貨運及物流市場趨勢及洞察
電子商務的快速發展和小包裹運輸量的快速成長
快速的數位化正推動線上零售交易以每年15%的速度成長,直至2025年,這將為最後一公里配送網路帶來前所未有的小小包裹量。 J&T Express和JNE等小包裹遞送(CEP)專家正在擴展其自動化樞紐和收貨點生態系統,以有效處理這一物流流量。雖然訂單主要集中在爪哇島人口稠密的大都會區,但隨著數位支付的普及,區域性城市的訂單量也出現了兩位數的成長。在雅加達都市區,道路擁塞限制了平均配送速度,僅為10-15公里/小時,從而增加了單位成本。這促使營運商向微型倉配、摩托車配送網路和人工智慧驅動的路線規劃轉型。擁有詳細地址資料庫和動態路線規劃能力的營運商享有成本優勢,而傳統的貨運代理商則正努力改造其大批量貨運處理流程,以適應消費者的配送需求。
大型企劃基礎建設項目(收費公路、港口、機場)
國家戰略計劃計劃已投資4000億美元用於公路、港口和機場建設,使爪哇島各工業中心之間的運輸時間縮短了高達40%。超過2700公里的新建收費公路將內陸工廠與主要港口連接起來,INAPORTNET港口數位化也縮短了海關停留時間。望加錫港升級為主要樞紐,開闢了一條新的東部出口走廊,有助於緩解爪哇島的交通堵塞。互聯互通的改善使貨運公司能夠重新設計多模態路線,減少庫存積壓,並促進低溫運輸向漁業區域的擴展。隨著配套的內陸鐵路支線和工業運作,各項效益將逐步積累,而一些先行者已經開始根據幹線可靠性的提高重新最佳化倉庫選址。
嚴重的都市區擁擠和最後一公里瓶頸
雅加達尖峰時段的平均車速仍維持在每小時10-15公里,導致最後一公里配送費用居高不下,最高可達配送成本的50%。快遞業者正試圖透過引入隔夜送達、微型配送中心和摩托車快遞員等方式來緩解堵塞,但這些措施增加了勞動力管理的複雜性。對溫度敏感的貨物在交通堵塞中容易變質,迫使托運人選擇有送達時間保證的加值服務。政府採取的單雙號限行等措施對面臨調度挑戰的貨車來說,緩解效果有限。隨著電商小包裹量的成長,除非城市物流分區和非道路裝卸法規得到改進,否則壅塞成本預計將會更加嚴重。
細分市場分析
到2025年,以汽車、電子和紡織業為主導的製造業將佔印尼貨物和物流市場需求的28.45%。強勁的出口導向需要對保稅物流中心、港口和機場進行準時交付。同時,由於中產階級消費的成長,預計2026年至2031年批發零售業將以6.64%的複合年成長率成長,迫使物流公司建構多地點配送網路。農業、林業和漁業將維持與大宗商品出口相關的穩定規模,而由於基礎設施投資的增加,建築物流正在蓬勃發展。
批發和零售客戶對全國範圍內的當日達或次日達服務需求日益成長,這推動了區域配送中心和強大的干線運輸網路的需求。隨著製造業推動循環經濟目標並增加退貨和回收的逆向物流流程,印尼貨運和物流業的服務組合正變得日益多元化。
截至2025年,貨運代理業務佔印尼貨運和物流市場的58.95%。儘管規模較小,但宅配(CEP)業務的成長速度超過了其他業務,在2026年至2031年間,其複合年成長率(CAGR)預計將達到7.12%,這主要得益於B2C貨運的成長。貨運代理業務在多模態協調中繼續發揮至關重要的作用,尤其是在連接工業園區和出口港口的陸海聯運鏈中。隨著支援全通路功能的庫存管理服務模式日益普及,倉儲服務的收入也穩定成長。其他服務,例如報關和供應鏈諮詢,則受益於日益複雜的監管環境和貿易數位化。
電子商務交易量每年成長15%,推動了宅配(CEP)的快速成長,這需要高密度的配送網路和高效的分揀處理能力。自動化樞紐降低了單件包裹的配送成本,並實現了當日送達。貨運代理商正投資建造宅配櫃,並與叫車服務公司合作,以保持競爭力。同時,倉庫業者正在維修轉運區以適應小包裹分類的需求,這推動了印尼貨運和物流市場的整合。
其他福利:
- Excel格式的市場預測(ME)表
- 3個月的分析師支持
目錄
第1章 引言
- 研究假設和市場定義
- 調查範圍
第2章調查方法
第3章執行摘要
第4章 市場情勢
- 市場概覽
- 人口統計數據
- 按經濟活動分類的GDP分配
- 按經濟活動分類的GDP成長
- 通貨膨脹
- 經濟表現及概覽
- 電子商務產業的趨勢
- 製造業趨勢
- 運輸和倉儲業GDP
- 出口趨勢
- 進口趨勢
- 燃油價格
- 卡車運輸營運成本
- 卡車運輸車隊規模(按類型)
- 主要卡車供應商
- 物流績效
- 透過交通方式分享
- 海運船隊運力
- 班輪運輸連接
- 停靠港口和演出
- 貨運費率趨勢
- 貨物運輸量趨勢
- 基礎設施
- 法律規範(公路和鐵路)
- 法律規範(海事和航空)
- 價值鍊和通路分析
- 市場促進因素
- 電子商務和小包裹處理量快速成長
- 大型企劃基礎建設項目(收費公路、港口、機場)
- 製造業及出口(汽車、電子設備、紡織品)的復甦
- 國內消費增加及中產階級支出增加
- 國家物流生態系(NLE)數位平台簡介
- 水產養殖和水產品出口對低溫運輸的需求
- 市場限制
- 嚴重的都市區擁擠和最後一公里瓶頸
- 監管碎片化和許可證重疊
- 燃油價格波動劇烈
- 物流技術人員短缺
- 市場創新
- 波特五力分析
- 新進入者的威脅
- 買方的議價能力
- 供應商的議價能力
- 替代品的威脅
- 競爭對手之間的競爭
第5章 市場規模與成長預測
- 終端用戶產業
- 農業、漁業、林業
- 建設業
- 製造業
- 石油天然氣、採礦和採石
- 批發和零售
- 其他
- 物流職能
- 宅配、速遞和小包裹(CEP)
- 按目的地
- 國內的
- 國際的
- 按目的地
- 貨運代理
- 透過交通工具
- 航空
- 海路和內河航道
- 其他
- 透過交通工具
- 貨物運輸
- 透過交通工具
- 航空
- 管道
- 鐵路
- 路
- 海路和內河航道
- 透過交通工具
- 倉儲
- 透過溫度控制
- 非溫控型
- 溫度控制
- 透過溫度控制
- 其他服務
- 宅配、速遞和小包裹(CEP)
第6章 競爭情勢
- 市場集中度
- 關鍵策略舉措
- 市佔率分析
- 公司簡介
- DHL Group
- DSV A/S(Including DB Schenker)
- Expeditors International of Washington, Inc.
- FedEx
- J&T Express
- Kuehne+Nagel
- Linfox Pty Ltd.
- LOGWIN
- Ninja Van(Including Ninja Express)
- NYK(Nippon Yusen Kaisha)Line
- Pancaran Group
- PT ABM Investama TBK(including CKB Logistics)
- PT Bina Sinar Amity(BSA Logistics Indonesia)
- PT Cardig International
- PT Citrabati Logistik International
- PT Dunia Express Transindo
- PT Jalur Nugraha Ekakurir(JNE Express)
- PT Kamadjaja Logistics
- PT Lautan Luas TBK
- PT Pandu Siwi Group(Pandu Logistics)
- PT Perusahaan Perdagangan Indonesia(including BGR Indonesia)
- PT Pos Indonesia(Persero)
- PT Repex Wahana(RPX)
- PT Samudera Indonesia Tangguh
- PT Satria Antaran Prima TBK(SAPX Express)
- PT Siba Surya
- PT Soechi Lines Tbk
- Puninar Logistics
- SF Express(KEX-SF)
- Sinotrans, Ltd.
- United Parcel Service of America, Inc.(UPS)
第7章 市場機會與未來展望
The Indonesia freight and logistics market size in 2026 is estimated at USD 139.35 billion, growing from 2025 value of USD 131.20 billion with 2031 projections showing USD 188.38 billion, growing at 6.21% CAGR over 2026-2031.
The archipelago's e-commerce boom, the rollout of 2,700 km of new toll roads, and rising export manufacturing output collectively accelerate growth, while infrastructure megaprojects widen geographic coverage beyond Java. Investment in digital platforms such as the National Logistics Ecosystem (NLE) shortens customs clearance times and lowers administrative costs, giving the Indonesia freight and logistics market a structural efficiency lift. Simultaneously, cold-chain facility build-outs, Air freight capacity additions, and multimodal network upgrades provide operators with routes to higher service differentiation. Competitive dynamics favor technology-enabled providers that can navigate severe urban congestion, volatile fuel prices, and overlapping regulations with data-driven route optimization and real-time visibility tools.
Indonesia Freight And Logistics Market Trends and Insights
E-Commerce Boom and Parcel-Volume Surge
Rapid digitization lifts online retail transactions by 15% annually to 2025, funneling unprecedented small-parcel volumes into last-mile networks. CEP specialists such as J&T Express and JNE scale automated hubs and pickup-point ecosystems to handle the flow efficiently. Java's dense conurbations dominate order originations, yet tier-2 cities now post double-digit volume gains as digital payments proliferate. Congested urban arteries in Jakarta limit average delivery speeds to 10-15 km/h, inflating per-package costs and pushing operators toward micro-fulfillment, two-wheeler fleets, and AI-driven route planning. Players with granular address databases and dynamic routing enjoy cost advantages, while traditional freight forwarders scramble to retrofit bulk-cargo processes for consumer-level deliveries.
Infrastructure Megaprojects (Toll Roads, Ports, Airports)
The National Strategic Projects program channels USD 400 billion into roads, ports, and airports, slicing transit times between Java's industrial hubs by as much as 40%. Over 2,700 km of new tollways integrate inland factories with main ports, while INAPORTNET port digitalization shaves customs dwell times. Makassar Port's elevation to major-hub status creates new eastern export corridors that dilute Java congestion. Enhanced connectivity allows freight forwarders to redesign multimodal routes, lowering inventory buffers and facilitating cold-chain expansion into fisheries regions. Benefits accrue gradually as supporting hinterland rail spurs and industrial estates come online, but early adopters already re-optimize warehouse footprints around improved linehaul reliability.
Severe Urban Congestion and Last-Mile Bottlenecks
Jakarta's average peak-hour speed hovers at 10-15 km/h, inflating last-mile fees that can reach 50% of delivery cost. CEP providers deploy night deliveries, micro-depots, and motorcycle couriers to sidestep gridlock, yet these workarounds add labor complexity. Temperature-sensitive goods risk spoilage when idling in traffic, pushing shippers toward premium guaranteed-time services. Government measures such as odd-even license plate schemes offer marginal relief for commercial trucks that lack schedule flexibility. As e-commerce parcel volumes rise, congestion costs are expected to intensify unless city logistics zoning and off-street loading regulations evolve.
Other drivers and restraints analyzed in the detailed report include:
- Manufacturing-Export Rebound (Autos, Electronics, Textiles)
- Rising Domestic Consumption and Middle-Class Spending
- Fragmented Regulations and Overlapping Licenses
For complete list of drivers and restraints, kindly check the Table Of Contents.
Segment Analysis
Manufacturing generated 28.45% of Indonesia freight and logistics market demand in 2025, driven by automotive, electronics, and textiles. High export orientation demands bonded logistics centers and just-in-time deliveries to ports and airports. Wholesale and Retail Trade, however, expands at a 6.64% CAGR (2026-2031) as middle-class consumption proliferates, forcing logistics firms to design multi-node distribution architectures. Agriculture, Fishing, and Forestry maintain steady volumes tied to commodity exports, while Construction logistics climb with infrastructure capex.
Wholesale and Retail Trade clients increasingly stipulate same-day or next-day delivery for nationwide orders, escalating the need for regional fulfillment centers and robust line-haul linkages. Manufacturing shippers adopt circular-economy objectives, adding reverse-logistics flows for returns and recycling, further diversifying service portfolios within the Indonesia freight and logistics industry.
Freight Transport contributed a 58.95% share to the Indonesia freight and logistics market in 2025. CEP, though smaller, posts a 7.12% CAGR (2026-2031) on the back of rising B2C shipments, overtaking other functions in growth velocity. Freight Forwarding remains indispensable for multimodal coordination, especially on sea-road chains linking industrial estates to export ports. Warehousing and Storage revenue scales steadily as firms adopt inventory-as-a-service models to support omnichannel fulfillment. Other Services, such as customs brokerage and supply-chain consulting, benefit from regulatory complexity and trade digitalization.
CEP's surge stems from 15% annual e-commerce transaction growth, necessitating dense delivery networks and high sortation throughput. Automated hubs reduce cost-per-package and enable same-day delivery promises. Freight Transport operators invest in parcel lockers and collaboration with ride-hailing fleets to retain relevance. Meanwhile, warehouse operators retrofit cross-dock areas for parcel flow, underscoring functional convergence within the Indonesia freight and logistics market.
The Indonesia Freight and Logistics Market Report is Segmented by End User Industry (Agriculture, Fishing, and Forestry, Construction, Manufacturing, Oil and Gas, Mining and Quarrying, Wholesale and Retail Trade, and Others), Logistics Function (Courier, Express, and Parcel (CEP), Freight Forwarding, Freight Transport, Warehousing and Storage, and Other Services). The Market Forecasts are Provided in Terms of Value (USD).
List of Companies Covered in this Report:
- DHL Group
- DSV A/S (Including DB Schenker)
- Expeditors International of Washington, Inc.
- FedEx
- J&T Express
- Kuehne+Nagel
- Linfox Pty Ltd.
- LOGWIN
- Ninja Van (Including Ninja Express)
- NYK (Nippon Yusen Kaisha) Line
- Pancaran Group
- PT ABM Investama TBK (including CKB Logistics)
- PT Bina Sinar Amity (BSA Logistics Indonesia)
- PT Cardig International
- PT Citrabati Logistik International
- PT Dunia Express Transindo
- PT Jalur Nugraha Ekakurir (JNE Express)
- PT Kamadjaja Logistics
- PT Lautan Luas TBK
- PT Pandu Siwi Group (Pandu Logistics)
- PT Perusahaan Perdagangan Indonesia (including BGR Indonesia)
- PT Pos Indonesia (Persero)
- PT Repex Wahana (RPX)
- PT Samudera Indonesia Tangguh
- PT Satria Antaran Prima TBK (SAPX Express)
- PT Siba Surya
- PT Soechi Lines Tbk
- Puninar Logistics
- SF Express (KEX-SF)
- Sinotrans, Ltd.
- United Parcel Service of America, Inc. (UPS)
Additional Benefits:
- The market estimate (ME) sheet in Excel format
- 3 months of analyst support
TABLE OF CONTENTS
1 Introduction
- 1.1 Study Assumptions and Market Definition
- 1.2 Scope of the Study
2 Research Methodology
3 Executive Summary
4 Market Landscape
- 4.1 Market Overview
- 4.2 Demographics
- 4.3 GDP Distribution by Economic Activity
- 4.4 GDP Growth by Economic Activity
- 4.5 Inflation
- 4.6 Economic Performance and Profile
- 4.6.1 Trends in E-Commerce Industry
- 4.6.2 Trends in Manufacturing Industry
- 4.7 Transport and Storage Sector GDP
- 4.8 Export Trends
- 4.9 Import Trends
- 4.10 Fuel Price
- 4.11 Trucking Operational Costs
- 4.12 Trucking Fleet Size By Type
- 4.13 Major Truck Suppliers
- 4.14 Logistics Performance
- 4.15 Modal Share
- 4.16 Maritime Fleet Load Carrying Capacity
- 4.17 Liner Shipping Connectivity
- 4.18 Port Calls And Performance
- 4.19 Freight Pricing Trends
- 4.20 Freight Tonnage Trends
- 4.21 Infrastructure
- 4.22 Regulatory Framework (Road and Rail)
- 4.23 Regulatory Framework (Sea and Air)
- 4.24 Value Chain and Distribution Channel Analysis
- 4.25 Market Drivers
- 4.25.1 E-Commerce Boom and Parcel-Volume Surge
- 4.25.2 Infrastructure Megaprojects (Toll Roads, Ports, Airports)
- 4.25.3 Manufacturing-Export Rebound (Autos, Electronics, Textiles)
- 4.25.4 Rising Domestic Consumption and Middle-Class Spending
- 4.25.5 National Logistics Ecosystem (NLE) Digital Platform Rollout
- 4.25.6 Cold-Chain Demand from Aquaculture and Seafood Exports
- 4.26 Market Restraints
- 4.26.1 Severe Urban Congestion and Last-Mile Bottlenecks
- 4.26.2 Fragmented Regulations and Overlapping Licenses
- 4.26.3 High Fuel-Price Volatility
- 4.26.4 Shortage of Logistics-Tech Talent
- 4.27 Technology Innovations in the Market
- 4.28 Porter's Five Forces Analysis
- 4.28.1 Threat of New Entrants
- 4.28.2 Bargaining Power of Buyers
- 4.28.3 Bargaining Power of Suppliers
- 4.28.4 Threat of Substitutes
- 4.28.5 Competitive Rivalry
5 Market Size and Growth Forecasts (Value, USD)
- 5.1 End User Industry
- 5.1.1 Agriculture, Fishing, and Forestry
- 5.1.2 Construction
- 5.1.3 Manufacturing
- 5.1.4 Oil and Gas, Mining and Quarrying
- 5.1.5 Wholesale and Retail Trade
- 5.1.6 Others
- 5.2 Logistics Function
- 5.2.1 Courier, Express, and Parcel (CEP)
- 5.2.1.1 By Destination Type
- 5.2.1.1.1 Domestic
- 5.2.1.1.2 International
- 5.2.1.1 By Destination Type
- 5.2.2 Freight Forwarding
- 5.2.2.1 By Mode of Transport
- 5.2.2.1.1 Air
- 5.2.2.1.2 Sea and Inland Waterways
- 5.2.2.1.3 Others
- 5.2.2.1 By Mode of Transport
- 5.2.3 Freight Transport
- 5.2.3.1 By Mode of Transport
- 5.2.3.1.1 Air
- 5.2.3.1.2 Pipelines
- 5.2.3.1.3 Rail
- 5.2.3.1.4 Road
- 5.2.3.1.5 Sea and Inland Waterways
- 5.2.3.1 By Mode of Transport
- 5.2.4 Warehousing and Storage
- 5.2.4.1 By Temperature Control
- 5.2.4.1.1 Non-Temperature Controlled
- 5.2.4.1.2 Temperature Controlled
- 5.2.4.1 By Temperature Control
- 5.2.5 Other Services
- 5.2.1 Courier, Express, and Parcel (CEP)
6 Competitive Landscape
- 6.1 Market Concentration
- 6.2 Key Strategic Moves
- 6.3 Market Share Analysis
- 6.4 Company Profiles (Includes Global Level Overview, Market Level Overview, Core Segments, Financials as Available, Strategic Information, Market Rank/Share for Key Companies, Products and Services, and Recent Developments)
- 6.4.1 DHL Group
- 6.4.2 DSV A/S (Including DB Schenker)
- 6.4.3 Expeditors International of Washington, Inc.
- 6.4.4 FedEx
- 6.4.5 J&T Express
- 6.4.6 Kuehne+Nagel
- 6.4.7 Linfox Pty Ltd.
- 6.4.8 LOGWIN
- 6.4.9 Ninja Van (Including Ninja Express)
- 6.4.10 NYK (Nippon Yusen Kaisha) Line
- 6.4.11 Pancaran Group
- 6.4.12 PT ABM Investama TBK (including CKB Logistics)
- 6.4.13 PT Bina Sinar Amity (BSA Logistics Indonesia)
- 6.4.14 PT Cardig International
- 6.4.15 PT Citrabati Logistik International
- 6.4.16 PT Dunia Express Transindo
- 6.4.17 PT Jalur Nugraha Ekakurir (JNE Express)
- 6.4.18 PT Kamadjaja Logistics
- 6.4.19 PT Lautan Luas TBK
- 6.4.20 PT Pandu Siwi Group (Pandu Logistics)
- 6.4.21 PT Perusahaan Perdagangan Indonesia (including BGR Indonesia)
- 6.4.22 PT Pos Indonesia (Persero)
- 6.4.23 PT Repex Wahana (RPX)
- 6.4.24 PT Samudera Indonesia Tangguh
- 6.4.25 PT Satria Antaran Prima TBK (SAPX Express)
- 6.4.26 PT Siba Surya
- 6.4.27 PT Soechi Lines Tbk
- 6.4.28 Puninar Logistics
- 6.4.29 SF Express (KEX-SF)
- 6.4.30 Sinotrans, Ltd.
- 6.4.31 United Parcel Service of America, Inc. (UPS)
7 Market Opportunities and Future Outlook
- 7.1 White-space and Unmet-Need Assessment
 貨運及物流市場分析及預測(至2035年):依類型、產品類型、服務、技術、組件、應用、流程、最終使用者及運輸方式分類
 2026-2030年全球貨物審核與支付市場
 中東歐貨運與物流:市場佔有率分析、產業趨勢與統計、成長預測(2026-2031 年)亞太地區貨運與物流:市場佔有率分析、產業趨勢與統計、成長預測(2026-2031)南美貨運與物流:市場佔有率分析、產業趨勢與統計、成長預測(2026-2031)東協貨運與物流:市場佔有率分析、產業趨勢與統計、成長預測(2026-2031)泰國貨運與物流:市場佔有率分析、產業趨勢與統計、成長預測(2026-2031)美國貨運和物流:市場佔有率分析、行業趨勢和統計數據、成長預測(2026-2031 年)英國貨運與物流:市場佔有率分析、產業趨勢與統計、成長預測(2026-2031)西班牙貨運與物流:市場佔有率分析、產業趨勢與統計、成長預測(2026-2031)