

 |
市場調查報告書
商品編碼
1906859
北美貨運與物流:市場佔有率分析、產業趨勢與統計、成長預測(2026-2031)North America Freight And Logistics - Market Share Analysis, Industry Trends & Statistics, Growth Forecasts (2026 - 2031) |
||||||
※ 本網頁內容可能與最新版本有所差異。詳細情況請與我們聯繫。
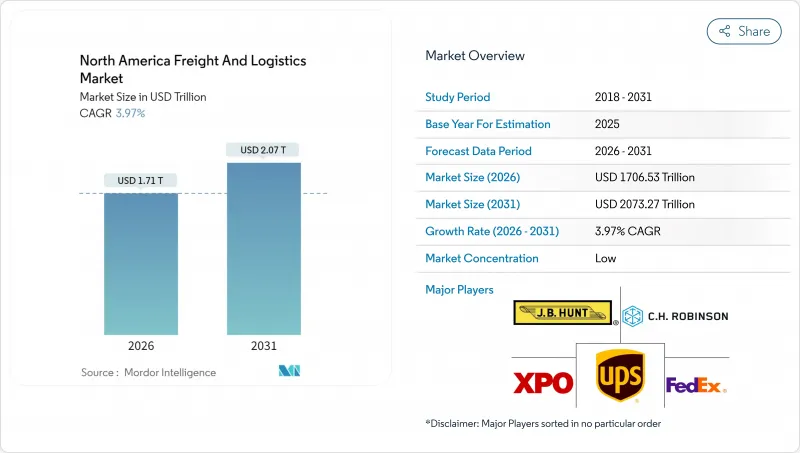
2025年北美貨運和物流市場價值為16413.7億美元,預計到2031年將達到20732.7億美元,2026年為17065.3億美元。
預計在預測期(2026-2031 年)內,複合年成長率將達到 3.97%。
透過《美國-墨西哥-加拿大協定》(USMCA)加強貿易一體化、電子商務小包裹量快速成長以及聯邦政府資助的基礎設施現代化計劃,鞏固了該走廊的戰略重要性並促進了投資流動。預計到2024年,跨境貿易將達到創紀錄水平,其中加美國貿易額將達7,800億美元,美國墨貿易額將達8,078億美元。加速向墨西哥的近岸外包,加上美國1,100億美元的交通運輸資金投入,正在推動貨運走廊的重組和技術主導的效率提升。同時,勞動力短缺和網路安全威脅正在限制運力,推動自動化應用並增加對彈性網路的需求。在此背景下,儘管短期內面臨營運方面的挑戰,但預計在技術創新的驅動下,北美貨運和物流市場將保持穩定成長。
北美貨運及物流市場趨勢及洞察
電子商務小包裹量加速成長推動了最後一公里配送創新
2024年第二季度,電子商務滲透率達到零售總額的15.6%,每年產生超過240億個小包裹,超過了傳統「最後一公里」運輸能力。為了應對這項挑戰,企業透過在都市區建立微型倉配中心、試點自動駕駛貨車以及利用零工經濟快遞員等方式,提高了應對尖峰時段(佔全年貨運量的40%)的靈活性。當日達和隔天達的前景正在催生一個價值120億美元的城市物流房地產市場,亞馬遜在2024年開設150個新的配送站便是最好的例證。美國和加拿大的監管機構已批准了有限的無人機飛行走廊,顯示了對替代運輸方式的製度支持。隨著小包裹密度的增加(與2022年相比成長了35%)加劇了道路堵塞,承運商正在嘗試集中式配送模式,以減少車輛停留時間和排放氣體。
美墨加協定貿易整合將重塑跨境物流網路
美墨加協定(USMCA)將推動三邊貿易額在2024年達到1.6兆美元,貨運量年增8.2%。拉雷多和底特律等邊境口岸的自動化清關平台可將清關時間縮短高達30%,而墨西哥4,550億美元的出口額也對高價值零件提出了複雜的逆向物流需求。加拿大太平洋鐵路公司和堪薩斯城鐵路公司於2024年合併,開通了加拿大港口與墨西哥工業區之間的首條直達單線鐵路服務,縮短了運輸時間,並最大限度地減少了貨物中轉次數。完善的數位化貿易法規實現了貨物即時追蹤,並將高流量邊境地區的停留時間縮短至約90分鐘。邊境兩側對低溫運輸和汽車物流中心的投資凸顯了北美貨運和物流市場的戰略深度。
勞動力短缺限制了營運能力
截至2024年,北美地區仍有超過8萬個商業司機職位和60萬個倉庫職位空缺,在南加州和德克薩斯三角區等熱點地區,離職率超過75%。隨著運輸公司競相爭取人才,總薪資上漲了15%至20%,但勞動力的平均年齡已超過47歲,引發了人們對長期產能的擔憂。 2024年,自動化投資達48億美元,各公司正在部署機器人分類系統和自動駕駛場內卡車。儘管聯邦政府允許年輕司機跨州運輸貨物,但勞動力短缺問題在2026年之前不太可能顯著緩解。
細分市場分析
製造業28.95%的佔有率反映了對準時制流程和複雜退貨流程的根深蒂固的需求。半導體、電動車和醫療設備製造商推動了對受控環境和安全運輸的需求。即使近岸外包持續成長,製造商仍在尋求能夠整合生產和運輸節點並減少緩衝庫存的端到端可視性工具。
在全通路普及的推動下,批發和零售業預計將成為成長最快的產業,年複合成長率(CAGR)將達到4.21%(2026-2031年)。零售商正在分散庫存,並將門市和線上庫存整合,以縮短交貨時間。對溫控食品物流日益成長的需求,推動了北美貨運和物流市場低溫運輸投資的進一步擴張。隨著逆向物流量的成長,能夠快速分類、轉售或回收退貨的承運商將獲得更大的市場佔有率。
到2025年,貨運將佔北美貨運收入的62.58%,再次鞏固其在北美貨運和物流市場的核心地位。儘管道路運輸仍佔據主導地位,但隨著托運人優先考慮成本和永續性,鐵路貨櫃運輸的佔有率正在逐步提升。在這一領域,利用遠端資訊處理技術的預測性維護正在減少非計劃性停機時間,並提高交付時間的準確性。自動化試點計畫正擴展到長途編隊行駛和場內作業的機器人技術,預示著未來十年有人駕駛和無人駕駛資產將逐步融合。
儘管快速配送服務規模目前較小,但由於電子商務的成長,預計2026年至2031年間將以4.4%的複合年成長率成長。密集的都市區網路和演算法路線最佳化使得75%的美國家庭能夠享受當日送達服務。小包裹遞送公司正在試行動態定價機制,以根據即時需求調整運力。這些趨勢表明,首末端配送領域的創新將決定北美貨運和物流市場的競爭優勢。
其他福利:
- Excel格式的市場預測(ME)表
- 3個月的分析師支持
目錄
第1章 引言
- 研究假設和市場定義
- 調查範圍
第2章調查方法
第3章執行摘要
第4章 市場情勢
- 市場概覽
- 人口統計數據
- 按經濟活動分類的GDP分配
- 按經濟活動分類的GDP成長
- 通貨膨脹
- 經濟表現及概況
- 電子商務產業的趨勢
- 製造業趨勢
- 運輸和倉儲業GDP
- 出口趨勢
- 進口趨勢
- 燃油價格
- 卡車運輸營運成本
- 卡車運輸車隊規模(按類型)
- 主要卡車供應商
- 物流績效
- 透過交通方式分享
- 海運船隊運力
- 班輪運輸連接
- 停靠港口和演出
- 貨運費率趨勢
- 貨物噸位趨勢
- 基礎設施
- 法律規範(公路和鐵路)
- 加拿大
- 墨西哥
- 美國
- 法規結構(海事和航空)
- 加拿大
- 墨西哥
- 美國
- 價值鍊和通路分析
- 市場促進因素
- 加速電子商務小包裹量
- 透過美國墨加協定(USMCA)實現跨境貿易一體化
- 來自《美國基礎設施投資和就業創造法案》的資金籌措
- 製造地近岸外包到墨西哥
- 數位貨運市場和API連接
- 溫控(低溫運輸)物流的擴張
- 市場限制
- 駕駛人和倉庫工人短缺
- 港口擁擠及鐵路運力瓶頸
- 卡車運輸業保險費上漲
- 連網車輛的網路安全漏洞
- 市場創新
- 波特五力分析
- 新進入者的威脅
- 買方的議價能力
- 供應商的議價能力
- 替代品的威脅
- 競爭對手之間的競爭
第5章 市場規模與成長預測
- 終端用戶產業
- 農業、漁業、林業
- 建造
- 製造業
- 石油天然氣、採礦和採石
- 批發和零售
- 其他
- 物流職能
- 宅配、速遞和小包裹(CEP)
- 按目的地類型
- 國內的
- 國際的
- 按目的地類型
- 貨運代理
- 透過交通工具
- 航空
- 海路和內河航道
- 其他
- 透過交通工具
- 貨物運輸
- 透過交通工具
- 航空
- 管道
- 鐵路
- 路
- 海路和內河航道
- 透過交通工具
- 倉儲和存儲
- 透過溫度控制
- 非溫控型
- 溫度控制
- 透過溫度控制
- 其他服務
- 宅配、速遞和小包裹(CEP)
- 國家
- 加拿大
- 墨西哥
- 美國
- 北美其他地區
第6章 競爭情勢
- 市場集中度
- 關鍵策略舉措
- 市佔率分析
- 公司簡介
- AP Moller-Maersk
- AIT Worldwide Logistics
- Americold
- ArcBest
- Arrive Logistics
- Ascent Global Logistics
- Berkshire Hathaway Inc.(Including BNSF Railway Company)
- Brookfield Infrastructure Partners LP(Including Genesee & Wyoming Inc.)
- Burris Logistics
- CH Robinson
- Canada Post Corporation(Including Purolator)
- Canadian National Railway
- Canadian Pacific Railway
- Capstone Logistics LLC
- Congebec
- CSX Corporation
- DHL Group
- DSV A/S(Including DB Schenker)
- Excel Group
- Expeditors International of Washington, Inc.
- Fastfrate Inc.
- FedEx
- Fomento Economico Mexicano, SAB de CV
- GEODIS
- Grupo Mexico
- GXO Logistics, Inc.
- Hub Group Inc.
- JB Hunt Transport, Inc.
- Knight-Swift Transportation Holdings, Inc.
- Kuehne+Nagel
- Landstar System, Inc.
- Lineage, Inc.
- M3 Transport
- Mactrans Logistics
- MODE Global LLC
- NFI Industries
- Nippon Express Holdings
- Norfolk Southern Railway
- Old Dominion Freight Line
- Omni Logistics
- OnTrac
- Patriot Rail Company
- Penske Corporation(including Penske Logistics)
- Polaris Worldwide Logistics
- Ryder System, Inc.
- Schneider National, Inc.
- SF Express(KEX-SF)
- TFI International Inc.
- Total Quality Logistics, LLC
- Transportation Insight Holding
- Traxion
- Uber Technologies Inc.
- Union Pacific Railroad
- United Parcel Service of America, Inc.(UPS)
- Werner Enterprises, Inc.
- XPO, Inc.
第7章 市場機會與未來展望
The North America freight and logistics market was valued at USD 1641.37 billion in 2025 and estimated to grow from USD 1706.53 billion in 2026 to reach USD 2073.27 billion by 2031, at a CAGR of 3.97% during the forecast period (2026-2031).
Robust USMCA-driven trade integration, surging e-commerce parcel volumes, and federally funded infrastructure modernization projects are reinforcing the strategic importance of the corridor and underpinning investment flows. Cross-border trade reached record levels in 2024, with Canada-U.S. commerce hitting USD 780 billion and Mexico-U.S. flows touching USD 807.8 billion. Accelerated near-shoring to Mexico, complemented by USD 110 billion in U.S. transportation funding, is reshaping freight corridors and injecting technology-led efficiencies. At the same time, labor shortages and cybersecurity threats are constraining capacity, spurring automation adoption, and heightening the need for resilient networks. Against this backdrop, the North America freight and logistics market is poised for steady, technology-enabled growth despite short-term operational headwinds.
North America Freight And Logistics Market Trends and Insights
Accelerated E-Commerce Parcel Volumes Drive Last-Mile Innovation
E-commerce penetration reached 15.6% of retail sales in Q2 2024, generating more than 24 billion parcels annually and outstripping legacy last-mile capacity. Operators responded by deploying micro-fulfillment hubs within city limits, piloting autonomous delivery vans and tapping gig-economy couriers to flex capacity during peak periods that now account for 40% of yearly throughput. Same-day and next-day expectations have unlocked a USD 12 billion urban logistics real-estate opportunity, evidenced by the 150 new delivery stations Amazon opened in 2024. Regulators in both the United States and Canada have cleared limited drone corridors, signaling institutional backing for alternative modes. Higher parcel density-up 35% since 2022-has intensified curbside congestion, prompting carriers to test consolidated drop-off models that lower vehicle dwell times and emissions.
USMCA Trade Integration Reshapes Cross-Border Logistics Networks
USMCA enabled USD 1.6 trillion in trilateral trade during 2024, with freight flows rising 8.2% year over year. Automated customs platforms now trim clearance times by up to 30% at crossings such as Laredo and Detroit, while Mexican exports of USD 455 billion are generating complex reverse-logistics needs for high-value components. The 2024 Canadian Pacific Kansas City rail merger established the first single-line service that links Canadian ports directly to Mexican industrial zones, compressing transit times and minimizing handoffs. Enhanced digital trade provisions support real-time cargo tracking, further reducing border dwell times to roughly 90 minutes at high-volume lanes. Investments in cold-chain and automotive logistics centers on both sides of the border highlight the strategic depth of the North America freight and logistics market.
Labor Shortages Constrain Operational Capacity
More than 80,000 commercial driving positions and 600,000 warehouse roles remained unfilled across North America in 2024, with churn surpassing 75% in hot spots such as Southern California and the Texas Triangle. Wage bills climbed 15-20% as carriers competed for talent, yet the workforce median age crept past 47 years, threatening long-term capacity. Automation spend reached USD 4.8 billion in 2024 as firms implemented robotic sortation and autonomous yard trucks. Federal waivers allowing younger drivers to haul interstate freight are in place, but meaningful labor relief is unlikely before 2026.
Other drivers and restraints analyzed in the detailed report include:
- Infrastructure Investment Modernizes Freight Corridors
- Near-shoring Manufacturing Transforms Mexico's Logistics Landscape
- Infrastructure Bottlenecks Limit Growth Potential
For complete list of drivers and restraints, kindly check the Table Of Contents.
Segment Analysis
Manufacturing's 28.95% share signals entrenched just-in-time practices and complex returns flows. Semiconductor, electric-vehicle and medical-device producers are driving requirements for controlled environments and secured transport. Even amid near-shoring, manufacturers are demanding end-to-end visibility tools that integrate production milestones with freight milestones, shrinking buffer inventories.
Wholesale and retail trade, propelled by omnichannel fulfillment, is the fastest mover at a 4.21% CAGR (2026-2031). Retailers are decentralizing inventory into micro-fulfillment sites to cut delivery times while blending store and online stock pools. Temperature-controlled grocery logistics are seeing heightened interest, supporting further cold-chain investment in the North America freight and logistics market. As reverse-logistics volumes rise, carriers that can quickly triage returns for resale or recycling will gain share.
Freight Transport controlled 62.58% of revenue in 2025, reaffirming its backbone role within the North America freight and logistics market. Road haulage dominates this function, yet rail intermodal share is creeping upward as shippers prioritize cost and sustainability. The segment is leveraging telematics for predictive maintenance, trimming unplanned downtime, and tightening delivery windows. Automation pilots now span long-haul platooning and yard-hostler robotics, pointing to a gradual blend of manned and autonomous assets through the decade.
CEP services, while smaller, are expanding at a 4.4% CAGR (2026-2031) thanks to e-commerce. Same-day coverage is now feasible for 75% of U.S. households, underpinned by dense urban networks and algorithmic route optimization. Parcel carriers are experimenting with dynamic pricing engines that match capacity to real-time demand. Combined, these dynamics reinforce that innovation in first- and last-mile delivery will shape competitive positioning across the broader North America freight and logistics market.
The North America Freight and Logistics Market Report is Segmented by Logistics Function (Courier, Express, and Parcel, Freight Forwarding, Freight Transport, Warehousing and Storage, and Other Services), End User Industry (Agriculture, Fishing, and Forestry, Construction, Manufacturing, Wholesale and Retail Trade, and More), and Geography (United States, Canada, and More). The Market Forecasts are Provided in Terms of Value (USD).
List of Companies Covered in this Report:
- A.P. Moller-Maersk
- AIT Worldwide Logistics
- Americold
- ArcBest
- Arrive Logistics
- Ascent Global Logistics
- Berkshire Hathaway Inc. (Including BNSF Railway Company)
- Brookfield Infrastructure Partners L.P. (Including Genesee & Wyoming Inc.)
- Burris Logistics
- C.H. Robinson
- Canada Post Corporation (Including Purolator)
- Canadian National Railway
- Canadian Pacific Railway
- Capstone Logistics LLC
- Congebec
- CSX Corporation
- DHL Group
- DSV A/S (Including DB Schenker)
- Excel Group
- Expeditors International of Washington, Inc.
- Fastfrate Inc.
- FedEx
- Fomento Economico Mexicano, S.A.B. de C.V.
- GEODIS
- Grupo Mexico
- GXO Logistics, Inc.
- Hub Group Inc.
- J.B. Hunt Transport, Inc.
- Knight-Swift Transportation Holdings, Inc.
- Kuehne+Nagel
- Landstar System, Inc.
- Lineage, Inc.
- M3 Transport
- Mactrans Logistics
- MODE Global LLC
- NFI Industries
- Nippon Express Holdings
- Norfolk Southern Railway
- Old Dominion Freight Line
- Omni Logistics
- OnTrac
- Patriot Rail Company
- Penske Corporation (including Penske Logistics)
- Polaris Worldwide Logistics
- Ryder System, Inc.
- Schneider National, Inc.
- SF Express (KEX-SF)
- TFI International Inc.
- Total Quality Logistics, LLC
- Transportation Insight Holding
- Traxion
- Uber Technologies Inc.
- Union Pacific Railroad
- United Parcel Service of America, Inc. (UPS)
- Werner Enterprises, Inc.
- XPO, Inc.
Additional Benefits:
- The market estimate (ME) sheet in Excel format
- 3 months of analyst support
TABLE OF CONTENTS
1 Introduction
- 1.1 Study Assumptions and Market Definition
- 1.2 Scope of the Study
2 Research Methodology
3 Executive Summary
4 Market Landscape
- 4.1 Market Overview
- 4.2 Demographics
- 4.3 GDP Distribution by Economic Activity
- 4.4 GDP Growth by Economic Activity
- 4.5 Inflation
- 4.6 Economic Performance and Profile
- 4.6.1 Trends in E-Commerce Industry
- 4.6.2 Trends in Manufacturing Industry
- 4.7 Transport and Storage Sector GDP
- 4.8 Export Trends
- 4.9 Import Trends
- 4.10 Fuel Price
- 4.11 Trucking Operational Costs
- 4.12 Trucking Fleet Size by Type
- 4.13 Major Truck Suppliers
- 4.14 Logistics Performance
- 4.15 Modal Share
- 4.16 Maritime Fleet Load Carrying Capacity
- 4.17 Liner Shipping Connectivity
- 4.18 Port Calls and Performance
- 4.19 Freight Pricing Trends
- 4.20 Freight Tonnage Trends
- 4.21 Infrastructure
- 4.22 Regulatory Framework (Road and Rail)
- 4.22.1 Canada
- 4.22.2 Mexico
- 4.22.3 United States
- 4.23 Regulatory Framework (Sea and Air)
- 4.23.1 Canada
- 4.23.2 Mexico
- 4.23.3 United States
- 4.24 Value Chain and Distribution Channel Analysis
- 4.25 Market Drivers
- 4.25.1 Accelerated E-Commerce Parcel Volumes
- 4.25.2 USMCA-Driven Cross-Border Trade Integration
- 4.25.3 U.S. Infrastructure Investment and Jobs Act Funding
- 4.25.4 Near-Shoring of Manufacturing to Mexico
- 4.25.5 Digital Freight Marketplaces and API Connectivity
- 4.25.6 Expansion of Temperature-Controlled (Cold-Chain) Logistics
- 4.26 Market Restraints
- 4.26.1 Driver and Warehouse Labor Shortages
- 4.26.2 Port Congestion and Rail Capacity Bottlenecks
- 4.26.3 Rising Trucking-Sector Insurance Premiums
- 4.26.4 Cyber-Security Vulnerabilities in Connected Fleets
- 4.27 Technology Innovations in the Market
- 4.28 Porter's Five Forces Analysis
- 4.28.1 Threat of New Entrants
- 4.28.2 Bargaining Power of Buyers
- 4.28.3 Bargaining Power of Suppliers
- 4.28.4 Threat of Substitutes
- 4.28.5 Competitive Rivalry
5 Market Size and Growth Forecasts (Value, USD)
- 5.1 End User Industry
- 5.1.1 Agriculture, Fishing, and Forestry
- 5.1.2 Construction
- 5.1.3 Manufacturing
- 5.1.4 Oil and Gas, Mining and Quarrying
- 5.1.5 Wholesale and Retail Trade
- 5.1.6 Others
- 5.2 Logistics Function
- 5.2.1 Courier, Express, and Parcel (CEP)
- 5.2.1.1 By Destination Type
- 5.2.1.1.1 Domestic
- 5.2.1.1.2 International
- 5.2.1.1 By Destination Type
- 5.2.2 Freight Forwarding
- 5.2.2.1 By Mode of Transport
- 5.2.2.1.1 Air
- 5.2.2.1.2 Sea and Inland Waterways
- 5.2.2.1.3 Others
- 5.2.2.1 By Mode of Transport
- 5.2.3 Freight Transport
- 5.2.3.1 By Mode of Transport
- 5.2.3.1.1 Air
- 5.2.3.1.2 Pipelines
- 5.2.3.1.3 Rail
- 5.2.3.1.4 Road
- 5.2.3.1.5 Sea and Inland Waterways
- 5.2.3.1 By Mode of Transport
- 5.2.4 Warehousing and Storage
- 5.2.4.1 By Temperature Control
- 5.2.4.1.1 Non-Temperature-Controlled
- 5.2.4.1.2 Temperature-Controlled
- 5.2.4.1 By Temperature Control
- 5.2.5 Other Services
- 5.2.1 Courier, Express, and Parcel (CEP)
- 5.3 Country
- 5.3.1 Canada
- 5.3.2 Mexico
- 5.3.3 United States
- 5.3.4 Rest of North America
6 Competitive Landscape
- 6.1 Market Concentration
- 6.2 Key Strategic Moves
- 6.3 Market Share Analysis
- 6.4 Company Profiles (Includes Global Level Overview, Market Level Overview, Core Segments, Financials as Available, Strategic Information, Market Rank/Share for Key Companies, Products and Services, and Recent Developments)
- 6.4.1 A.P. Moller-Maersk
- 6.4.2 AIT Worldwide Logistics
- 6.4.3 Americold
- 6.4.4 ArcBest
- 6.4.5 Arrive Logistics
- 6.4.6 Ascent Global Logistics
- 6.4.7 Berkshire Hathaway Inc. (Including BNSF Railway Company)
- 6.4.8 Brookfield Infrastructure Partners L.P. (Including Genesee & Wyoming Inc.)
- 6.4.9 Burris Logistics
- 6.4.10 C.H. Robinson
- 6.4.11 Canada Post Corporation (Including Purolator)
- 6.4.12 Canadian National Railway
- 6.4.13 Canadian Pacific Railway
- 6.4.14 Capstone Logistics LLC
- 6.4.15 Congebec
- 6.4.16 CSX Corporation
- 6.4.17 DHL Group
- 6.4.18 DSV A/S (Including DB Schenker)
- 6.4.19 Excel Group
- 6.4.20 Expeditors International of Washington, Inc.
- 6.4.21 Fastfrate Inc.
- 6.4.22 FedEx
- 6.4.23 Fomento Economico Mexicano, S.A.B. de C.V.
- 6.4.24 GEODIS
- 6.4.25 Grupo Mexico
- 6.4.26 GXO Logistics, Inc.
- 6.4.27 Hub Group Inc.
- 6.4.28 J.B. Hunt Transport, Inc.
- 6.4.29 Knight-Swift Transportation Holdings, Inc.
- 6.4.30 Kuehne+Nagel
- 6.4.31 Landstar System, Inc.
- 6.4.32 Lineage, Inc.
- 6.4.33 M3 Transport
- 6.4.34 Mactrans Logistics
- 6.4.35 MODE Global LLC
- 6.4.36 NFI Industries
- 6.4.37 Nippon Express Holdings
- 6.4.38 Norfolk Southern Railway
- 6.4.39 Old Dominion Freight Line
- 6.4.40 Omni Logistics
- 6.4.41 OnTrac
- 6.4.42 Patriot Rail Company
- 6.4.43 Penske Corporation (including Penske Logistics)
- 6.4.44 Polaris Worldwide Logistics
- 6.4.45 Ryder System, Inc.
- 6.4.46 Schneider National, Inc.
- 6.4.47 SF Express (KEX-SF)
- 6.4.48 TFI International Inc.
- 6.4.49 Total Quality Logistics, LLC
- 6.4.50 Transportation Insight Holding
- 6.4.51 Traxion
- 6.4.52 Uber Technologies Inc.
- 6.4.53 Union Pacific Railroad
- 6.4.54 United Parcel Service of America, Inc. (UPS)
- 6.4.55 Werner Enterprises, Inc.
- 6.4.56 XPO, Inc.
7 Market Opportunities and Future Outlook
- 7.1 White-space and Unmet-Need Assessment
 中東和非洲貨運物流市場:市場佔有率分析、行業趨勢、統計數據和成長預測(2026-2031 年)
 日本貨運物流市場規模、佔有率、趨勢及預測(按類型、最終用戶及地區分類),2026-2034年
 貨運和物流市場規模、佔有率和成長分析(按運輸方式、服務、最終用戶和地區分類)-2025-2032年產業預測中東歐貨運與物流:市場佔有率分析、產業趨勢、統計數據與成長預測(2025-2030 年)新加坡貨運與物流:市場佔有率分析、行業趨勢、統計數據和成長預測(2025-2030 年)菲律賓貨運與物流:市場佔有率分析、行業趨勢、統計數據和成長預測(2025-2030 年)
 全球貨物審核與結算市場預測(2025-2030)
 2032 年碳中和解決方案市場預測:按類型、組件、部署模式、組織規模、技術、最終用戶和地區進行的全球分析
 2025年貨運和物流全球市場報告
 貨運審核與結算市場規模、佔有率及成長分析(依公司規模、最終用戶、應用及地區)-2025 年至 2032 年產業預測