


 |
市場調查報告書
商品編碼
1907263
歐洲貨運與物流:市場佔有率分析、行業趨勢、統計數據和成長預測(2026-2031 年)Europe Freight And Logistics - Market Share Analysis, Industry Trends & Statistics, Growth Forecasts (2026 - 2031) |
||||||
※ 本網頁內容可能與最新版本有所差異。詳細情況請與我們聯繫。
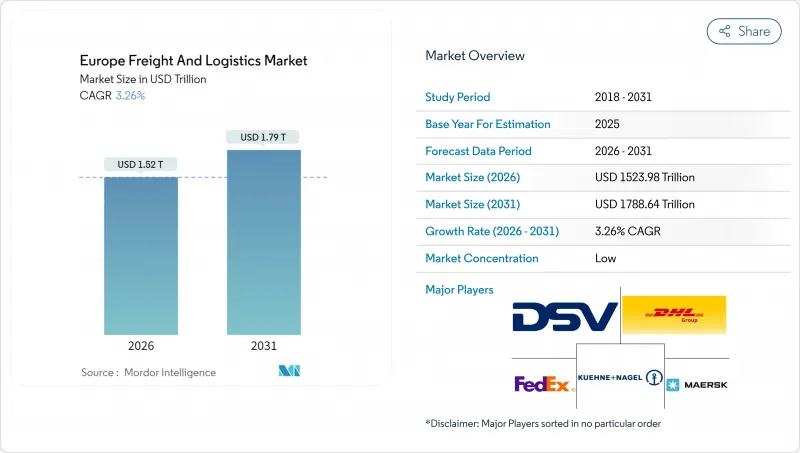
2025年歐洲貨運和物流市場價值為14758.8億美元,預計到2031年將達到17886.4億美元,2026年為15239.8億美元。
預計在預測期(2026-2031 年)內,複合年成長率將達到 3.26%。
這一強勁前景得益於歐洲大陸在全球貿易走廊中的核心地位、對智慧基礎設施的持續投資以及旨在實現供應鏈脫碳的政策壓力。儘管貨運仍佔據物流功能的最大佔有率,但隨著跨境電子商務重塑分銷模式,宅配、快捷郵件和小包裹(CEP) 服務正經歷最快的成長。泛歐 5G 走廊提供的即時網路可視性,以及歐盟綠色交易中優先發展鐵路而非道路運輸的措施,正在重塑運輸路線的經濟格局。同時,高附加價值製造業的快速復甦、自動化宅配櫃的日益普及以及國防相關物流湧入東歐,都推動了對「歐洲貨運和物流市場」一體化解決方案的新需求。隨著主要企業為尋求規模而活性化併購力度、投資低溫運輸資產以及競相獲得自動駕駛場內卡車試點認證(預計將降低成本並提高安全性),競爭格局日益嚴峻。
歐洲貨運及物流市場趨勢及洞察
泛歐5G走廊變革即時物流可視性
數位歐洲正在投資75億歐元(約82.7億美元)用於5G基礎建設,並將物流走廊列為首要任務。該基礎設施將使配備豐富感測器的卡車、火車和船舶能夠每毫秒傳輸位置、狀態和天氣資料。 FERNRIDE於2024年獲得TÜV SÜD認證,使自動駕駛卡車能夠在運作場地運作。預測性維護分析已將停機時間減少高達20%,並降低了歐洲貨運和物流市場低溫運輸中冷藏貨物的損耗率。
歐盟綠色交易加速了從公路到鐵路的模式轉換
「Fit for 55」立法方案要求到2030年將碳排放量減少55%,並鼓勵貨運公司從長途公路運輸轉向鐵路和水路運輸。光是法國就已撥款11億歐元(約12.1億美元)用於2030年建造多式聯運碼頭。然而,2024年上半年鐵路貨運量年減2.8%,顯示運力不足阻礙了運輸方式轉型的計畫。歐盟排放權交易體系(EU ETS)對海運和道路運輸附加稅不斷上漲,使得鐵路運輸在歐洲貨運和物流業的成本競爭力日益增強。
駕駛人危機引發薪資上漲螺旋
國際道路運輸聯盟(IRU)估計,目前全球道路運輸駕駛人達50萬,2028年可能增加至74.5萬。運輸公司正在實施每年15%至25%的薪資成長,主要運輸路線的公路貨運費率也在上漲18%至22%。溫控貨車運輸受到的影響更為嚴重,在需求量大的樞紐站,合格的駕駛要求年薪達到6萬歐元。
細分市場分析
到2025年,製造業將佔歐洲貨運和物流市場佔有率的32.01%,其中汽車、機械和化學工業是核心。 2兆美元的製造業回流投資將使貨運重心轉向洲際路線,進而維持穩健的合約物流系統。
2026年至2031年間,批發和零售貿易將以3.47%的複合年成長率成長,主要受73%的消費者電子商務滲透率的推動。全通路模式提倡超當地語系化配送,有利於微型倉配中心的發展。建築物流將適度受益於歐盟下一代能源計畫的支出,而可再生能源計劃正在為渦輪葉片和電池化學品建立專門的貨運路線。
貨運代理是歐洲貨運和物流市場規模的支柱,預計到2025年將佔總收入的62.74%。跨國電商(CEP)業務雖然規模較小,但成長速度更快,2026年至2031年的複合年成長率(CAGR)將達到3.70%。跨境電商是推動成長的主要動力,其中國際小包裹的成長率為5.33%。數位化海關入口網站將清關週期縮短了最多兩天,從而提高了B2C領域的重複業務量。
歐洲貨運和物流市場正受到日益完善的CEP網路的影響,這些網路包括自動化分類系統、人工智慧路線規劃和溫控儲物櫃。同時,倉儲服務也不斷擴展,因為可擴展的城市履約中心對於實現隔日達至關重要。貨運正朝向多模態模式轉型,而逆向物流、貼標和套件組裝等附加價值服務在歐盟循環經濟規則下變得日益重要。
其他福利:
- Excel格式的市場預測(ME)表
- 3個月的分析師支持
目錄
第1章 引言
- 研究假設和市場定義
- 調查範圍
第2章調查方法
第3章執行摘要
第4章 市場情勢
- 市場概覽
- 人口統計數據
- 按經濟活動分類的GDP分配
- 按經濟活動分類的GDP成長
- 通貨膨脹
- 經濟表現及概況
- 電子商務產業的趨勢
- 製造業趨勢
- 運輸和倉儲業的GDP
- 出口趨勢
- 進口趨勢
- 燃油價格
- 卡車運輸營運成本
- 卡車運輸車隊規模(按類型)
- 主要卡車供應商
- 物流績效
- 按交通方式分享
- 海運船隊運力
- 班輪運輸連接
- 停靠港口和演出
- 貨運費率趨勢
- 貨物噸位趨勢
- 基礎設施
- 法規結構(公路和鐵路)
- 法國
- 德國
- 義大利
- 荷蘭
- 北歐國家
- 俄羅斯
- 西班牙
- 英國
- 法規結構(海事和航空)
- 法國
- 德國
- 義大利
- 荷蘭
- 北歐國家
- 俄羅斯
- 西班牙
- 英國
- 價值鍊和通路分析
- 市場促進因素
- 泛歐5G走廊部署
- 歐盟綠色交易下的模式轉換促進措施
- 重要製造業的回流
- B2C小包裹遞送密度迅速擴展到主要都會區以外地區
- 烏克蘭危機後,國防後勤需求增加
- 自動駕駛場內卡車試點計畫進入規模化階段
- 市場限制
- 促進要素短缺導致通貨膨脹螺旋上升
- 鐵路網運力瓶頸
- 碼頭工人工會造成的混亂
- 碳邊境調節成本
- 市場創新
- 波特五力分析
- 新進入者的威脅
- 買方的議價能力
- 供應商的議價能力
- 替代品的威脅
- 競爭對手之間的競爭
第5章 市場規模與成長預測
- 終端用戶產業
- 農業、漁業、林業
- 建造
- 製造業
- 石油天然氣、採礦和採石
- 批發和零售
- 其他
- 物流職能
- 宅配、速遞和小包裹(CEP)
- 按目的地類型
- 國內的
- 國際的
- 按目的地類型
- 貨運代理
- 透過交通工具
- 航空
- 海路和內河航道
- 其他
- 透過交通工具
- 貨物運輸
- 透過交通工具
- 航空
- 管道
- 鐵路
- 路
- 海路和內河航道
- 透過交通工具
- 倉儲和存儲
- 透過溫度控制
- 非溫控型
- 溫度控制
- 透過溫度控制
- 其他服務
- 宅配、速遞和小包裹(CEP)
- 國家
- 丹麥
- 芬蘭
- 法國
- 德國
- 冰島
- 義大利
- 荷蘭
- 挪威
- 俄羅斯
- 西班牙
- 瑞典
- 英國
- 其他歐洲地區
第6章 競爭情勢
- 市場集中度
- 重大策略舉措
- 市佔率分析
- 公司簡介
- AP Moller-Maersk
- CH Robinson
- CMA CGM Group(Including CEVA Logistics)
- DACHSER
- DHL Group
- DSV A/S(Including DB Schenker)
- Expeditors International of Washington, Inc.
- FedEx
- GEFCO
- Hapag-Lloyd
- Hellmann Worldwide Logistics
- International Distributions Services(Including GLS)
- Kuehne+Nagel
- La Poste Group
- Mainfreight
- Panattoni Europe
- Rhenus Group
- SNCF Group
- United Parcel Service of America, Inc.(UPS)
- XPO, Inc.
第7章 市場機會與未來展望
The Europe freight and logistics market was valued at USD 1475.88 billion in 2025 and estimated to grow from USD 1523.98 billion in 2026 to reach USD 1788.64 billion by 2031, at a CAGR of 3.26% during the forecast period (2026-2031).
The solid outlook stems from the continent's central role in global trade corridors, continued investments in smart infrastructure, and policy pressure to decarbonize supply chains. Freight transport retains the largest logistics function share, while courier, express, and parcel (CEP) activities record the fastest growth as cross-border e-commerce reorders distribution models. Real-time network visibility enabled by the Pan-European 5G corridor, together with EU Green Deal incentives that favor rail over road, is reshaping route economics. Simultaneously, the rapid reshoring of high-value manufacturing, wider deployment of automated parcel machines, and defense-related flows into Eastern Europe spur fresh demand for integrated "Europe freight and logistics market" solutions. Competitive dynamics intensify as scale players pursue M&A, invest in cold-chain assets, and race to certify autonomous yard-truck pilots that promise cost and safety gains.
Europe Freight And Logistics Market Trends and Insights
Pan-European 5G Corridor Transforms Real-Time Logistics Visibility
Digital Europe dedicates EUR 7.5 billion (USD 8.27 billion) to 5G infrastructure, with logistics lanes topping the priority list. This backbone enables sensor-rich trucks, trains, and vessels to communicate location, condition, and weather data every millisecond. FERNRIDE secured TUV SUD certification in 2024, allowing autonomous trucks to operate in live yard environments. Predictive maintenance analytics already trim downtime by up to 20% and reduce chilled-cargo loss rates in the "Europe freight and logistics market" cold chain.
EU Green Deal Accelerates Modal Shift from Road to Rail
The Fit-for-55 legislative package compels a 55% carbon cut by 2030, encouraging shippers to swap long-haul trucks for rail or waterways. France alone earmarked EUR 1.1 billion (USD 1.21 billion) for intermodal terminals through 2030. Yet rail freight fell 2.8% year-on-year in H1 2024, exposing capacity shortfalls that hinder modal ambitions. Rising EU ETS surcharges on maritime and road make the rail alternative progressively cost-competitive in the Europe freight and logistics industry.
Driver Shortage Crisis Triggers Wage Inflation Spiral
The International Road Transport Union calculates a 500,000-driver shortfall that could swell to 745,000 by 2028. Operators have raised wages 15-25% annually, driving road freight rates up 18-22% in major corridors. Temperature-controlled units feel the pinch more acutely, as qualified drivers command EUR 60,000 packages in high-demand hubs.
Other drivers and restraints analyzed in the detailed report include:
- Critical Manufacturing Reshoring Drives Logistics Demand
- B2C Parcel Density Expands Beyond Tier-1 Cities
- Port Labour Disruptions Create Vessel Backlogs
For complete list of drivers and restraints, kindly check the Table Of Contents.
Segment Analysis
Manufacturing supplied 32.01% of the Europe freight and logistics market share in 2025, anchored by automotive, machinery, and chemicals. Reshoring capital outlays of USD 2 trillion tilt volumes toward continental routes, sustaining robust contract-logistics pipelines.
Wholesale and retail trade, powered by 73% consumer e-commerce penetration, grows at 3.47% CAGR (2026-2031). Omnichannel models demand hyper-local distribution, favoring micro-fulfillment facilities. Construction logistics benefits moderately from Next Generation EU spending, while renewable-energy projects introduce special-cargo lanes for turbine blades and battery chemicals.
Freight transport remained the backbone of the Europe freight and logistics market size, accounting for 62.74% revenue in 2025. CEP operations, though smaller, are scaling faster at a 3.70% CAGR between 2026-2031. Growth is rooted in cross-border e-commerce, with international parcels advancing at a 5.33% pace. Digital customs gateways shorten clearance cycles by up to two days, translating into repeat B2C volumes.
The Europe freight and logistics market is increasingly shaped by CEP network upgrades such as automated sortation, AI-guided route planning, and temperature-controlled lockers. Warehousing services rise in tandem, as next-day delivery promises hinge on expandable urban fulfillment nodes. Freight forwarding adapts through multimodal bundles, while value-added services-reverse logistics, labeling, kitting-gain relevance under EU circular-economy rules.
The Europe Freight and Logistics Market Report Segments the Industry Into End User Industry (Agriculture, Fishing, and Forestry, Construction, Manufacturing, Oil and Gas, Mining and Quarrying, Wholesale and Retail Trade, and More), by Logistics Function (Courier, Express, and Parcel, Freight Forwarding, Freight Transport, and More), and Country (Denmark, Finland, and More). The Market Forecasts are Provided in Terms of Value (USD).
List of Companies Covered in this Report:
- A.P. Moller - Maersk
- C.H. Robinson
- CMA CGM Group (Including CEVA Logistics)
- DACHSER
- DHL Group
- DSV A/S (Including DB Schenker)
- Expeditors International of Washington, Inc.
- FedEx
- GEFCO
- Hapag-Lloyd
- Hellmann Worldwide Logistics
- International Distributions Services (Including GLS)
- Kuehne+Nagel
- La Poste Group
- Mainfreight
- Panattoni Europe
- Rhenus Group
- SNCF Group
- United Parcel Service of America, Inc. (UPS)
- XPO, Inc.
Additional Benefits:
- The market estimate (ME) sheet in Excel format
- 3 months of analyst support
TABLE OF CONTENTS
1 Introduction
- 1.1 Study Assumptions and Market Definition
- 1.2 Scope of the Study
2 Research Methodology
3 Executive Summary
4 Market Landscape
- 4.1 Market Overview
- 4.2 Demographics
- 4.3 GDP Distribution by Economic Activity
- 4.4 GDP Growth by Economic Activity
- 4.5 Inflation
- 4.6 Economic Performance and Profile
- 4.6.1 Trends in E-Commerce Industry
- 4.6.2 Trends in Manufacturing Industry
- 4.7 Transport and Storage Sector GDP
- 4.8 Export Trends
- 4.9 Import Trends
- 4.10 Fuel Price
- 4.11 Trucking Operational Costs
- 4.12 Trucking Fleet Size by Type
- 4.13 Major Truck Suppliers
- 4.14 Logistics Performance
- 4.15 Modal Share
- 4.16 Maritime Fleet Load Carrying Capacity
- 4.17 Liner Shipping Connectivity
- 4.18 Port Calls and Performance
- 4.19 Freight Pricing Trends
- 4.20 Freight Tonnage Trends
- 4.21 Infrastructure
- 4.22 Regulatory Framework (Road and Rail)
- 4.22.1 France
- 4.22.2 Germany
- 4.22.3 Italy
- 4.22.4 Netherlands
- 4.22.5 Nordics
- 4.22.6 Russia
- 4.22.7 Spain
- 4.22.8 United Kingdom
- 4.23 Regulatory Framework (Sea and Air)
- 4.23.1 France
- 4.23.2 Germany
- 4.23.3 Italy
- 4.23.4 Netherlands
- 4.23.5 Nordics
- 4.23.6 Russia
- 4.23.7 Spain
- 4.23.8 United Kingdom
- 4.24 Value Chain and Distribution Channel Analysis
- 4.25 Market Drivers
- 4.25.1 Pan-European 5G Corridor Roll-Out
- 4.25.2 EU Green Deal Modal-Shift Incentives
- 4.25.3 Reshoring of Critical Manufacturing
- 4.25.4 Rapid B2C Parcel Density Beyond Tier-1 Cities
- 4.25.5 Defence-Logistics Uptick Post-Ukraine
- 4.25.6 Autonomous Yard-Truck Pilots Reaching Scale
- 4.26 Market Restraints
- 4.26.1 Driver-Shortage Inflation Spiral
- 4.26.2 Rail Network Capacity Bottlenecks
- 4.26.3 Port Labour-Union Disruptions
- 4.26.4 Carbon-Border Adjustment Compliance Costs
- 4.27 Technology Innovations in the Market
- 4.28 Porter's Five Forces Analysis
- 4.28.1 Threat of New Entrants
- 4.28.2 Bargaining Power of Buyers
- 4.28.3 Bargaining Power of Suppliers
- 4.28.4 Threat of Substitutes
- 4.28.5 Competitive Rivalry
5 Market Size and Growth Forecasts (Value, USD)
- 5.1 End User Industry
- 5.1.1 Agriculture, Fishing, and Forestry
- 5.1.2 Construction
- 5.1.3 Manufacturing
- 5.1.4 Oil and Gas, Mining and Quarrying
- 5.1.5 Wholesale and Retail Trade
- 5.1.6 Others
- 5.2 Logistics Function
- 5.2.1 Courier, Express, and Parcel (CEP)
- 5.2.1.1 By Destination Type
- 5.2.1.1.1 Domestic
- 5.2.1.1.2 International
- 5.2.1.1 By Destination Type
- 5.2.2 Freight Forwarding
- 5.2.2.1 By Mode of Transport
- 5.2.2.1.1 Air
- 5.2.2.1.2 Sea and Inland Waterways
- 5.2.2.1.3 Others
- 5.2.2.1 By Mode of Transport
- 5.2.3 Freight Transport
- 5.2.3.1 By Mode of Transport
- 5.2.3.1.1 Air
- 5.2.3.1.2 Pipelines
- 5.2.3.1.3 Rail
- 5.2.3.1.4 Road
- 5.2.3.1.5 Sea and Inland Waterways
- 5.2.3.1 By Mode of Transport
- 5.2.4 Warehousing and Storage
- 5.2.4.1 By Temperature Control
- 5.2.4.1.1 Non-Temperature Controlled
- 5.2.4.1.2 Temperature Controlled
- 5.2.4.1 By Temperature Control
- 5.2.5 Other Services
- 5.2.1 Courier, Express, and Parcel (CEP)
- 5.3 Country
- 5.3.1 Denmark
- 5.3.2 Finland
- 5.3.3 France
- 5.3.4 Germany
- 5.3.5 Iceland
- 5.3.6 Italy
- 5.3.7 Netherlands
- 5.3.8 Norway
- 5.3.9 Russia
- 5.3.10 Spain
- 5.3.11 Sweden
- 5.3.12 United Kingdom
- 5.3.13 Rest of Europe
6 Competitive Landscape
- 6.1 Market Concentration
- 6.2 Key Strategic Moves
- 6.3 Market Share Analysis
- 6.4 Company Profiles (Includes Global Level Overview, Market Level Overview, Core Segments, Financials as Available, Strategic Information, Market Rank/Share for Key Companies, Products and Services, and Recent Developments)
- 6.4.1 A.P. Moller - Maersk
- 6.4.2 C.H. Robinson
- 6.4.3 CMA CGM Group (Including CEVA Logistics)
- 6.4.4 DACHSER
- 6.4.5 DHL Group
- 6.4.6 DSV A/S (Including DB Schenker)
- 6.4.7 Expeditors International of Washington, Inc.
- 6.4.8 FedEx
- 6.4.9 GEFCO
- 6.4.10 Hapag-Lloyd
- 6.4.11 Hellmann Worldwide Logistics
- 6.4.12 International Distributions Services (Including GLS)
- 6.4.13 Kuehne+Nagel
- 6.4.14 La Poste Group
- 6.4.15 Mainfreight
- 6.4.16 Panattoni Europe
- 6.4.17 Rhenus Group
- 6.4.18 SNCF Group
- 6.4.19 United Parcel Service of America, Inc. (UPS)
- 6.4.20 XPO, Inc.
7 Market Opportunities and Future Outlook
- 7.1 White-space and Unmet-Need Assessment
 貨運及物流市場分析及預測(至2035年):依類型、產品類型、服務、技術、組件、應用、流程、最終使用者及運輸方式分類
 2026-2030年全球貨物審核與支付市場
 中東歐貨運與物流:市場佔有率分析、產業趨勢與統計、成長預測(2026-2031 年)亞太地區貨運與物流:市場佔有率分析、產業趨勢與統計、成長預測(2026-2031)南美貨運與物流:市場佔有率分析、產業趨勢與統計、成長預測(2026-2031)東協貨運與物流:市場佔有率分析、產業趨勢與統計、成長預測(2026-2031)泰國貨運與物流:市場佔有率分析、產業趨勢與統計、成長預測(2026-2031)美國貨運和物流:市場佔有率分析、行業趨勢和統計數據、成長預測(2026-2031 年)英國貨運與物流:市場佔有率分析、產業趨勢與統計、成長預測(2026-2031)西班牙貨運與物流:市場佔有率分析、產業趨勢與統計、成長預測(2026-2031)