

 |
市場調查報告書
商品編碼
2125703
日本資料中心伺服器:市佔率分析、產業趨勢與統計及成長預測(2026-2031)Japan Data Center Server - Market Share Analysis, Industry Trends & Statistics, Growth Forecasts (2026 - 2031) |
||||||

※ 本網頁內容可能與最新版本有所差異。詳細情況請與我們聯繫。
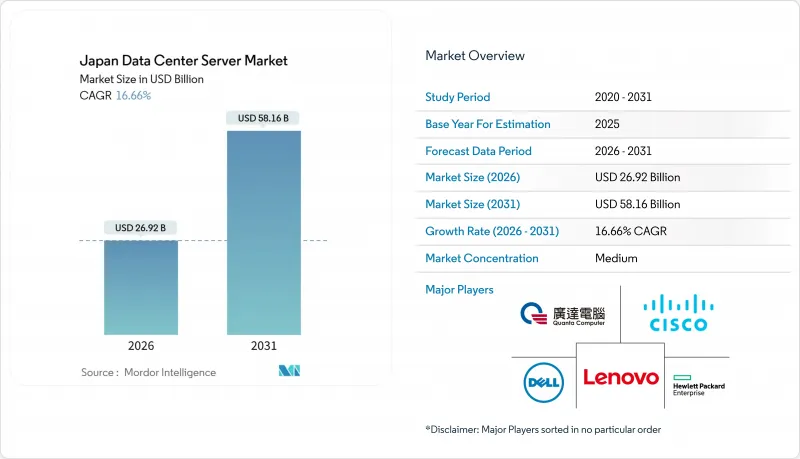
根據 Mordor Intelligence 預測,日本資料中心伺服器市場規模預計將在 2026 年達到 269.2 億美元,到 2031 年達到 581.6 億美元,年複合成長率為 16.66%。
本報告按層級(一級、二級、其他)、資料中心規模(小規模、中型、其他)、資料中心類型(託管、超大規模資料中心業者/雲端服務供應商、其他)、外形規格(半高刀片、全高刀片、其他)以及應用/工作負載(虛擬化/私有雲端、高效能運算、其他)進行分類。市場預測以美元計價。
日本資料中心伺服器市場的趨勢與洞察
美國主要雲端服務供應商擴建超大規模設施
亞馬遜網路服務 (AWS)、微軟 Azure 和 Oracle 已承諾在 2024 年至 2026 年間投入超過 260 億美元的資本,遠超過去十年的累積投資額,這表明受監管的工作負載正轉向國內可用區。為此,NTT Data 啟動了一項 100 億美元的建設項目,目標是在 2027 年前建成約 1 吉瓦的資料中心;Equinix 已在其 TY15 資料中心部署了 3700 個機櫃,以滿足日益成長的互聯需求。三井不動產和 Ares Management 也已獲得資金,用於在神奈川和東京建造大規模資料中心。專案週期的縮短使得預先整合模組化機架更受歡迎,這種機架可以將部署時間從 12 個月縮短至 90 天,從而使提供現場組裝服務的供應商受益。
加快 AI 最佳化型 GPU 伺服器的更新週期
到2025年,日本業者將部署超過1萬塊NVIDIA H200 GPU。值得關注的部署包括:GMO Internet於5月部署的擁有1000塊GPU的叢集; Sakura Internet於8月將GPU數量擴展至3072塊;以及日本產業技術綜合研究所(AIST)於1月部署的擁有6128塊GPU的ABCI 3.0超級電腦。生成式人工智慧推理處理的功耗遠超過每機架100千瓦,迫使業者採用水冷系統。 2025年4月,富士通與Super Micro Computer合作,將直冷式水冷系統整合到PRIMERGY伺服器中,旨在降低40%的能耗。隨著企業享受即時分析帶來的優勢,升級週期正縮短至2.5年。
大都會圈土地和電力成本高昂
2024年,大東京地區資料中心的建造成本達到每兆瓦1,320萬美元,比新加坡高出35%。這主要是由於土地短缺以及東京電力公司(TEPCO)實施的高額電價所致。為了因應這項挑戰,開發商正透過引進液冷機架來提高現有資料中心的密度,並向土地價格低40%且可再生能源普及率超過30%的北海道和九州地區擴張。
細分市場分析
到2025年,Tier 3級資料中心將佔日本資料中心伺服器市場佔有率的71.24%,這反映了市場對成本控制的偏好以及企業級部署的需求。 Tier 4級資料中心預計將以17.21%的複合年成長率成長,尤其是在2024年能登半島地震之後,因為銀行和政府機構對99.995%的運轉率提出了更高的要求。 NEXTDC的TK1園區於2024年投入使用,顯示租戶願意支付25%的溢價租金以獲得更高的冗餘度。
目前,廠商的策略著重於採用直冷式水冷PRIMERGY和DLC-2機架,降低了GPU叢集所需的250千瓦功率密度。因此,預計日本Tier 4資料中心伺服器市場的成長速度將超過整體市場成長率。同時,隨著企業整合到區域託管中心,Tier 1和Tier 2機房的需求持續下降。
預計到2025年,超大規模資料中心將佔據日本資料中心伺服器市場44.54%的佔有率,年複合成長率達17.45%,主要得益於AWS和NTT Data等公司超過1吉瓦的資料中心專案。而10至50兆瓦的大型資料中心因都市區電網建設延誤,成長速度有所放緩。隨著雲端運算的推進,中型資料中心的利潤率面臨壓力,而小規模傳統資料中心則正在逐步淘汰。
日本資料中心伺服器市場超大規模資產的規模進一步得益於長期售後回租協議,例如吉寶資料中心房地產投資信託基金(Keppel DC REIT)以7.07億美元收購「東京資料中心3號」(Tokyo DC 3),這些協議透過確保穩定的現金流來吸引機構投資者的資金。邊緣運算營運商正在採用模組化的10兆瓦設計,以適應租戶擴張的速度和電網運行計畫。
其他好處
- Excel格式的市場預測(ME)表
- 3個月的分析師支持
目錄
第1章:引言
- 研究假設和市場定義
- 調查範圍
第2章:調查方法
第3章執行摘要
第4章 市場狀況
- 市場概覽
- 市場促進因素
- 美國主要雲端服務供應商擴建超大規模設施
- 智慧工廠的引入導致邊緣運算節點數量增加。
- 加快 AI 最佳化型 GPU 伺服器的更新週期
- 政府關於IT採購中「綠色」採購的規定。
- 提高資料中心能源效率的企業稅收優惠政策
- 半導體產業策略自給自足計劃
- 市場限制因素
- 大都會圈土地和電力成本高昂
- 電網輸出削減風險增加
- 獲得環境核准的時間越來越長。
- 高級伺服器維護人員短缺
- 工業供應鏈分析
- 監理情勢
- 技術展望
- 波特五力分析
- 對影響市場的宏觀經濟因素進行評估
第5章 市場規模與成長預測
- 層級類型
- 一級和二級
- 三級
- 第四級
- 按資料中心規模
- 小規模資料中心
- 中型資料中心
- 大型資料中心
- 超大規模資料中心
- 依資料中心類型
- 託管資料中心
- 超大規模資料中心業者CSP 資料中心
- 企業邊緣資料中心
- 按外形規格
- 半高刀片
- 全高刀片
- 四分之一高度的微型刀片
- 按應用和工作負載
- 虛擬化和私有雲端
- 高效能運算(HPC)
- 人工智慧、機器學習和數據分析
- 以儲存為中心
- 邊緣物聯網閘道器
第6章 競爭情勢
- 市場集中度
- 策略趨勢
- 市佔率分析
- 公司簡介
- Fujitsu Limited
- NEC Corporation
- Dell Technologies Inc.
- Hewlett Packard Enterprise Company
- Lenovo Group Limited
- Super Micro Computer Inc.
- Quanta Computer Inc.
- Huawei Technologies Co. Ltd.
- IBM Corporation
- Gigabyte Technology
- Cisco Systems Inc.
- Hitachi Ltd.
- ASUSTeK Computer Inc.
- Wistron Corporation
第7章 市場機會與未來展望
According to Mordor Intelligence, the Japan data center server market size stood at USD 26.92 billion in 2026 and is forecast to reach USD 58.16 billion by 2031, expanding at a 16.66% CAGR.
This report is Segmented by Tier Type (Tier 1 and 2, and More), Data Center Size (Small, Medium, and More), Data Center Type (Colocation, Hyperscalers/CSPs, and More), Form Factor (Half-Height Blades, Full-Height Blades, and More), Application/Workload (Virtualization and Private Cloud, HPC, and More). The Market Forecasts are Provided in Terms of Value (USD).
Japan Data Center Server Market Trends and Insights
Expansion Of Hyperscale Facilities By US Cloud Giants
Amazon Web Services, Microsoft Azure, and Oracle pledged more than USD 26 billion of capital between 2024 and 2026, dwarfing the previous decade's cumulative investment and signaling a pivot toward in-country availability zones for regulated workloads. NTT DATA responded with a USD 10 billion build program targeting roughly 1 gigawatt by 2027, while EQUINIX deployed 3,700 cabinets at its TY15 site to satisfy rising interconnection demand. Mitsui Fudosan and Ares Management have likewise financed large campuses in Kanagawa and Tokyo. Faster project cycles favor modular racks that ship pre-integrated, enabling deployment in 90 days rather than 12 months, which benefits vendors with local assembly.
Accelerated Refresh Cycle To AI-Optimized GPU Servers
Japanese operators installed more than 10,000 NVIDIA H200 GPUs during 2025. Notable rollouts include GMO Internet's 1,000-GPU cluster in May, SAKURA Internet's 3,072-unit expansion in August, and AIST's 6,128-GPU ABCI 3.0 supercomputer in January. Generative AI inference pushes rack power well beyond 100 kilowatts, compelling operators to retrofit liquid-cooling. Fujitsu and Super Micro Computer formed an April 2025 pact to embed direct liquid cooling in PRIMERGY servers, aiming for 40% lower energy use. The refresh interval is compressing to 2.5 years as firms reap real-time analytics benefits.
High Land And Power Costs In Metro Regions
Data-center build costs climbed to USD 13.2 million per megawatt in Greater Tokyo during 2024, 35% above Singapore, fueled by scarce land and premium grid tariffs from TEPCO. Developers respond by densifying existing footprints with liquid-cooled racks and by expanding to Hokkaido and Kyushu, where land is 40% cheaper and renewable penetration exceeds 30%.
Other drivers and restraints analyzed in the detailed report include:
- Rising Edge-Computing Nodes For Smart-Factory Rollouts
- Strategic Semiconductor Self-Sufficiency Programs
- Escalating Grid-Power Curtailment Risks
For complete list of drivers and restraints, kindly check the Table Of Contents.
Segment Analysis
Tier 3 assets dominated the Japan data center server market share at 71.24% in 2025, a reflection of cost-sensitive colocation and enterprise deployments. Tier 4 facilities are projected to expand at a 17.21% CAGR as banks and government agencies demand 99.995% uptime, especially after the 2024 Noto Peninsula earthquake. NEXTDC's TK1 campus launched in 2024 illustrates tenant willingness to pay 25% premium lease rates for higher redundancy.
Vendor strategies now emphasize direct liquid-cooled PRIMERGY and DLC-2 racks that temper the 250-kilowatt densities needed for GPU clusters. The Japan data center server market size for Tier 4 is therefore on track to outpace overall growth. Meanwhile, Tier 1 and Tier 2 rooms continue to decline as enterprises consolidate into regional colocation hubs.
Hyperscale campuses controlled 44.54% of the Japan data center server market in 2025 and will grow at a 17.45% CAGR, buoyed by AWS and NTT DATA programs exceeding 1 gigawatt. Large 10-50 megawatt sites trail as grid delays impede metro builds. Medium facilities face margin pressure amid cloud migration, while small legacy rooms are being decommissioned.
The Japan data center server market size for hyperscale assets is further supported by long-term sale-leaseback deals such as Keppel DC REIT's USD 707 million Tokyo DC 3 purchase, ensuring stable cash flows that attract institutional capital. Edge-oriented operators use modular 10-megawatt designs to match tenant ramp-up and grid schedules.
Complete Report Scope:
- By Tier Type
- Tier 1 and 2
- Tier 3
- Tier 4
- By Data Center Size
- Small Data Center
- Medium Data Center
- Large Data Center
- Hyperscale Data Center
- By Data Center Type
- Colocation Data Center
- Hyperscalers Data Center/CSPs
- Enterprise and Edge Data Center
- By Form Factor
- Half-height Blades
- Full-height Blades
- Quarter-height / Micro-blades
- By Application / Workload
- Virtualisation and Private Cloud
- High-Performance Computing (HPC)
- Artificial Intelligence/Machine Learning and Data Analytics
- Storage-centric
- Edge / IoT Gateways
List of Companies Covered in this Report:
- Fujitsu Limited
- NEC Corporation
- Dell Technologies Inc.
- Hewlett Packard Enterprise Company
- Lenovo Group Limited
- Super Micro Computer Inc.
- Quanta Computer Inc.
- Huawei Technologies Co. Ltd.
- IBM Corporation
- Gigabyte Technology
- Cisco Systems Inc.
- Hitachi Ltd.
- ASUSTeK Computer Inc.
- Wistron Corporation
Additional Benefits:
- The market estimate (ME) sheet in Excel format
- 3 months of analyst support
TABLE OF CONTENTS
1 INTRODUCTION
- 1.1 Study Assumptions and Market Definition
- 1.2 Scope of the Study
2 RESEARCH METHODOLOGY
3 EXECUTIVE SUMMARY
4 MARKET LANDSCAPE
- 4.1 Market Overview
- 4.2 Market Drivers
- 4.2.1 Expansion of hyperscale facilities by US cloud giants
- 4.2.2 Rising edge-computing nodes for smart-factory rollouts
- 4.2.3 Accelerated refresh cycle to AI-optimized GPU servers
- 4.2.4 Mandatory "green" procurement rules for government IT
- 4.2.5 Corporate tax incentives for datacenter energy efficiency
- 4.2.6 Strategic semiconductor self-sufficiency programs
- 4.3 Market Restraints
- 4.3.1 High land and power costs in metro regions
- 4.3.2 Escalating grid-power curtailment risks
- 4.3.3 Lengthy environmental approval timelines
- 4.3.4 Talent shortage in advanced server maintenance
- 4.4 Industry Supply-Chain Analysis
- 4.5 Regulatory Landscape
- 4.6 Technological Outlook
- 4.7 Porter's Five Forces Analysis
- 4.7.1 Threat of New Entrants
- 4.7.2 Bargaining Power of Buyers
- 4.7.3 Bargaining Power of Suppliers
- 4.7.4 Threat of Substitutes
- 4.7.5 Intensity of Competitive Rivalry
- 4.8 Assesment of Macroeconomic Factors on the Market
5 MARKET SIZE AND GROWTH FORECASTS (VALUE)
- 5.1 By Tier Type
- 5.1.1 Tier 1 and 2
- 5.1.2 Tier 3
- 5.1.3 Tier 4
- 5.2 By Data Center Size
- 5.2.1 Small Data Center
- 5.2.2 Medium Data Center
- 5.2.3 Large Data Center
- 5.2.4 Hyperscale Data Center
- 5.3 By Data Center Type
- 5.3.1 Colocation Data Center
- 5.3.2 Hyperscalers Data Center/CSPs
- 5.3.3 Enterprise and Edge Data Center
- 5.4 By Form Factor
- 5.4.1 Half-height Blades
- 5.4.2 Full-height Blades
- 5.4.3 Quarter-height / Micro-blades
- 5.5 By Application / Workload
- 5.5.1 Virtualisation and Private Cloud
- 5.5.2 High-Performance Computing (HPC)
- 5.5.3 Artificial Intelligence/Machine Learning and Data Analytics
- 5.5.4 Storage-centric
- 5.5.5 Edge / IoT Gateways
6 COMPETITIVE LANDSCAPE
- 6.1 Market Concentration
- 6.2 Strategic Moves
- 6.3 Market Share Analysis
- 6.4 Company Profiles (includes Global Level Overview, Market Level Overview, Core Segments, Financials as available, Strategic Information, Market Rank/Share, Products and Services, Recent Developments)
- 6.4.1 Fujitsu Limited
- 6.4.2 NEC Corporation
- 6.4.3 Dell Technologies Inc.
- 6.4.4 Hewlett Packard Enterprise Company
- 6.4.5 Lenovo Group Limited
- 6.4.6 Super Micro Computer Inc.
- 6.4.7 Quanta Computer Inc.
- 6.4.8 Huawei Technologies Co. Ltd.
- 6.4.9 IBM Corporation
- 6.4.10 Gigabyte Technology
- 6.4.11 Cisco Systems Inc.
- 6.4.12 Hitachi Ltd.
- 6.4.13 ASUSTeK Computer Inc.
- 6.4.14 Wistron Corporation
7 MARKET OPPORTUNITIES AND FUTURE OUTLOOK
- 7.1 White-Space and Unmet-Need Assessment

 2026年全球資料中心和伺服器半導體市場報告
 中國資料中心伺服器:市場佔有率分析、產業趨勢與統計及成長預測(2026-2031)北美資料中心伺服器:市佔率分析、產業趨勢與統計及成長預測(2026-2031 年)印度資料中心伺服器:市場佔有率分析、產業趨勢與統計及成長預測(2026-2032 年)歐洲資料中心伺服器:市場佔有率分析、產業趨勢與統計及成長預測(2026-2031 年)美國資料中心伺服器:市場佔有率分析、產業趨勢與統計及成長預測(2026-2031 年)越南資料中心伺服器:市場佔有率分析、產業趨勢與統計及成長預測(2026-2031)馬來西亞資料中心伺服器:市場佔有率分析、產業趨勢與統計及成長預測(2026-2031 年)
 資料中心和伺服器半導體市場報告:趨勢、預測和競爭分析(至2035年)
 資料中心伺服器市場規模、佔有率、成長率、全球產業分析、區域趨勢以及 2026 年至 2034 年的預測。