


 |
市場調查報告書
商品編碼
2119726
美國資料中心伺服器:市場佔有率分析、產業趨勢與統計及成長預測(2026-2031 年)United States Data Center Server - Market Share Analysis, Industry Trends & Statistics, Growth Forecasts (2026 - 2031) |
||||||

※ 本網頁內容可能與最新版本有所差異。詳細情況請與我們聯繫。
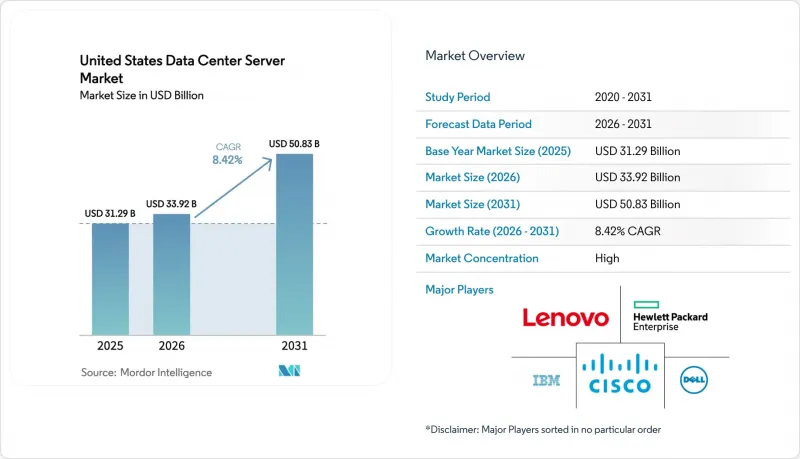
根據 Mordor Intelligence 估計,美國資料中心伺服器市場在 2026 年的價值將達到 339.2 億美元,高於 2025 年的 312.9 億美元,預計到 2031 年將達到 508.3 億美元。
預計 2026 年至 2031 年的複合年成長率為 8.42%。
本報告以「類型」(一級、二級等)、「外形規格」(半高刀片式等)、「最終用戶產業」(銀行、金融服務和保險、製造業等)、「資料中心類型」(超大規模資料中心業者資料中心/雲端服務供應商等)和「應用程式/工作負載」(虛擬化和私有雲端、以儲存為中心的應用程式等)對產業進行分類。市場預測以美元計價。
美國資料中心伺服器市場趨勢與洞察
超大規模資料中心業者正在快速更新資本支出(CAPEX)週期。
亞馬遜、微軟、Google和Meta計畫在2025年總合超過3,200億美元用於資料中心建置。隨著這些公司追求更高的運算密度以支援人工智慧,伺服器更換週期預計將延長至五年。光是亞馬遜一項1000億美元的投資預計就會因折舊免稅額導致7億美元的營業利潤減少,但同時也將縮短其先進水冷機架的投資回收期。聯邦機構也正在效仿,能源部已將16個高密度伺服器設施的建設列為優先事項,預計2027年投入運作。預計這將進一步加劇維吉尼亞和奧勒岡州的伺服器需求高峰。
企業中人工智慧/機器學習工作負載的激增
據金融機構稱,84%的高階主管對人工智慧基礎設施不足可能導致的災難性資料遺失表示擔憂。銀行業模型的準確率仍只有21%,這促使企業加大對支援向量處理和大容量記憶體的伺服器的投資。在醫療保健系統中,人工智慧正被用於診斷和記錄保存,推動機架密度高達50千瓦。製造業正在邊緣節點上部署工業4.0應用,將5G與微型資料中心外形規格結合。聯想的ThinkSystem V4平台透過將機架密度提高2.5倍,並將每瓦效能提高2.4倍,實現了其效率目標。
網路入侵的頻率和成本不斷增加
2024年,安全漏洞的平均成本將達到556萬美元,而每次漏洞造成的停機成本超過10萬美元,因此整體擁有成本(TCO)更高。由於安全方面的擔憂,42%的銀行正在將其人工智慧工作負載從公共雲端遷移,這導致本地環境的擴張、採購週期的延長以及資本支出(CapEx)的增加。 CloudNordic遭受的勒索軟體攻擊導致客戶資料完全遺失,這是一個最糟糕的情況,並促使零信任架構和生物識別存取控制得到更廣泛的應用。
細分市場分析
2025年,三級資料中心占美國資料中心伺服器市場收入的65.70%。四級資料中心雖然規模較小,但預計隨著超大規模資料中心業者在完全容錯的機房中部署人工智慧訓練叢集,其複合年成長率將達到12.79%。這些機房一旦故障,損失可能超過10萬美元。預計從2026年到2031年,四級資料中心在美國資料中心伺服器市場的佔有率將快速成長。鑑於預計到2027年每個機架的功率密度將達到50千瓦,四級資料中心規範在聯邦政府的人工智慧賦能計畫中被列為優先事項,該計畫旨在將16個設施指定為人工智慧賦能設施。
在分散式邊緣節點中,成本效益優先於最大冗餘,因此一級和二級設計仍然發揮著至關重要的作用。金融服務業向四級架構的轉變,是由更嚴格的合規要求和更高的資料外洩處罰所驅動的。總體而言,容錯性的重要性鞏固了四級架構作為成長最快細分市場的地位,重塑了託管升級藍圖,並推動了液冷技術的維修。
受虛擬化工作負載需求的推動,半高刀鋒伺服器在2025年仍維持48.54%的市佔率。同時,隨著營運商將機架整合為20英尺邊緣模組,四分之一高微型刀鋒伺服器的市佔率正以13.87%的複合年成長率成長。因此,預計到2031年,美國資料中心伺服器微型刀片部署的市場規模將持續成長。 EdgeMicro在城市地區的部署案例以及製造業的工業4.0先導計畫凸顯了向緊湊型、節能型硬體的轉變趨勢。
儘管全高刀片伺服器仍然在高效能運算叢集集中使用,但每個機架的功耗限制使得微型刀鋒伺服器結合晶片級液冷技術越來越受歡迎。超大規模資料中心業者正在選擇性地採用微型刀片伺服器平台來建立人工智慧推理節點,以平衡密度和記憶體頻寬需求。
其他好處:
- Excel格式的市場預測(ME)表
- 三個月的分析師支持
目錄
第1章:引言
- 研究假設和市場定義
- 調查範圍
第2章:調查方法
第3章執行摘要
第4章 市場狀況
- 市場概覽
- 市場促進因素
- 超大規模資料中心業者對資本投資週期的快速更新
- 企業人工智慧/機器學習工作負載不斷擴展
- 邊緣運算和雲端運算的融合正在推動對微型伺服器的需求。
- 政府對國內半導體和伺服器製造給予優惠待遇
- 在美國,電源供應合約傾向於採用能夠承受液冷的機架。
- 二線城市的稅收優惠政策正引發第二波資料中心建設浪潮。
- 市場限制因素
- 網路入侵的頻率和成本不斷增加
- 主要半導體(HBM、GPU)供應鏈波動
- 在PJM和MISO,併網延遲時間已超過24個月。
- 美國環保署新的「能源之星 v4」標準對怠速耗電量的限制,阻礙了舊款車型的升級。
- 產業價值鏈分析
- 監理情勢
- 技術展望
- 波特五力模型
- 評估宏觀經濟趨勢對市場的影響
第5章 市場規模與成長預測
- 資料中心層級
- 一級和二級
- 三級
- 第四級
- 按外形規格
- 半高刀片
- 全高刀片
- 四分之一高度/微刀片
- 按應用程式/工作負載
- 虛擬化和私有雲端
- 高效能運算(HPC)
- 人工智慧/機器學習和數據分析
- 以儲存為中心
- 邊緣/物聯網閘道器
- 依資料中心類型
- 超大規模資料中心業者雲端服務供應商/雲端服務供應商
- 託管設施
- 企業和邊緣運算
- 按最終用途行業分類
- BFSI
- 資訊科技/通訊
- 醫療保健和生命科學
- 製造業和工業4.0
- 能源公用事業
- 政府/國防
第6章 競爭情勢
- 市場集中度
- 策略趨勢
- 市佔率分析
- 公司簡介
- Dell Technologies Inc.
- Hewlett Packard Enterprise Company
- Lenovo Group Limited
- International Business Machines Corporation
- Cisco Systems, Inc.
- Super Micro Computer, Inc.
- Inspur Electronic Information Industry Co., Ltd.
- Quanta Computer Inc.
- Huawei Technologies Co., Ltd.
- Kingston Technology Company, Inc.
- Amazon Web Services, Inc.
- NVIDIA Corporation
- Ampere Computing LLC
- ASUSTeK Computer Inc.
- Giga-byte Technology Co., Ltd.
- Foxconn Technology Group(Hon Hai Precision)
- Equinix, Inc.(Server designs for xScale)
- Penguin Computing, Inc.
- Celestica Inc.
- MiTAC Holdings Corporation(Tyan)
- OVH US LLC
第7章 市場機會與未來展望
According to Mordor Intelligence, the United States data center server market size in 2026 is estimated at USD 33.92 billion, growing from 2025 value of USD 31.29 billion with 2031 projections showing USD 50.83 billion, growing at 8.42% CAGR over 2026-2031.
This report Segments the Industry Into Type (Tier 1, Tier 2, and More), Form Factor(Half-Height Blades, and More), End-User Verticals (BFSI, Manufacturing, and More), Data Center Type(Hyperscalers/Cloud Service Provider, and More) and by Application / Workload (Virtualisation and Private Cloud, Storage-Centric and More). The Market Forecasts are Provided in Terms of Value (USD).
United States Data Center Server Market Trends and Insights
Rapid hyperscaler CAPEX cycle renewal
Amazon, Microsoft, Google, and Meta collectively plan to spend more than USD 320 billion on data centers in 2025, extending server replacement cycles to five years as firms pursue AI compute density. Amazon's USD 100 billion allocation alone is estimated to add a USD 700 million operating-income drag due to accelerated depreciation, yet it shortens payback periods for advanced liquid-cooled racks. Federal agencies are mirroring the trend; sixteen Department of Energy sites have been fast-tracked for server-dense builds, with online availability expected by 2027, reinforcing demand peaks in Virginia and Oregon.
Enterprise AI/ML workload proliferation
Financial institutions cite an 84% concern among executives over catastrophic data loss if AI infrastructure falls short. Accuracy levels of only 21% in banking models spur investment in servers optimized for vector processing and larger memory footprints. Healthcare systems leverage AI for diagnostics and documentation, driving rack densities up to 50 kW. Manufacturing groups are adopting Industry 4.0 applications on edge nodes, combining 5G and micro-data center form factors. Lenovo's ThinkSystem V4 platform achieves 2.5X rack density and 2.4X performance-per-watt gains, underscoring its efficiency goals.
Rising frequency and cost of cyber-intrusions
Average breach costs of USD 5.56 million in 2024, combined with downtime expenses exceeding USD 100,000 per event, elevate the total cost of ownership. Forty-two percent of banks have migrated AI workloads away from public clouds due to security concerns, prompting on-premises build-outs that lengthen procurement cycles and increase CapEx. Ransomware events, such as CloudNordic's total customer data loss, illustrate worst-case scenarios compelling wider adoption of zero-trust architectures and biometric access controls.
Other drivers and restraints analyzed in the detailed report include:
- Edge-cloud convergence boosting micro-server demand
- Government incentives for domestic semiconductor manufacturing
- Supply-chain volatility for key silicon (HBM, GPUs)
For complete list of drivers and restraints, kindly check the Table Of Contents.
Segment Analysis
Tier 3 installations delivered 65.70% of revenue in 2025, anchoring the United States data center server market. Tier 4, though smaller, is projected to rise at 12.79% CAGR as hyperscalers assign AI training clusters to fully fault-tolerant halls where a single outage can cost over USD 100,000. The United States data center server market size contribution from Tier 4 is projected to grow steeply between 2026 and 2031. Federal programs that earmark sixteen sites for AI-ready builds favor Tier 4 specifications, given 50 kW-per-rack power densities anticipated by 2027.
Tier 1 and Tier 2 designs remain relevant for distributed edge nodes prioritizing cost efficiency over maximum redundancy. Financial-services migration toward Tier 4 also stems from stricter compliance and rising breach penalties. Altogether, the resilience imperative cements Tier 4 as the fastest-moving slice, reshaping colocation upgrade roadmaps and guiding liquid-cooling retrofits.
Half-height blades retained 48.54% market share in 2025 on the strength of virtualization workloads. Yet quarter-height micro-blades are climbing at 13.87% CAGR as operators compress racks into 20-foot edge modules. The United States data center server market size for micro-blade deployments is thus on an upward trajectory through 2031. EdgeMicro's city-center installs and manufacturing-sector Industry 4.0 pilots highlight the swing toward compact, energy-efficient hardware.
Full-height blades continue serving HPC clusters, but power-per-rack limits increasingly favor micro-blades paired with direct-to-chip liquid cooling. Hyperscalers are selectively adopting micro-blade platforms for AI inference nodes, balancing density against memory bandwidth needs.
Complete Report Scope:
- By Data-Center Tier
- Tier 1 and 2
- Tier 3
- Tier 4
- By Form Factor
- Half-height Blades
- Full-height Blades
- Quarter-height / Micro-blades
- By Application / Workload
- Virtualisation and Private Cloud
- High-Performance Computing (HPC)
- Artificial Intelligence/Machine Learning and Data Analytics
- Storage-centric
- Edge / IoT Gateways
- By Data Center Type
- Hyperscalers/Cloud Service Provider
- Colocation Facilities
- Enterprise and Edge
- By End-use Industry
- BFSI
- IT and Telecom
- Healthcare and Life-Sciences
- Manufacturing and Industry 4.0
- Energy and Utilities
- Government and Defence
List of Companies Covered in this Report:
- Dell Technologies Inc.
- Hewlett Packard Enterprise Company
- Lenovo Group Limited
- International Business Machines Corporation
- Cisco Systems, Inc.
- Super Micro Computer, Inc.
- Inspur Electronic Information Industry Co., Ltd.
- Quanta Computer Inc.
- Huawei Technologies Co., Ltd.
- Kingston Technology Company, Inc.
- Amazon Web Services, Inc.
- NVIDIA Corporation
- Ampere Computing LLC
- ASUSTeK Computer Inc.
- Giga-byte Technology Co., Ltd.
- Foxconn Technology Group (Hon Hai Precision)
- Equinix, Inc. (Server designs for xScale)
- Penguin Computing, Inc.
- Celestica Inc.
- MiTAC Holdings Corporation (Tyan)
- OVH US LLC
Additional Benefits:
- The market estimate (ME) sheet in Excel format
- 3 months of analyst support
TABLE OF CONTENTS
1 INTRODUCTION
- 1.1 Study Assumptions and Market Definition
- 1.2 Scope of the Study
2 RESEARCH METHODOLOGY
3 EXECUTIVE SUMMARY
4 MARKET LANDSCAPE
- 4.1 Market Overview
- 4.2 Market Drivers
- 4.2.1 Rapid hyperscaler CAPEX cycle renewal
- 4.2.2 Enterprise AI/ML workload proliferation
- 4.2.3 Edge-cloud convergence boosting micro-server demand
- 4.2.4 Government incentives for domestic semiconductor/Server manufacturing
- 4.2.5 U.S. power-availability contracts favor liquid-cool-ready racks
- 4.2.6 Tier-2 city tax abatements attracting second-wave data-center builds
- 4.3 Market Restraints
- 4.3.1 Rising frequency and cost of cyber-intrusions
- 4.3.2 Supply-chain volatility for key silicon (HBM, GPUs)
- 4.3.3 Grid-interconnection delays exceeding 24-months in PJM and MISO
- 4.3.4 New EPA ENERGY STAR v4 idle-power caps constraining legacy refresh
- 4.4 Industry Value Chain Analysis
- 4.5 Regulatory Landscape
- 4.6 Technological Outlook
- 4.7 Porter's Five Forces
- 4.7.1 Threat of New Entrants
- 4.7.2 Bargaining Power of Buyers
- 4.7.3 Bargaining Power of Suppliers
- 4.7.4 Threat of Substitutes
- 4.7.5 Intensity of Competitive Rivalry
- 4.8 Assessment of the Impact on Macro Economic Trends on the Market
5 MARKET SIZE AND GROWTH FORECASTS (VALUES)
- 5.1 By Data-Center Tier
- 5.1.1 Tier 1 and 2
- 5.1.2 Tier 3
- 5.1.3 Tier 4
- 5.2 By Form Factor
- 5.2.1 Half-height Blades
- 5.2.2 Full-height Blades
- 5.2.3 Quarter-height / Micro-blades
- 5.3 By Application / Workload
- 5.3.1 Virtualisation and Private Cloud
- 5.3.2 High-Performance Computing (HPC)
- 5.3.3 Artificial Intelligence/Machine Learning and Data Analytics
- 5.3.4 Storage-centric
- 5.3.5 Edge / IoT Gateways
- 5.4 By Data Center Type
- 5.4.1 Hyperscalers/Cloud Service Provider
- 5.4.2 Colocation Facilities
- 5.4.3 Enterprise and Edge
- 5.5 By End-use Industry
- 5.5.1 BFSI
- 5.5.2 IT and Telecom
- 5.5.3 Healthcare and Life-Sciences
- 5.5.4 Manufacturing and Industry 4.0
- 5.5.5 Energy and Utilities
- 5.5.6 Government and Defence
6 COMPETITIVE LANDSCAPE
- 6.1 Market Concentration
- 6.2 Strategic Moves
- 6.3 Market Share Analysis
- 6.4 Company Profiles (includes Global level Overview, Market level overview, Core Segments, Financials as available, Strategic Information, Market Rank/Share, Products and Services, Recent Developments)
- 6.4.1 Dell Technologies Inc.
- 6.4.2 Hewlett Packard Enterprise Company
- 6.4.3 Lenovo Group Limited
- 6.4.4 International Business Machines Corporation
- 6.4.5 Cisco Systems, Inc.
- 6.4.6 Super Micro Computer, Inc.
- 6.4.7 Inspur Electronic Information Industry Co., Ltd.
- 6.4.8 Quanta Computer Inc.
- 6.4.9 Huawei Technologies Co., Ltd.
- 6.4.10 Kingston Technology Company, Inc.
- 6.4.11 Amazon Web Services, Inc.
- 6.4.12 NVIDIA Corporation
- 6.4.13 Ampere Computing LLC
- 6.4.14 ASUSTeK Computer Inc.
- 6.4.15 Giga-byte Technology Co., Ltd.
- 6.4.16 Foxconn Technology Group (Hon Hai Precision)
- 6.4.17 Equinix, Inc. (Server designs for xScale)
- 6.4.18 Penguin Computing, Inc.
- 6.4.19 Celestica Inc.
- 6.4.20 MiTAC Holdings Corporation (Tyan)
- 6.4.21 OVH US LLC
7 MARKET OPPORTUNITIES AND FUTURE OUTLOOK
- 7.1 White-space and Unmet-need Assessment

 2026年全球資料中心和伺服器半導體市場報告
 中國資料中心伺服器:市場佔有率分析、產業趨勢與統計及成長預測(2026-2031)北美資料中心伺服器:市佔率分析、產業趨勢與統計及成長預測(2026-2031 年)印度資料中心伺服器:市場佔有率分析、產業趨勢與統計及成長預測(2026-2032 年)日本資料中心伺服器:市佔率分析、產業趨勢與統計及成長預測(2026-2031)歐洲資料中心伺服器:市場佔有率分析、產業趨勢與統計及成長預測(2026-2031 年)越南資料中心伺服器:市場佔有率分析、產業趨勢與統計及成長預測(2026-2031)馬來西亞資料中心伺服器:市場佔有率分析、產業趨勢與統計及成長預測(2026-2031 年)
 資料中心和伺服器半導體市場報告:趨勢、預測和競爭分析(至2035年)
 資料中心伺服器市場規模、佔有率、成長率、全球產業分析、區域趨勢以及 2026 年至 2034 年的預測。