


 |
市場調查報告書
商品編碼
2119743
中國資料中心伺服器:市場佔有率分析、產業趨勢與統計及成長預測(2026-2031)China Data Center Server - Market Share Analysis, Industry Trends & Statistics, Growth Forecasts (2026 - 2031) |
||||||

※ 本網頁內容可能與最新版本有所差異。詳細情況請與我們聯繫。
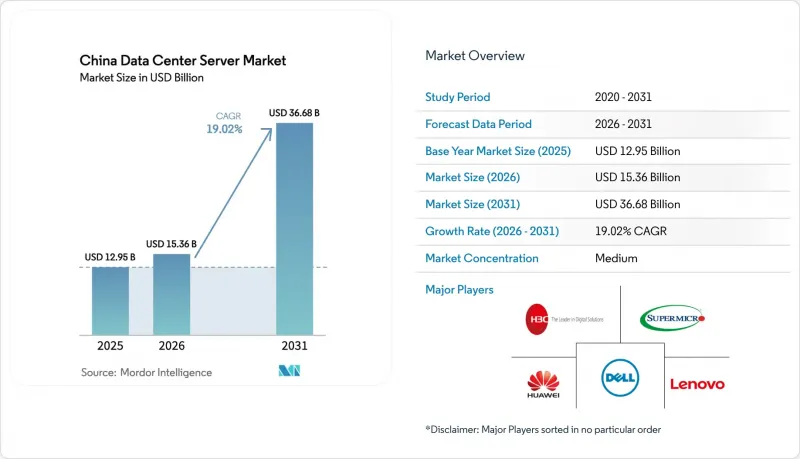
據 Mordor Intelligence 稱,2025 年中國資料中心伺服器市值為 129.5 億美元,預計到 2031 年將達到 366.8 億美元,而 2026 年為 153.6 億美元,預測期(2026-2031 年)的複合年成長率為 19.02%。
本報告按層級(一級、二級、其他)、資料中心規模(小規模、中型、其他)、資料中心類型(託管、超大規模資料中心業者/雲端服務供應商、其他)、外形規格(半高刀片、全高刀片、其他)以及應用/工作負載(虛擬化和私有雲端、高效能運算、其他)進行細分。市場預測以美元計價。
中國資料中心伺服器市場趨勢及洞察。
人工智慧和GPU加速工作負載的需求激增
阿里巴巴的「同義千文」和百度的「ERNIE」等大規模語言模型需要由8路GPU節點組成的叢集,並透過400GbE或InfiniBand網路互連,導致典型的機架密度超過70kW。營運商計劃在2025年採購約100萬塊Nvidia H2O GPU,並結合客製化冷板迴路以最大化吞吐量,儘管其峰值浮點運算效能較低。華為的「昇騰910B」(由中芯國際代工)正在國營企業中搶佔市場佔有率,這些企業更注重供應鏈自主性而非突破性的基準性能。根據工信部的報告,到2025年初,智慧運算設備的部署量將成長45%,是通用伺服器成長速度的三倍。這些趨勢正在推高平均售價,加速NVMe儲存的普及,並進一步增強中國資料中心伺服器市場的整體發展勢頭。
企業雲端採用率不斷提高,公共雲端即服務 (IaaS) 支出也在增加。
根據中國資訊通訊研究院(CAICT)估計,到2025年底,38%的企業工作負載預計將在公共雲端或混合雲端上運作,高於2023年的29%。騰訊雲承諾在2030年投資100億美元在天津、重慶和清遠建設新的園區,這將推動對高密度底盤的需求成長。阿里雲第五代ECS實例採用基於ARM架構的「依天710」晶片,與先前的x86架構機型相比,每個虛擬機器的成本降低了20%。百度營運超過50萬台伺服器,並計畫在2026年再部署10萬台,因此,供應商能否成功取決於訂單。這種集中化趨勢進一步增強了採購能力,並推動了整個中國資料中心伺服器市場朝向客製化方向發展的趨勢。
一線城市中心面臨高資本支出 (CapEx) 和電力、土地短缺的問題。
到2025年,北京宜莊和上海臨港的土地價格平均將達到每英畝1500萬元人民幣(約210萬美元),但北京市的電力上限規定每個項目的新增配額不得超過50兆瓦。在深圳,PUE值超過1.25的設施建設被禁止,這實際上強制要求採用液冷技術,並使初始成本增加20%。營運商要么在成都或武漢(地價約為深圳的三分之一)維修通訊交換機,要么確保容量並預留一級機架用於高密度GPU叢集。這種兩極化的策略增加了物流複雜性,減緩了都市區擴張速度,並抑制了中國資料中心伺服器市場的短期成長速度。
細分市場分析
到2025年,三級資料中心將佔總裝置容量的71.24%,其價值在於成本和99.982%的運轉率。同時,四級資料中心的容量正以20.31%的複合年成長率成長,因為金融機構和公共雲端供應商需要保護運作人工智慧訓練業務免受中斷的影響。 2025年,中國建設銀行報告稱,其12個四級資料中心將託管分散式帳本結算工作負載,且不會發生非計劃性停機。保險公司和醫院也正在效仿,以滿足99.995%的可用性要求。供應商正在提供具有雙路徑架構和所有組件熱插拔功能的刀鋒伺服器平台,雖然提高了平均售價(ASP),但最大限度地減少了停機造成的損失。
對價格敏感的中小型企業仍然青睞Tier 3託管機架,其價格比Tier 4機櫃便宜約30%,這推動了單一供應商風冷伺服器的大規模升級。預製的Tier 3機櫃單元可在六個月內交付,非常適合中國軟體公司快速迭代的文化。因此,中國資料中心伺服器市場保持兩極化的結構,高利潤的Tier 4節點成長最快,而Tier 3節點仍佔據出貨量的大部分。
超大規模資料中心園區(容納超過1萬台伺服器)預計到2025年將佔全球伺服器組裝機量的40.54%,並正以20.14%的複合年成長率快速擴張,主要得益於阿里雲、騰訊雲和百度雲在內陸地區不斷增設新的資料中心。阿里巴巴計畫在2025年營運七個這樣的資料中心園區,並已宣布計畫在成都和武漢再建兩個。每個園區的設計容量為8萬個液冷式機架。大量採購可享最高30%的折扣,並支援客製化半導體晶片的聯合設計。
對於優先考慮本地管理且缺乏超大規模預算的區域性網路服務供應商、省級政府和產業中心而言,大型(1000-10000台)和中型(100-1000台)資料中心仍然至關重要。隨著「雲端優先」策略的推進,規模小規模的本地資料中心正在逐步淘汰,替代需求轉向共用資料中心。由此產生的規模兩極化正集中各方議價能力,並塑造中國資料中心伺服器市場的藍圖。
其他好處:
- Excel格式的市場預測(ME)表
- 3個月的分析師支持
目錄
第1章:引言
- 研究假設和市場定義
- 調查範圍
第2章:調查方法
第3章執行摘要
第4章 市場狀況
- 市場概覽
- 市場促進因素
- 人工智慧和GPU加速的工作負載需求激增。
- 企業雲端採用率不斷提高,對公共雲端即服務 (IaaS) 的支出也在增加。
- 5G的快速普及正在推動邊緣資料中心的擴張。
- 政府對數位基礎設施的激勵和補貼
- 水下資料中心的商業化以實現永續冷卻
- 一體化工廠機櫃的交付縮短了實施前置作業時間。
- 市場限制因素
- 關鍵地點資本投資成本高,電力和土地短缺。
- 出口限制阻礙了尖端GPU和CPU的取得。
- AI伺服器組件的先進封裝生產能力面臨瓶頸。
- 水資源使用限制為液冷技術的規模化應用帶來了挑戰。
- 產業供應鏈分析
- 監理情勢
- 技術展望
- 波特五力分析
- 對影響市場的宏觀經濟因素進行評估
第5章 市場規模與成長預測
- 層級特定
- 一級和二級
- 三級
- 第四級
- 按資料中心規模
- 小規模資料中心
- 中型資料中心
- 大型資料中心
- 超大規模資料中心
- 依資料中心類型
- 託管資料中心
- 超大規模資料中心業者資料中心/雲端服務供應商
- 企業和邊緣資料中心
- 按外形規格
- 半高刀片
- 全高刀片
- 四分之一高度/微刀片
- 按應用程式/工作負載
- 虛擬化和私有雲端
- 高效能運算(HPC)
- 人工智慧/機器學習和數據分析
- 以儲存為中心
- 邊緣/物聯網閘道器
第6章 競爭情勢
- 市場集中度
- 策略趨勢
- 市佔率分析
- 公司簡介
- Dell Technologies Inc.
- Huawei Technologies Co., Ltd.
- Lenovo Group Limited
- New H3C Technologies Co., Ltd.
- Inspur Group(IEIT Systems Co., Ltd.)
- Dawning Information Industry Co., Ltd.(Sugon)
- Super Micro Computer, Inc.
- Hewlett Packard Enterprise Company
- ZTE Corporation(Server Division)
- NVIDIA Corporation(Server Systems)
- Phytium Technology Co., Ltd.
- Hygon Information Technology Co., Ltd.
- Shanghai Zhaoxin Semiconductor Co., Ltd.
- Alibaba Cloud Computing Co., Ltd.
- Tencent Cloud Computing(Beijing)Co., Ltd.
- Baidu Cloud(Baidu Inc.)
- Cambricon Technologies Corporation Limited
- Foxconn Technology Group(Data Center ODM)
- HiSilicon Technologies Co., Ltd.
第7章 市場機會與未來展望
According to Mordor Intelligence, the China data center server market size was valued at USD 12.95 billion in 2025 and is estimated to grow from USD 15.36 billion in 2026 to reach USD 36.68 billion by 2031, at a CAGR of 19.02% during the forecast period (2026-2031).
This report is Segmented by Tier Type (Tier 1 and 2, and More), Data Center Size (Small, Medium, and More), Data Center Type (Colocation, Hyperscalers/CSPs, and More), Form Factor (Half-Height Blades, Full-Height Blades, and More), Application/Workload (Virtualization and Private Cloud, HPC, and More). Market Forecasts are Provided in Terms of Value (USD).
China Data Center Server Market Trends and Insights
Surge in AI and GPU-Accelerated Workload Demand
Large language models such as Alibaba's Tongyi Qianwen and Baidu's ERNIE require clusters of eight-way GPU nodes linked by 400 GbE or InfiniBand fabrics, pushing typical rack densities above 70 kW. Operators purchased roughly 1 million Nvidia H20 GPUs in 2025, pairing them with custom cold-plate loops to maximize throughput despite lower peak flops. Huawei's Ascend 910B, fabricated at SMIC, is winning share among state-owned enterprises prioritizing supply-chain sovereignty over raw benchmark records. The Ministry of Industry and Information Technology reported a 45% jump in intelligent-computing power installations in early 2025, triple the growth of general-purpose servers. These dynamics lift average selling prices, accelerate adoption of NVMe storage, and magnify the overall momentum of the China data center server market.
Rising Enterprise Cloud Adoption and Public Cloud IaaS Spending
CAICT estimated that 38% of enterprise workloads ran on public or hybrid clouds by end-2025, up from 29% in 2023. Tencent Cloud pledged USD 10 billion through 2030 for new campuses in Tianjin, Chongqing, and Qingyuan, heightening bulk demand for high-density chassis. Alibaba Cloud's fifth-generation ECS instances, powered by ARM-based Yitian 710 chips, trimmed per-VM cost by 20% relative to x86 predecessors. With Baidu operating more than 500,000 servers and planning 100,000 more in 2026, vendor success hinges on securing hyperscale design wins. This concentration further solidifies purchasing power and shapes customization trends across the China data center server market.
High CapEx and Power-Land Scarcity in Tier 1 Hubs
Land in Beijing's Yizhuang and Shanghai's Lingang averaged CNY 15 million (USD 2.1 million) per acre in 2025, while municipal power caps hold new allocations to 50 MW per project. Shenzhen bans builds with PUE above 1.25, effectively mandating liquid cooling and adding 20% to upfront spend. Operators retrofit telecom exchanges or source capacity in Chengdu and Wuhan where land costs one-third as much, then reserve Tier 1 racks for GPU-dense clusters. The bifurcated strategy increases logistical complexity and slows urban expansion, curbing near-term velocity for the China data center server market.
Other drivers and restraints analyzed in the detailed report include:
- Rapid 5G Roll-Out Catalyzing Edge Data Center Expansion
- Government Digital-Infrastructure Incentives and Subsidies
- Export Controls Limiting Access to Cutting-Edge GPUs and CPUs
For complete list of drivers and restraints, kindly check the Table Of Contents.
Segment Analysis
Tier 3 facilities held 71.24% of 2025 installations, underscoring their balance of cost and 99.982% uptime, while Tier 4 capacity is rising at a 20.31% CAGR as finance and public-cloud operators safeguard AI training runs from interruption. In 2025, China Construction Bank reported 12 Tier 4 sites that hosted distributed-ledger settlement workloads without unscheduled outages. Insurance carriers and hospitals follow suit to comply with 99.995% availability mandates. Vendors cater with blade platforms featuring dual-path fabrics and hot-swap everything, elevating ASPs but minimizing downtime penalties.
Price-sensitive SMEs continue to favor Tier 3 colocation racks that cost roughly 30% less than Tier 4 cabinets, fueling resilient refresh for single-supply air-cooled servers. Prefabricated Tier 3 pods, deliverable in six months, suit the rapid iteration culture of Chinese software firms. Consequently, the China data center server market sustains a dual-track mix, where high-margin Tier 4 nodes grow fastest yet Tier 3 still anchors shipment volume.
Hyperscale campuses with more than 10,000 servers commanded 40.54% of installed units in 2025 and are progressing at a 20.14% CAGR as Alibaba Cloud, Tencent Cloud, and Baidu Cloud add greenfield sites inland. Alibaba operated seven such campuses in 2025 and announced two more in Chengdu and Wuhan, each designed for 80,000 liquid-cooled racks. Volume buys secure up to 30% list-price discounts and enable co-design of custom silicon.
Large (1,000-10,000 servers) and medium (100-1,000) facilities remain vital for regional ISPs, provincial governments, and industrial hubs that crave local control but lack hyperscale budgets. Small on-premise rooms are retiring as cloud-first mandates take hold, redirecting replacement demand into shared facilities. The resulting scale polarization concentrates bargaining power and defines roadmaps for the China data center server market.
Complete Report Scope:
- By Tier Type
- Tier 1 and 2
- Tier 3
- Tier 4
- By Data Center Size
- Small Data Center
- Medium Data Center
- Large Data Center
- Hyperscale Data Center
- By Data Center Type
- Colocation Data Center
- Hyperscalers Data Center/CSPs
- Enterprise and Edge Data Center
- By Form Factor
- Half-height Blades
- Full-height Blades
- Quarter-height / Micro-blades
- By Application / Workload
- Virtualisation and Private Cloud
- High-Performance Computing (HPC)
- Artificial Intelligence/Machine Learning and Data Analytics
- Storage-centric
- Edge / IoT Gateways
List of Companies Covered in this Report:
- Dell Technologies Inc.
- Huawei Technologies Co., Ltd.
- Lenovo Group Limited
- New H3C Technologies Co., Ltd.
- Inspur Group (IEIT Systems Co., Ltd.)
- Dawning Information Industry Co., Ltd. (Sugon)
- Super Micro Computer, Inc.
- Hewlett Packard Enterprise Company
- ZTE Corporation (Server Division)
- NVIDIA Corporation (Server Systems)
- Phytium Technology Co., Ltd.
- Hygon Information Technology Co., Ltd.
- Shanghai Zhaoxin Semiconductor Co., Ltd.
- Alibaba Cloud Computing Co., Ltd.
- Tencent Cloud Computing (Beijing) Co., Ltd.
- Baidu Cloud (Baidu Inc.)
- Cambricon Technologies Corporation Limited
- Foxconn Technology Group (Data Center ODM)
- HiSilicon Technologies Co., Ltd.
Additional Benefits:
- The market estimate (ME) sheet in Excel format
- 3 months of analyst support
TABLE OF CONTENTS
1 INTRODUCTION
- 1.1 Study Assumptions and Market Definition
- 1.2 Scope of the Study
2 RESEARCH METHODOLOGY
3 EXECUTIVE SUMMARY
4 MARKET LANDSCAPE
- 4.1 Market Overview
- 4.2 Market Drivers
- 4.2.1 Surge in AI and GPU-Accelerated Workload Demand
- 4.2.2 Rising Enterprise Cloud Adoption and Public Cloud IaaS Spending
- 4.2.3 Rapid 5G Roll-Out Catalyzing Edge Data Center Expansion
- 4.2.4 Government Digital-Infrastructure Incentives and Subsidies
- 4.2.5 Commercialization of Underwater Data Centers for Sustainable Cooling
- 4.2.6 Factory-Integrated Cabinet Delivery Shortening Deployment Lead Times
- 4.3 Market Restraints
- 4.3.1 High CapEx and Power-Land Scarcity in Tier-1 Hubs
- 4.3.2 Export Controls Limiting Access to Cutting-Edge GPUs and CPUs
- 4.3.3 Advanced Packaging Capacity Bottlenecks for AI Server Components
- 4.3.4 Water-Use Restrictions Challenging Liquid-Cooling Scale-Up
- 4.4 Industry Supply-Chain Analysis
- 4.5 Regulatory Landscape
- 4.6 Technological Outlook
- 4.7 Porter's Five Forces Analysis
- 4.7.1 Threat of New Entrants
- 4.7.2 Bargaining Power of Buyers
- 4.7.3 Bargaining Power of Suppliers
- 4.7.4 Threat of Substitutes
- 4.7.5 Intensity of Competitive Rivalry
- 4.8 Assesment of Macroeconomic Factors on the Market
5 MARKET SIZE AND GROWTH FORECASTS (VALUE)
- 5.1 By Tier Type
- 5.1.1 Tier 1 and 2
- 5.1.2 Tier 3
- 5.1.3 Tier 4
- 5.2 By Data Center Size
- 5.2.1 Small Data Center
- 5.2.2 Medium Data Center
- 5.2.3 Large Data Center
- 5.2.4 Hyperscale Data Center
- 5.3 By Data Center Type
- 5.3.1 Colocation Data Center
- 5.3.2 Hyperscalers Data Center/CSPs
- 5.3.3 Enterprise and Edge Data Center
- 5.4 By Form Factor
- 5.4.1 Half-height Blades
- 5.4.2 Full-height Blades
- 5.4.3 Quarter-height / Micro-blades
- 5.5 By Application / Workload
- 5.5.1 Virtualisation and Private Cloud
- 5.5.2 High-Performance Computing (HPC)
- 5.5.3 Artificial Intelligence/Machine Learning and Data Analytics
- 5.5.4 Storage-centric
- 5.5.5 Edge / IoT Gateways
6 COMPETITIVE LANDSCAPE
- 6.1 Market Concentration
- 6.2 Strategic Moves
- 6.3 Market Share Analysis
- 6.4 Company Profiles (Includes Global Level Overview, Market Level Overview, Core Segments, Financials as Available, Strategic Information, Market Rank/Share, Products and Services, and Recent Developments)
- 6.4.1 Dell Technologies Inc.
- 6.4.2 Huawei Technologies Co., Ltd.
- 6.4.3 Lenovo Group Limited
- 6.4.4 New H3C Technologies Co., Ltd.
- 6.4.5 Inspur Group (IEIT Systems Co., Ltd.)
- 6.4.6 Dawning Information Industry Co., Ltd. (Sugon)
- 6.4.7 Super Micro Computer, Inc.
- 6.4.8 Hewlett Packard Enterprise Company
- 6.4.9 ZTE Corporation (Server Division)
- 6.4.10 NVIDIA Corporation (Server Systems)
- 6.4.11 Phytium Technology Co., Ltd.
- 6.4.12 Hygon Information Technology Co., Ltd.
- 6.4.13 Shanghai Zhaoxin Semiconductor Co., Ltd.
- 6.4.14 Alibaba Cloud Computing Co., Ltd.
- 6.4.15 Tencent Cloud Computing (Beijing) Co., Ltd.
- 6.4.16 Baidu Cloud (Baidu Inc.)
- 6.4.17 Cambricon Technologies Corporation Limited
- 6.4.18 Foxconn Technology Group (Data Center ODM)
- 6.4.19 HiSilicon Technologies Co., Ltd.
7 MARKET OPPORTUNITIES AND FUTURE OUTLOOK
- 7.1 White-Space and Unmet-Need Assessment

 2026年全球資料中心和伺服器半導體市場報告
 北美資料中心伺服器:市佔率分析、產業趨勢與統計及成長預測(2026-2031 年)印度資料中心伺服器:市場佔有率分析、產業趨勢與統計及成長預測(2026-2032 年)日本資料中心伺服器:市佔率分析、產業趨勢與統計及成長預測(2026-2031)歐洲資料中心伺服器:市場佔有率分析、產業趨勢與統計及成長預測(2026-2031 年)美國資料中心伺服器:市場佔有率分析、產業趨勢與統計及成長預測(2026-2031 年)越南資料中心伺服器:市場佔有率分析、產業趨勢與統計及成長預測(2026-2031)馬來西亞資料中心伺服器:市場佔有率分析、產業趨勢與統計及成長預測(2026-2031 年)
 資料中心和伺服器半導體市場報告:趨勢、預測和競爭分析(至2035年)
 資料中心伺服器市場規模、佔有率、成長率、全球產業分析、區域趨勢以及 2026 年至 2034 年的預測。