


 |
市場調查報告書
商品編碼
2119752
北美資料中心伺服器:市佔率分析、產業趨勢與統計及成長預測(2026-2031 年)North America Data Center Server - Market Share Analysis, Industry Trends & Statistics, Growth Forecasts (2026 - 2031) |
||||||

※ 本網頁內容可能與最新版本有所差異。詳細情況請與我們聯繫。
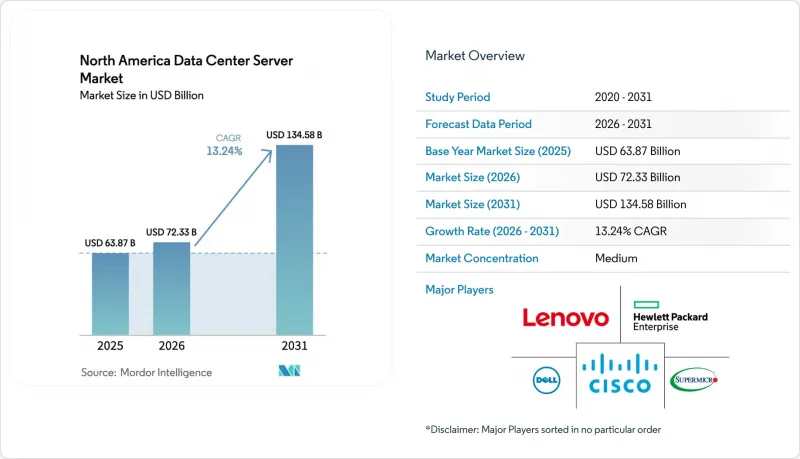
根據 Mordor Intelligence 預測,北美資料中心伺服器市場規模將從 2025 年的 638.7 億美元成長到 2026 年的 723.3 億美元,然後在 2031 年達到 1345.8 億美元,2026 年至 2031 年的複合年成長率為 13.24%。
本報告以「類型」(一級、二級等)、「外形規格」(半高刀片式等)、「最終用戶產業」(銀行、金融服務和保險、製造業等)、「資料中心類型」(超大規模資料中心業者/雲端服務供應商等)和「應用程式/工作負載」(虛擬化和私有雲端、以儲存為中心的應用程式等)對產業進行分類。市場預測以美元計價。
北美資料中心伺服器市場趨勢與洞察
AI/ML訓練對高密度GPU伺服器的需求
人工智慧 (AI) 工作負載已佔資料中心電力消耗量的五分之一,迫使營運商對其機架進行現代化改造,以適應超高密度和核心站點液冷的需求。 NVIDIA 預測的 1.4 兆美元資料中心市場機會正在加速採購每底盤最多可容納 8 個 GPU 的專用伺服器。 Super Micro 的 10 萬個 GPU 液冷叢集顯示市場正在向直接冷卻架構轉變。 X 公司向 HPE 訂購的訂單10 億美元的產品表明,大規模私人買家在單筆交易規模方面如今已能與超大規模資料中心業者相媲美。這些變化正在鞏固高密度 AI 機架作為北美資料中心伺服器市場主要成長引擎的地位。
商用 5G 的部署正在推動邊緣基礎架構的擴展。
憑藉超低延遲的 5G 服務,運算資源正從核心園區轉移到大都會圈邊緣站點,這些站點到終端用戶的往返延遲低於個位數毫秒。 「GPU 即服務」計劃,例如 Cologix Toronto 等微型託管中心推出的計劃,證實了人工智慧推理將擴大部署在邊緣。為此,伺服器 OEM 廠商正在推出四分之一高度和其他微型刀片設計,這些設計針對淺機架和有限的安裝空間進行了最佳化。這種分散式拓撲結構為本地光纖營運商和地方政府公共產業提供了新的收入來源,他們可以確保綠能供應和存取權。這一趨勢正在推動北美資料中心伺服器市場邊緣系統實現兩位數的成長。
資料中心資本支出(CapEx)和土地成本不斷上漲。
在勞登縣和聖克拉拉縣,投機性房地產競標已使地塊價格在18個月內加倍,導致待開發區項目的預算遠遠超出最初的預期。如果將人工智慧伺服器所需的液冷迴路和高電流母線槽等建設項目也計算在內,建設成本還會進一步增加。儘管市場需求依然強勁,微軟和亞馬遜還是選擇推遲幾個已規劃站點的建設,並將資金重新分配到地價較低的次要地區。固定的土地溢價正在推高租金,這可能會減緩小規模參與企業的擴張速度。除非透過加快核准流程和變更用途來獲得新的地塊,否則北美資料中心伺服器市場很可能面臨週期性的供不應求。
細分市場分析
在北美資料中心伺服器市場,預計到2025年,Tier 3級資料中心將佔總營收的74.60%,這凸顯了其對需要N+1容錯能力但又不具備2N級架構成本效益的企業工作負載的吸引力。 Tier 3級資料中心的架構規格能夠滿足大多數虛擬化、備份和雲端閘道器任務的需求,同時保持良好的營運經濟性。然而,擁有數兆參數的超大規模資料中心業者中心營運商目前正將目光轉向Tier 4級環境,在這些環境中,並行維護和容錯能力對於確保價值數百萬美元的GPU叢集不間斷運作至關重要。因此,預計到2031年,Tier 4級資料中心的營收將以18.56%的複合年成長率成長,其在北美資料中心伺服器市場的佔有率也將逐步提升。
四級資料中心的快速成長推動了模組化資料中心的創新,預先配置的鋰離子UPS、後門熱交換器和冗餘脊葉式網路架構等技術應運而生。 Vertiv等廠商近期推出了工廠整合的「360AI」模組,將部署時間縮短至26週以內,比傳統的待開發區專案快數月。同時,一級和二級資料中心在內容快取、本地製造執行系統和其他邊緣運算方面仍然發揮著重要作用。在整個預測期內,多層資料中心的共存將增強工作負載部署的柔軟性,並維持北美資料中心伺服器市場的多元化收入來源。
預計到2025年,半高刀鋒伺服器將佔據61.55%的市場佔有率,因為企業仍然青睞熟悉的42U機架,這種機架在計算密度和氣流需求之間取得了平衡。此設計支援雙路x86主機板,電力消耗量適中,並最大限度地減少了對散熱系統的維修。然而,受物聯網和5G工作負載伴隨的邊緣基礎設施擴張的推動,北美資料中心伺服器市場中微型刀鋒和四分之一高伺服器的市場規模預計將以17.92%的複合年成長率成長,成為成長最快的市場。
四分之一高度的機架可以安裝在空間和重量受限的場所,例如電信業者的街邊機櫃和工廠的機房。系統晶片(SoC) 架構和 PCIe Gen5 的進步使得供應商能夠將 AI 加速器整合到這些緊湊的機架中,從而實現即時推理。雖然全高刀片伺服器仍用於高效能運算 (HPC) 和石油天然氣產業的探勘影像處理,但其成長放緩表明市場正在轉向更小、更節能的節點。因此,營運商可以擴展其產品組合,例如,在核心網路中部署高密度 AI 訓練機架,並將其與城域環網中的輕量級微型刀片伺服器相結合,從而進一步提升北美資料中心伺服器市場的整體價值提案。
其他好處:
- Excel格式的市場預測(ME)表
- 3個月的分析師支持
目錄
第1章:引言
- 研究假設和市場定義
- 調查範圍
第2章:調查方法
第3章執行摘要
第4章 市場狀況
- 市場概覽
- 市場促進因素
- 擴大雲端和物聯網工作負載的採用
- 商用 5G 的部署正在推動邊緣基礎架構的擴展。
- 對配備大量GPU的伺服器上的AI/ML訓練的需求。
- 加拿大和墨西哥的資料主權義務
- 持續硬體更新周期(營運支出模式)
- 為美國公部門設計本地主權雲
- 市場限制因素
- 資料中心資本支出(CapEx)和土地成本不斷上漲。
- 客製化半導體供應鏈的可變性
- 主要都會大都會圈電網面臨的限制因素
- 永續性/範圍 3 排放合規性
- 供應鏈分析
- 監理情勢
- 技術展望
- 波特五力分析
- 評估宏觀經濟趨勢對市場的影響
第5章 市場規模與成長預測
- 資料中心層級
- 一級和二級
- 三級
- 第四級
- 按外形規格
- 半高刀片
- 全高刀片
- 四分之一高度/微刀片
- 按應用程式/工作負載
- 虛擬化和私有雲端
- 高效能運算(HPC)
- 人工智慧/機器學習和數據分析
- 以儲存為中心
- 邊緣/物聯網閘道器
- 依資料中心類型
- 超大規模資料中心業者雲端服務供應商/雲端服務供應商
- 託管設施
- 企業和邊緣運算
- 按最終用途行業分類
- BFSI
- 資訊科技/通訊
- 醫療保健和生命科學
- 製造業和工業4.0
- 能源公用事業
- 政府/國防
- 地區
- 美國
- 加拿大
- 墨西哥
第6章 競爭情勢
- 市場集中度
- 策略趨勢
- 市佔率分析
- 公司簡介
- Dell Technologies Inc.
- Hewlett Packard Enterprise Co.
- Lenovo Group Ltd.
- Cisco Systems Inc.
- IBM Corporation
- Super Micro Computer Inc.
- Quanta Computer Inc.
- Wiwynn Corp.
- Inspur Group
- Foxconn Technology Group
- Gigabyte Technology Co. Ltd.
- Fujitsu Ltd.
- Oracle Corporation
- NEC Corp.
- AMAX Information Technologies
- Penguin Computing(SMART Global)
- ASUStek Computer Inc.
- Hewlett-Packard Enterprise Services
- Huawei Technologies Co. Ltd.*
- Tyan Computer Corp.
第7章 市場機會與未來展望
According to Mordor Intelligence, the North America data center server market size is expected to grow from USD 63.87 billion in 2025 to USD 72.33 billion in 2026 and is forecast to reach USD 134.58 billion by 2031 at 13.24% CAGR over 2026-2031.
This report Segments the Industry Into Type (Tier 1, Tier 2, and More), Form Factor(Half-Height Blades, and More), End-User Verticals (BFSI, Manufacturing, and More), Data Center Type(Hyperscalers/Cloud Service Provider, and More) and by Application / Workload (Virtualisation and Private Cloud, Storage-Centric and More). The Market Forecasts are Provided in Terms of Value (USD).
North America Data Center Server Market Trends and Insights
AI/ML Training Demand for GPU-Dense Servers
Artificial-intelligence workloads already consume up to one-fifth of data-center electricity, forcing operators to revamp racks for extreme densities and liquid cooling coresite. NVIDIA's US 1.4 trillion data-center opportunity projection has accelerated procurement of specialized servers that can host as many as eight GPUs per chassis. Super Micro's 100,000-GPU liquid-cooled cluster illustrates the market's pivot toward direct-cooling architectures. HPE's USD 1 billion order from X signals that large private buyers now rival hyperscalers on single-deal size. These shifts cement high-density AI racks as the primary growth engine for the North America data center server market.
Commercial 5G Roll-outs Driving Edge Build-outs
Ultra-low-latency 5G services are steering compute away from core campuses toward metropolitan edge sites that sit within a one-digit-millisecond round-trip of end users. GPU-as-a-service launches inside micro-colo hubs such as Cologix Toronto provide proof that AI inference will increasingly reside at the edge. Server OEMs have responded by releasing quarter-height and other micro-blade designs tuned for shallow racks and constrained footprints. This distributed topology unlocks new revenue for regional fiber operators and municipal utilities that can guarantee clean power and right-of-way permits. The trend sustains a double-digit expansion streak for edge systems within the broader North America data center server market.
Escalating Data-Center CapEx and Land Costs
Speculative real-estate bidding in Loudoun County and Santa Clara has doubled parcel prices within 18 months, inflating greenfield project budgets well above earlier pro-formas. Build costs rise further when liquid-cooling loops and high-amp busways required by AI servers are included. Microsoft and Amazon have slowed several planned sites, choosing to redeploy capital to secondary regions with cheaper acreage while demand remains intact. Locked-in land premiums cascade through lease rates, potentially delaying smaller entrants' expansion. Unless permitting fast-tracks or rezoning unlocks fresh parcels, the North America data center server market could experience periodic supply gaps.
Other drivers and restraints analyzed in the detailed report include:
- Rising Adoption of Cloud and IoT Workloads
- Data-Sovereignty Mandates in Canada and Mexico
- Grid-Power Constraints in Key Metros
For complete list of drivers and restraints, kindly check the Table Of Contents.
Segment Analysis
Tier 3 facilities captured 74.60% of 2025 revenue in the North America data center server market, underscoring their appeal for enterprise workloads requiring N+1 resilience without the premium of 2N architectures. Tier 3 build specifications satisfy most virtualization, backup and cloud-gateway tasks while retaining favorable operating economics. Yet hyperscalers training multi-trillion-parameter models now prize Tier 4 environments where concurrent maintenance and fault tolerance are mandatory for uninterrupted GPU clusters that cost tens of millions of USD. As a result, Tier 4 revenue is projected to rise 18.56% CAGR through 2031, gradually lifting its North America data center server market size contribution.
The Tier 4 surge has spurred innovations in modular data halls pre-configured with lithium-ion UPS, rear-door heat exchangers and redundant spine-leaf fabrics. Vendors such as Vertiv recently introduced factory-integrated "360AI" blocks that shorten deployment to under 26 weeks, shaving months off customary greenfield schedules. Meanwhile, Tier 1 and Tier 2 camps remain useful for content caching, local manufacturing execution systems and other edge roles. Over the forecast window, the coexistence of multiple tiers improves workload placement flexibility, sustaining diverse revenue streams inside the North America data center server market.
Half-height blades held a commanding 61.55% share in 2025 as enterprises continue to favor familiar 42-U racks that balance compute density with airflow requirements. The design supports two-socket x86 boards paired with modest power budgets, keeping cooling retrofits minimal. However, the North America data center server market size for micro-blade and quarter-height systems is projected to grow fastest at 17.92% CAGR, propelled by the edge build-out associated with IoT and 5G workloads.
Quarter-height frames can slip into telco street cabinets or factory closets where space and weight are constrained. Advancements in system-on-chip architecture and PCIe Gen5 have allowed vendors to embed AI accelerators onto these compact sleds, making them useful for real-time inference. Full-height blades continue to serve HPC and oil-and-gas seismic imaging, yet their marginal growth underscores a pivot toward smaller, power-efficient nodes. The net effect is an expanding portfolio that lets operators mix dense AI training racks at the core with lightweight micro-blades in metro rings, enriching the overall value proposition of the North America data center server market.
Complete Report Scope:
- By Data-Center Tier
- Tier 1 and 2
- Tier 3
- Tier 4
- By Form Factor
- Half-height Blades
- Full-height Blades
- Quarter-height / Micro-blades
- By Application / Workload
- Virtualisation and Private Cloud
- High-Performance Computing (HPC)
- Artificial Intelligence/Machine Learning and Data Analytics
- Storage-centric
- Edge / IoT Gateways
- By Data Center Type
- Hyperscalers/Cloud Service Provider
- Colocation Facilities
- Enterprise and Edge
- By End-use Industry
- BFSI
- IT and Telecom
- Healthcare and Life-Sciences
- Manufacturing and Industry 4.0
- Energy and Utilities
- Government and Defence
- Geography
- United States
- Canada
- Mexico
List of Companies Covered in this Report:
- Dell Technologies Inc.
- Hewlett Packard Enterprise Co.
- Lenovo Group Ltd.
- Cisco Systems Inc.
- IBM Corporation
- Super Micro Computer Inc.
- Quanta Computer Inc.
- Wiwynn Corp.
- Inspur Group
- Foxconn Technology Group
- Gigabyte Technology Co. Ltd.
- Fujitsu Ltd.
- Oracle Corporation
- NEC Corp.
- AMAX Information Technologies
- Penguin Computing (SMART Global)
- ASUStek Computer Inc.
- Hewlett-Packard Enterprise Services
- Huawei Technologies Co. Ltd.*
- Tyan Computer Corp.
Additional Benefits:
- The market estimate (ME) sheet in Excel format
- 3 months of analyst support
TABLE OF CONTENTS
1 INTRODUCTION
- 1.1 Study Assumptions and Market Definition
- 1.2 Scope of the Study
2 RESEARCH METHODOLOGY
3 EXECUTIVE SUMMARY
4 MARKET LANDSCAPE
- 4.1 Market Overview
- 4.2 Market Drivers
- 4.2.1 Rising adoption of cloud and IoT workloads
- 4.2.2 Commercial 5 G roll-outs driving edge build-outs
- 4.2.3 AI/ML training demand for GPU-dense servers
- 4.2.4 Data-sovereignty mandates in Canada and Mexico
- 4.2.5 Evergreen hardware refresh cycles (Opex model)
- 4.2.6 On-prem sovereign cloud designs for U.S. public sector
- 4.3 Market Restraints
- 4.3.1 Escalating data-center CapEx and land costs
- 4.3.2 Supply-chain volatility for custom silicon
- 4.3.3 Grid-power constraints in key metros
- 4.3.4 Sustainability / Scope-3 emissions compliance
- 4.4 Supply-Chain Analysis
- 4.5 Regulatory Landscape
- 4.6 Technological Outlook
- 4.7 Porter's Five Forces Analysis
- 4.7.1 Threat of New Entrants
- 4.7.2 Bargaining Power of Buyers
- 4.7.3 Bargaining Power of Suppliers
- 4.7.4 Threat of Substitutes
- 4.7.5 Intensity of Competitive Rivalry
- 4.8 Assessment of the Impact on Macro Economic Trends on the Market
5 MARKET SIZE AND GROWTH FORECASTS (VALUES)
- 5.1 By Data-Center Tier
- 5.1.1 Tier 1 and 2
- 5.1.2 Tier 3
- 5.1.3 Tier 4
- 5.2 By Form Factor
- 5.2.1 Half-height Blades
- 5.2.2 Full-height Blades
- 5.2.3 Quarter-height / Micro-blades
- 5.3 By Application / Workload
- 5.3.1 Virtualisation and Private Cloud
- 5.3.2 High-Performance Computing (HPC)
- 5.3.3 Artificial Intelligence/Machine Learning and Data Analytics
- 5.3.4 Storage-centric
- 5.3.5 Edge / IoT Gateways
- 5.4 By Data Center Type
- 5.4.1 Hyperscalers/Cloud Service Provider
- 5.4.2 Colocation Facilities
- 5.4.3 Enterprise and Edge
- 5.5 By End-use Industry
- 5.5.1 BFSI
- 5.5.2 IT and Telecom
- 5.5.3 Healthcare and Life-Sciences
- 5.5.4 Manufacturing and Industry 4.0
- 5.5.5 Energy and Utilities
- 5.5.6 Government and Defence
- 5.6 Geography
- 5.6.1 United States
- 5.6.2 Canada
- 5.6.3 Mexico
6 COMPETITIVE LANDSCAPE
- 6.1 Market Concentration
- 6.2 Strategic Moves
- 6.3 Market Share Analysis
- 6.4 Company Profiles (includes Global level Overview, Market level overview, Core Segments, Financials as available, Strategic Information, Market Rank/Share for key companies, Products and Services, and Recent Developments)
- 6.4.1 Dell Technologies Inc.
- 6.4.2 Hewlett Packard Enterprise Co.
- 6.4.3 Lenovo Group Ltd.
- 6.4.4 Cisco Systems Inc.
- 6.4.5 IBM Corporation
- 6.4.6 Super Micro Computer Inc.
- 6.4.7 Quanta Computer Inc.
- 6.4.8 Wiwynn Corp.
- 6.4.9 Inspur Group
- 6.4.10 Foxconn Technology Group
- 6.4.11 Gigabyte Technology Co. Ltd.
- 6.4.12 Fujitsu Ltd.
- 6.4.13 Oracle Corporation
- 6.4.14 NEC Corp.
- 6.4.15 AMAX Information Technologies
- 6.4.16 Penguin Computing (SMART Global)
- 6.4.17 ASUStek Computer Inc.
- 6.4.18 Hewlett-Packard Enterprise Services
- 6.4.19 Huawei Technologies Co. Ltd.*
- 6.4.20 Tyan Computer Corp.
7 MARKET OPPORTUNITIES and FUTURE OUTLOOK
- 7.1 White-space and Unmet-need Assessment

 2026年全球資料中心和伺服器半導體市場報告
 中國資料中心伺服器:市場佔有率分析、產業趨勢與統計及成長預測(2026-2031)印度資料中心伺服器:市場佔有率分析、產業趨勢與統計及成長預測(2026-2032 年)日本資料中心伺服器:市佔率分析、產業趨勢與統計及成長預測(2026-2031)歐洲資料中心伺服器:市場佔有率分析、產業趨勢與統計及成長預測(2026-2031 年)美國資料中心伺服器:市場佔有率分析、產業趨勢與統計及成長預測(2026-2031 年)越南資料中心伺服器:市場佔有率分析、產業趨勢與統計及成長預測(2026-2031)馬來西亞資料中心伺服器:市場佔有率分析、產業趨勢與統計及成長預測(2026-2031 年)
 資料中心和伺服器半導體市場報告:趨勢、預測和競爭分析(至2035年)
 資料中心伺服器市場規模、佔有率、成長率、全球產業分析、區域趨勢以及 2026 年至 2034 年的預測。