


 |
市場調查報告書
商品編碼
2125555
電動車:市場佔有率分析、產業趨勢與統計、成長預測(2026-2031)Electric Vehicles - Market Share Analysis, Industry Trends & Statistics, Growth Forecasts (2026 - 2031) |
||||||

※ 本網頁內容可能與最新版本有所差異。詳細情況請與我們聯繫。
據 Mordor Intelligence 稱,2025 年電動車市場價值 6,700 億美元,預計 2026 年將成長至 7,700 億美元,2026 年至 2031 年的複合年成長率將達到 11.68%,到 2031 年將達到 1.34 兆美元。
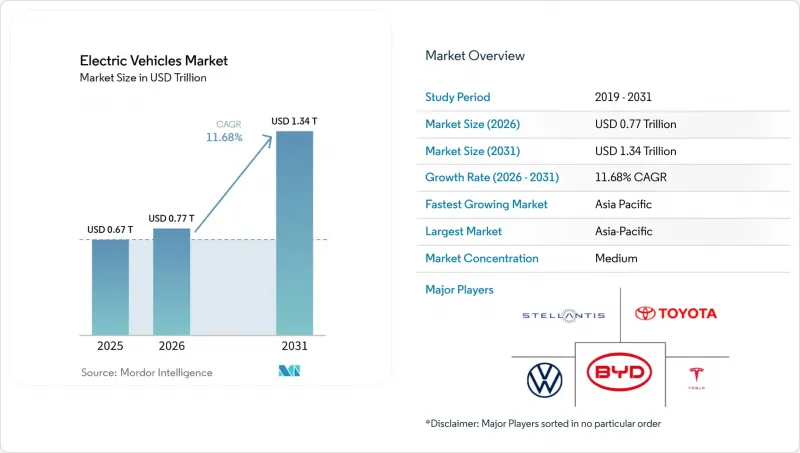
本報告按動力傳動系統(純電動車、插電式混合動力車、燃料電池電動車)、車輛類型(乘用車、商用車)、電池化學成分(磷酸鐵鋰電池、鎳鈷錳酸鋰電池等)、馬達架構(永磁同步馬達、感應馬達等)、續航里程(短、中、長、超長)、電壓(永磁同步馬達、感應馬達等)、續航里程(短、中、長、超長)、電壓(低壓、中壓、低壓區和低壓地區。市場預測以價值(美元)和銷售(輛)為單位呈現。
全球電動車市場趨勢與洞察
電池組成本正在下降,並接近 80 美元/千瓦時的門檻。
鋰離子電池組的價格已大幅下降,預計未來幾年將繼續下降。價格下降主要歸功於「電芯到電池包」設計(無需模組外殼)的普及以及中國磷酸鐵鋰電池產能的擴大。主要製造商已透過長期合約以低成本供應電池組。這種定價策略將使汽車製造商能夠在不依賴補貼的情況下提供更經濟實惠的車型。隨著成本逐漸接近內燃機動力傳動系統,在東南亞和拉丁美洲等價格敏感地區,電動車的普及速度正在加快。此外,主要公司正在建造固態固態電池試點生產線,目標是在2020年代末進一步降低成本,從而支持推出續航里程更長的高階車型。在這些持續的成本趨勢下,預計電動車將保持相對於傳統動力傳動系統的顯著價格優勢。
主要市場收緊車隊平均二氧化碳排放標準
中國擴大了雙軌製配額,歐盟也收緊了排放上限。同時,加州的「先進清潔汽車II」計畫也即將生效。這些措施正在刺激對零排放項目的巨額投資。在歐洲,違規處罰力道大幅提高,對大眾、Stellantis和通用汽車等主要汽車製造商構成嚴重威脅,迫使它們調整研發重點。因此,這些老牌汽車製造商正在加速開發滑板式平台,並擱置新的內燃機專案計畫。監管壓力是決定電動車市場走向的關鍵因素。
關鍵礦產供應鏈中的集中風險
印尼和剛果民主共和國擁有全球大部分鎳鈷蘊藏量,其價格波動主要受電動車市場政策變化的影響。印尼實施出口限制後,鎳價一度飆升,隨後又大幅下跌。為了遵守《通貨膨脹控制法》的要求,汽車製造商正增加從自由貿易協定涵蓋國家的原料採購。例如,通用汽車已對Lithium Americas的「Soccer Pass」計畫進行了大量投資。然而,儘管採取了這些多元化措施,中國仍佔據全球鋰鈷精煉市場的大部分佔有率。這種主導地位加劇了供應鏈的脆弱性,並限制了利潤率的預期成長。
細分市場分析
到2025年,電池式電動車(BEV)將佔據電動車市場72.12%的佔有率,預計到2031年將以13.43%的複合年成長率成長。純電動車(BEV)正受益於磷酸鋰鐵(LFP)電池成本的下降和長續航里程充電的優勢,而插電式混合動力汽車(PHEV)的成長則因雙動力傳動系統的複雜性而停滯不前。燃料電池汽車仍受到加氫站短缺的限制,預計2024年全球銷量將低於1.5萬輛。中國和加州的逐步淘汰計畫將在2030年後減少對混合動力汽車的監管補貼,鞏固純電動車的主導地位。
在充電站稀少的農村地區,插電式混合動力汽車仍然有市場需求,但隨著純電動車(BEV)續航里程達到600公里,兩者之間的價格差距正在縮小。企業客戶不太願意為每輛車配備兩種不同的動力傳動系統,這限制了銷售成長。隨著綠氫成本的下降,燃料電池汽車可能會在長途運輸領域開闢利基市場,但這種情況在預測期內不太可能出現。總體而言,電動車市場預計將繼續向大規模的專用電池平台轉型。
預計到2025年,乘用車銷量佔電動車總銷量的79.28%,而商用車預計將在2031年之前以12.83%的複合年成長率成為電動車市場中成長最快的領域。由於宅配業者的生產通常簽訂多年契約,因此受消費者需求週期的影響較小。福特E-Transit和梅賽德斯-奔馳eSprinter等小型商用貨車與柴油車相比,每公里營運成本降低了40-50%,加速了企業車輛的電氣化進程。
由於電池成本下降以及電動車市場都市區零排放區的擴大,中型和重型卡車正在克服經濟障礙。比亞迪的12米電動公車已佔據中國城市公車新銷量的很大一部分。由於消費者對載貨柔軟性的偏好,搭乘用SUV銷量依然居高不下,但隨著汽車製造商將資金轉移到跨界車和商用底盤,轎車和掀背車的車型陣容正在萎縮。
區域分析
預計到2025年,亞太地區將佔全球電動車銷量的52.73%,年複合成長率將達到13.81%,隨著中國磷酸鐵鋰電池和印度生產連結獎勵計畫計畫(PLI)推動國內產能擴張,該地區在電動車市場的主導地位將進一步鞏固。中國以龐大的銷量引領市場,而韓國的現代和起亞也出口了相當數量的電動車。在日本,由於市場滲透率相對較低,政府正在擴大補貼以刺激需求。同時,泰國和印尼正在崛起為東南亞的主要組裝中心,憑藉稅收優惠和便利的原料供應吸引著許多汽車製造商,鞏固了其在電動車領域的領先地位。
北美佔據了相當大的市場佔有率。政策措施預計將進一步加速本地組裝和零件採購。特斯拉在美國電池式電動車(BEV)市場佔有相當大的佔有率,但通用汽車、福特和Stellantis也正按計畫在未來幾年進一步提高產量。加拿大的零排放汽車(ZEV)法規與加州的進度保持一致,而計劃在墨西哥建設的超級工廠將充分利用該地區的貿易優勢。儘管充電基礎設施不足和遍遠地區電網面臨的挑戰是阻礙因素,但聯邦和州政府的大量獎勵正在促進基礎設施建設的加速發展。
在歐洲,挪威新車的高普及率和德國的顯著進步引領下,電動車已佔據了相當大的市場。更嚴格的二氧化碳排放目標和「Fit for 55」舉措正在影響著汽車製造商的策略。大眾、Stellantis和雷諾的目標是在不久的將來每年生產大量的電動車。英國正努力在未來十年內提高零排放汽車的銷售比例,而在東歐,歐盟的資金支持下,走廊式充電站正在快速部署。在中東和非洲,儘管電動車市場仍處於起步階段,但沙烏地阿拉伯對Lucid的投資以及杜拜推動計程車電動化的舉措表明,該地區的電動車市場正在迅速擴張。
其他好處:
- Excel格式的市場預測(ME)表
- 3個月的分析師支持
目錄
第1章:引言
- 研究假設和市場定義
- 調查範圍
第2章:調查方法
第3章執行摘要
第4章:主要產業趨勢
- 都市化、人口、對汽車/大眾運輸的需求
- 車輛擁有數量和汽車擁有率
- 電動車在汽車市場的滲透率
- 燃油價格與電費差異(每公里,內燃機汽車與電動車)
- 電動車和內燃機汽車的總擁有成本 (TCO) 差異
- 資金籌措和所有權模式(貸款、租賃、認購)
- 電池化學成分構成比與電池組能量密度(例如,磷酸鐵鋰電池與鎳基碳化鋰電池等)
- 家庭、職場和公共場所充電樁的接入/安裝密度
- 快速充電網路滲透率和功率頻寬現狀
- 替代燃料基礎設施(燃料電池電動車的氫氣)
- 補貼和消費者獎勵的價值
- OEM電動車產品線和車型開發計劃
- 價值鍊和通路分析
- 監管、財政和產業政策框架
第5章 市場狀況
- 市場概覽
- 市場促進因素
- 預計到 2027 年,電池組的每千瓦時成本將保持在 80 美元以下。
- 在貨運路線上引入超快速(超過 350 千瓦)充電樁。
- 中國、歐洲和美國正在收緊汽車製造商的平均二氧化碳排放標準。
- 企業和公司在車輛脫碳方面的採購義務
- 矽陽極的廣泛應用推動該細分市場續航里程超過 600 公里。
- 可重複使用電池的價值鏈降低了總擁有成本。
- 市場限制因素
- 配電網升級改造的瓶頸
- 關鍵礦物(鋰、鎳)供應鏈中的集中風險
- 新興市場保固期內殘值的不確定性
- 網路安全與OTA更新合規成本
- 價值供應鏈分析
- 監理情勢
- 技術展望
- 波特五力模型
第6章 市場規模與成長預測
- 按動力傳動系統
- 電池式電動車(BEV)
- 插電式混合動力車(PHEV)
- 燃料電池電動車(FCEV)
- 車輛類型
- 搭乘用車
- 掀背車
- 轎車
- 運動型多用途車/跨界車
- 多用途車輛
- 商用車輛
- 輕型商用車
- 中型和大型卡車
- 公車
- 搭乘用車
- 電池化學成分
- 磷酸鋰鐵(LFP)
- 鋰鎳錳鈷氧化物(NMC)
- 鋰鎳鈷鋁氧化物(NCA)
- 其他
- 依馬達架構
- 永磁同步馬達(PMSM/IPM)
- 感應電動機(IM)
- 其他類型(SRM、軸流式等)
- 按範圍
- 短程(0-200公里)
- 中等距離(200-400公里)
- 長途(400-600公里)
- 超長距離(超過600公里)
- 透過電壓
- 低電壓(低於200伏特)
- 中壓(200-400伏特)
- 高壓(400-800伏特)
- 超高壓(800伏特或更高)
- 按地區
- 北美洲
- 美國
- 加拿大
- 其他北美國家
- 南美洲
- 巴西
- 阿根廷
- 其他南美國家
- 歐洲
- 德國
- 英國
- 法國
- 義大利
- 西班牙
- 其他歐洲國家
- 亞太地區
- 中國
- 印度
- 日本
- 韓國
- 其他亞太國家
- 中東和非洲
- 阿拉伯聯合大公國
- 沙烏地阿拉伯
- 南非
- 土耳其
- 其他中東和非洲國家
- 北美洲
第7章 競爭情勢
- 市場集中度
- 策略趨勢
- 市佔率分析
- 公司簡介
- BYD Company Ltd.
- Tesla Inc.
- SAIC Motor
- Volkswagen AG
- Hyundai Motor Company
- Nissan Motor Co. Ltd.
- Stellantis NV
- Daimler AG(Mercedes-Benz)
- General Motors
- Ford Motor Company
- Toyota Motor Corporation
- BMW AG
- Honda Motor Co. Ltd.
- Volvo Car AB
- Rivian Automotive LLC
- Lucid Group Inc.
- NIO Inc.
- Tata Motors Ltd.
第8章 市場機會與未來展望
第9章:執行長面臨的關鍵策略挑戰
According to Mordor Intelligence, the electric vehicle market size was valued at USD 0.67 trillion in 2025, is expected to grow to USD 0.77 trillion in 2026, and is forecast to reach USD 1.34 trillion by 2031, at an 11.68% CAGR over 2026-2031.
This report is Segmented by Powertrain (BEV, PHEV, and FCEV), Vehicle Type (Passenger Car, and Commercial Vehicle), Battery Chemistry (LFP, NMC, and More), Motor Architecture (PMSM, Induction, and Others), Range (Short, Mid, Long, and Ultra-Long), Voltage (Low, Mid, High, and Ultra-High), and Geography. The Market Forecasts in Value (USD) and Volume (Units).
Global Electric Vehicles Market Trends and Insights
Battery-Pack Cost Deflation Approaching USD 80 /kWh Threshold
Lithium-ion pack prices have declined significantly and are expected to drop further in the coming years. This reduction is attributed to the adoption of cell-to-pack designs, which eliminate module housings, and the scaling up of Chinese LFP output . Leading manufacturers are already supplying packs at lower costs through long-term contracts. This pricing strategy allows automakers to offer more affordable models without relying on subsidies. With costs approaching parity with internal-combustion powertrains, adoption is accelerating in price-sensitive regions such as Southeast Asia and Latin America. Additionally, solid-state pilot lines from key players are targeting even lower costs by the end of the decade, supporting premium offerings with extended range. As these cost trends continue, electric vehicles are set to maintain a substantial price advantage over traditional drivetrains.
Tightening Fleet-Average CO2 Standards Across Major Markets
China increased its dual-credit quota, while the EU tightened its emissions limit. Meanwhile, California's Advanced Clean Cars II is set to take effect soon. These measures are driving significant investments into zero-emission initiatives. In Europe, non-compliance penalties have risen significantly, creating a substantial threat that is shifting R&D priorities for automotive giants like Volkswagen, Stellantis, and General Motors. As a result, these legacy OEMs are accelerating the development of skateboard platforms and shelving plans for new internal-combustion projects. Regulatory pressures have become a key factor shaping the direction of the electric vehicle market.
Critical-Minerals Supply-Chain Concentration Risk
Indonesia and the Democratic Republic of the Congo, which hold most of the world's nickel and cobalt reserves, remain at the center of price volatility driven by policy shifts influencing the electric vehicle market. Nickel prices surged significantly after Indonesia imposed export restrictions before declining sharply. As OEMs work to comply with the Inflation Reduction Act's requirements, they are increasingly sourcing materials from countries covered by free trade agreements. General Motors, for instance, has made a significant investment in Lithium Americas' Thacker Pass project. However, despite these diversification efforts, China continues to dominate the refining of a substantial share of the world's lithium and cobalt. This dominance increases supply chain vulnerability and limits the expected margin expansion.
Other drivers and restraints analyzed in the detailed report include:
- Ultra-Rapid Charging Infrastructure Along Freight Corridors
- Silicon-Anode Penetration Enabling Ultra-Long-Range Segments
- Grid-Upgrade Bottlenecks at Distribution Level
For complete list of drivers and restraints, kindly check the Table Of Contents.
Segment Analysis
Battery electric vehicles held 72.12% electric vehicle market share in 2025 and are tracking a 13.43% CAGR through 2031. Pure-electric architectures capitalize on falling LFP costs and corridor charging, while plug-in hybrids plateau as dual-powertrain complexity loses favor. Fuel-cell formats remain constrained by a scarcity of hydrogen stations, delivering fewer than 15,000 global units in 2024. Phase-out timelines in China and California reduce regulatory credits for hybrids beyond 2030, thereby cementing the primacy of BEVs.
Plug-in hybrids still serve rural areas with sparse charging stations, but the price delta erodes as silicon-anode BEVs reach a 600 km range. Fleet buyers show a limited appetite for maintaining two drivetrains per vehicle, which curbs volume growth. Fuel cell units may find long-haul niches once green hydrogen costs fall, yet that scenario sits outside the forecast window. Net effect: The electric vehicle market continues its shift toward dedicated battery platforms on a larger scale.
Passenger cars accounted for 79.28% of 2025 revenue, while commercial vehicles posted the fastest 12.83% CAGR to 2031 in the electric vehicle market. Parcel operators and municipal bus fleets lock in multi-year contracts, insulating production from consumer cycles. Light commercial vans, such as the Ford E-Transit and Mercedes-Benz eSprinter, achieve 40-50% lower running costs per kilometer compared to their diesel rivals, accelerating corporate fleet conversions.
Medium- and heavy-duty trucks are crossing the economic threshold as battery costs decline and urban zero-emission zones expand across the electric vehicle market. BYD's 12-meter electric bus already anchors the majority of new urban bus sales in China. Passenger SUVs maintain volume leadership due to consumer preference for cargo versatility; however, sedans and hatchbacks see shrinking model lineups as OEMs redirect capital to crossovers and commercial chassis.
Complete Report Scope:
- By Powertrain
- Battery Electric Vehicles (BEVs)
- Plug-in Hybrid Electric Vehicles (PHEVs)
- Fuel Cell Electric Vehicles (FCEVs)
- By Vehicle Type
- Passenger Car
- Hatchback
- Sedan
- Sports Utility Vehicle/Crossover
- Multi-purpose Vehicle
- Commercial Vehicle
- Light Commercial Vehicle
- Medium and Heavy-duty Truck
- Bus
- Passenger Car
- By Battery Chemistry
- Lithium Iron Phosphate (LFP)
- Lithium Nickel Manganese Cobalt Oxide (NMC)
- Lithium Nickel Cobalt Aluminum Oxide (NCA)
- Others
- By Motor Architecture
- Permanent-Magnet Synchronous Motors (PMSM/IPM)
- Induction Motors (IM)
- Others (SRM, Axial Flux, etc.)
- By Range
- Short (0-200 km)
- Mid (200-400 km)
- Long (400-600 km)
- Ultra-Long (Above 600 km)
- By Voltage
- Low Voltage (Below 200 V)
- Mid Voltage (200-400 V)
- High Voltage (400-800 V)
- Ultra-High Voltage (Above 800 V)
- By Geography
- North America
- United States
- Canada
- Rest of North America
- South America
- Brazil
- Argentina
- Rest of South America
- Europe
- Germany
- United Kingdom
- France
- Italy
- Spain
- Rest of Europe
- Asia-Pacific
- China
- India
- Japan
- South Korea
- Rest of Asia-Pacific
- Middle-East and Africa
- United Arab Emirates
- Saudi Arabia
- South Africa
- Turkey
- Rest of Middle-East and Africa
- North America
Geography Analysis
The Asia-Pacific region commanded 52.73% of the 2025 volume and is projected to track a 13.81% CAGR reinforcing its leadership in the electric vehicle market, as China's LFP blade battery and India's Production Linked Incentive program add domestic capacity. China led the charge with a significant number of EVs sold, while South Korea's Hyundai and Kia exported a substantial volume of units. Japan, with relatively low market penetration, is increasing subsidies to boost demand. Meanwhile, Thailand and Indonesia are emerging as key assembly hubs in Southeast Asia, luring OEMs with tax breaks and easy access to raw materials, solidifying their dominance in the electric vehicle arena.
North America accounted for a notable share of the market. Policy measures are poised to boost local assembly and component sourcing. Tesla commands a significant portion of the United States BEV market, but GM, Ford, and Stellantis are on track to achieve higher production rates in the coming years. Canada's ZEV mandate is in sync with California's schedule, and Mexico's upcoming Gigafactory is capitalizing on regional trade advantages. While rural charging gaps and distribution grid challenges pose hurdles, substantial federal and state incentives are helping to accelerate infrastructure development.
Europe secured a considerable market share, spearheaded by Norway's high new-car penetration and Germany's notable progress. Stricter CO2 targets and the "fit-for-55" initiative are shaping OEM strategies. Volkswagen, Stellantis, and Renault are eyeing a combined annual output of a significant number of EVs in the near future. The United Kingdom is pushing for a high percentage of zero-emission sales within the decade, and Eastern Europe is rapidly installing corridor chargers with EU funds. In the Middle East and Africa, while still in nascent stages, Saudi Arabia's investment in Lucid and Dubai's move to electrify taxis hint at a burgeoning electric vehicle landscape.
- BYD Company Ltd.
- Tesla Inc.
- SAIC Motor
- Volkswagen AG
- Hyundai Motor Company
- Nissan Motor Co. Ltd.
- Stellantis N.V.
- Daimler AG (Mercedes-Benz)
- General Motors
- Ford Motor Company
- Toyota Motor Corporation
- BMW AG
- Honda Motor Co. Ltd.
- Volvo Car AB
- Rivian Automotive LLC
- Lucid Group Inc.
- NIO Inc.
- Tata Motors Ltd.
Additional Benefits:
- The market estimate (ME) sheet in Excel format
- 3 months of analyst support
TABLE OF CONTENTS
1 Introduction
- 1.1 Study Assumptions and Market Definition
- 1.2 Scope of the Study
2 Research Methodology
3 Executive Summary
4 Key Industry Trends
- 4.1 Urbanization, Population and Vehicle/Transit Demand
- 4.2 Car Ownership and Motorization Rate
- 4.3 EV Penetration in Car Market
- 4.4 Fuel vs Electricity Price Spread (Per km, ICE vs EV)
- 4.5 EV vs ICE Total Cost of Ownership (TCO) Gap
- 4.6 Financing and Ownership Models (Loans, Leasing, Subscription)
- 4.7 Battery Chemistry Mix and Pack Energy Density (LFP vs NMC etc.)
- 4.8 Home, Workplace and Public Charger Access / Density
- 4.9 Fast-Charging Network Coverage and Power Bands
- 4.10 Alternative Fuels Infrastructure (Hydrogen for FCEVs)
- 4.11 Subsidy and Consumer Incentive Value
- 4.12 OEM EV Line-up and Model Pipeline
- 4.13 Value-Chain and Distribution-Channel Analysis
- 4.14 Regulatory, Fiscal and Industrial Policy Framework
5 Market Landscape
- 5.1 Market Overview
- 5.2 Market Drivers
- 5.2.1 Battery-Pack Cost Per kWh Keeps Falling Below USD 80 By 2027
- 5.2.2 Ultra-Rapid (Above 350 kW) Charger Roll-Outs Along Freight Corridors
- 5.2.3 Tightening Fleet-Average CO2 Standards in China, Europe, and the United States
- 5.2.4 Corporate-Fleet Decarbonization Procurement Mandates
- 5.2.5 Silicon-Anode Penetration Boosting Above 600 Km Segment
- 5.2.6 Secondary-Use Battery Value-Chain Lowering TCO
- 5.3 Market Restraints
- 5.3.1 Grid-Upgrade Bottlenecks at the Distribution Level
- 5.3.2 Critical-Minerals (Li, Ni) Supply-Chain Concentration Risk
- 5.3.3 Warranty-Period Residual-Value Uncertainty in Emerging Markets
- 5.3.4 Cyber-Security and OTA-Update Compliance Costs
- 5.4 Value / Supply-Chain Analysis
- 5.5 Regulatory Landscape
- 5.6 Technological Outlook
- 5.7 Porter's Five Forces
- 5.7.1 Threat of New Entrants
- 5.7.2 Bargaining Power of Suppliers
- 5.7.3 Bargaining Power of Buyers
- 5.7.4 Threat of Substitutes
- 5.7.5 Competitive Rivalry
6 Market Size and Growth Forecasts (Value and Volume)
- 6.1 By Powertrain
- 6.1.1 Battery Electric Vehicles (BEVs)
- 6.1.2 Plug-in Hybrid Electric Vehicles (PHEVs)
- 6.1.3 Fuel Cell Electric Vehicles (FCEVs)
- 6.2 By Vehicle Type
- 6.2.1 Passenger Car
- 6.2.1.1 Hatchback
- 6.2.1.2 Sedan
- 6.2.1.3 Sports Utility Vehicle/Crossover
- 6.2.1.4 Multi-purpose Vehicle
- 6.2.2 Commercial Vehicle
- 6.2.2.1 Light Commercial Vehicle
- 6.2.2.2 Medium and Heavy-duty Truck
- 6.2.2.3 Bus
- 6.2.1 Passenger Car
- 6.3 By Battery Chemistry
- 6.3.1 Lithium Iron Phosphate (LFP)
- 6.3.2 Lithium Nickel Manganese Cobalt Oxide (NMC)
- 6.3.3 Lithium Nickel Cobalt Aluminum Oxide (NCA)
- 6.3.4 Others
- 6.4 By Motor Architecture
- 6.4.1 Permanent-Magnet Synchronous Motors (PMSM/IPM)
- 6.4.2 Induction Motors (IM)
- 6.4.3 Others (SRM, Axial Flux, etc.)
- 6.5 By Range
- 6.5.1 Short (0-200 km)
- 6.5.2 Mid (200-400 km)
- 6.5.3 Long (400-600 km)
- 6.5.4 Ultra-Long (Above 600 km)
- 6.6 By Voltage
- 6.6.1 Low Voltage (Below 200 V)
- 6.6.2 Mid Voltage (200-400 V)
- 6.6.3 High Voltage (400-800 V)
- 6.6.4 Ultra-High Voltage (Above 800 V)
- 6.7 By Geography
- 6.7.1 North America
- 6.7.1.1 United States
- 6.7.1.2 Canada
- 6.7.1.3 Rest of North America
- 6.7.2 South America
- 6.7.2.1 Brazil
- 6.7.2.2 Argentina
- 6.7.2.3 Rest of South America
- 6.7.3 Europe
- 6.7.3.1 Germany
- 6.7.3.2 United Kingdom
- 6.7.3.3 France
- 6.7.3.4 Italy
- 6.7.3.5 Spain
- 6.7.3.6 Rest of Europe
- 6.7.4 Asia-Pacific
- 6.7.4.1 China
- 6.7.4.2 India
- 6.7.4.3 Japan
- 6.7.4.4 South Korea
- 6.7.4.5 Rest of Asia-Pacific
- 6.7.5 Middle-East and Africa
- 6.7.5.1 United Arab Emirates
- 6.7.5.2 Saudi Arabia
- 6.7.5.3 South Africa
- 6.7.5.4 Turkey
- 6.7.5.5 Rest of Middle-East and Africa
- 6.7.1 North America
7 Competitive Landscape
- 7.1 Market Concentration
- 7.2 Strategic Moves
- 7.3 Market Share Analysis
- 7.4 Company Profiles (Includes Global level Overview, Market level overview, Core Segments, Financials as available, Strategic Information, Market Rank/Share for key companies, Products and Services, and Recent Developments)
- 7.4.1 BYD Company Ltd.
- 7.4.2 Tesla Inc.
- 7.4.3 SAIC Motor
- 7.4.4 Volkswagen AG
- 7.4.5 Hyundai Motor Company
- 7.4.6 Nissan Motor Co. Ltd.
- 7.4.7 Stellantis N.V.
- 7.4.8 Daimler AG (Mercedes-Benz)
- 7.4.9 General Motors
- 7.4.10 Ford Motor Company
- 7.4.11 Toyota Motor Corporation
- 7.4.12 BMW AG
- 7.4.13 Honda Motor Co. Ltd.
- 7.4.14 Volvo Car AB
- 7.4.15 Rivian Automotive LLC
- 7.4.16 Lucid Group Inc.
- 7.4.17 NIO Inc.
- 7.4.18 Tata Motors Ltd.
8 Market Opportunities and Future Outlook
9 Key Strategic Questions for CEOs

 2026年全球電動車市場預測印度電動車市場,2025-2032年
 北美電動車市場:市場佔有率分析、產業趨勢與統計、成長預測(2026-2031)新加坡電動車市場:市場佔有率分析、產業趨勢與統計及成長預測(2026-2031年)法國電動車市場:市場佔有率分析、產業趨勢與統計及成長預測(2026-2031)越南電動車市場:市場佔有率分析、產業趨勢與統計及成長預測(2026-2031年)電動車中800V架構的演變非洲電動車:市場佔有率分析、產業趨勢與統計及成長預測(2026-2031 年)東協電動車市場:市場佔有率分析、產業趨勢與統計及成長預測(2026-2031)800V電動車架構的市場規模、佔有率、成長、全球產業分析、區域趨勢與2026年至2034年預測