


 |
市場調查報告書
商品編碼
2116791
非洲電動車:市場佔有率分析、產業趨勢與統計及成長預測(2026-2031 年)Africa Electric Vehicle - Market Share Analysis, Industry Trends & Statistics, Growth Forecasts (2026 - 2031) |
||||||

※ 本網頁內容可能與最新版本有所差異。詳細情況請與我們聯繫。
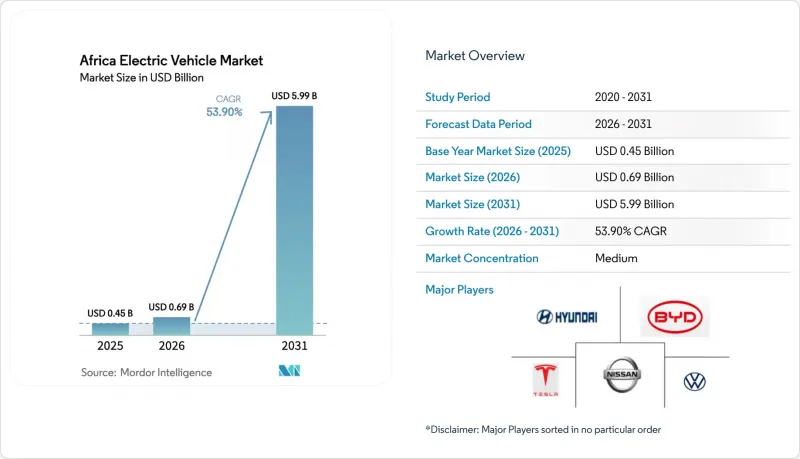
預計到 2026 年,非洲電動車市場價值將達到 6.9 億美元,從 2025 年的 4.5 億美元成長到 2031 年的 59.9 億美元。
預計從 2026 年到 2031 年,其複合年成長率將達到 53.9%。
本報告按動力系統(例如,電池式電動車)、車輛類型(例如,乘用車)、驅動系統(例如,前輪驅動)、電池化學成分(例如,磷酸鋰鐵、鎳錳鈷)、充電方式(交流慢充和直流快充)以及國家/地區進行分類。市場預測以貨幣價值(美元)和銷售兩種形式呈現。
非洲電動車市場趨勢與洞察
政府獎勵和關稅豁免正在降低電動車的價格。
衣索比亞於2024年禁止進口內燃機車,到2025年初,電動車註冊量佔新車銷售的比例將超過60%。加納對純電動車實施八年免稅政策,免徵進口關稅,鼓勵全球汽車製造組裝。南非提案的獎勵機制包括生產補貼,將政策重點從消費轉向製造,並深化非洲電動車市場的區域供應鏈。肯亞的增值稅免稅政策,加上電動車的電費折扣,使得2023年電動車註冊量增加了五倍,體現了需求的價格彈性。盧安達的增值稅措施和可再生能源比例的提高確保了電動車的可負擔性,從而促進了大眾汽車「GenFarm」電動曳引機的推廣應用。
電池組價格的大幅下降正在推動量產機型的普及。
除了電池價格的快速下降,國源集團在摩洛哥投資65億美元的超級工廠以及BTR投資3.66億美元的正極材料工廠的投產,也運作了區域組裝的到岸成本。電池生產的本地化避免了外匯風險和物流成本附加費,從而降低了車輛的標價,並改善了非洲電動車市場的整體擁有成本。 COBCO的70GWh前驅體製造工廠清晰地展現了規模經濟效益,這種效益正在向西非、中非和北非的出口走廊擴散。摩洛哥可再生能源滲透率的不斷提高進一步降低了能源投入成本,從而使整個非洲大陸的電池價格更具競爭力。隨著規模經濟效益在整個供應鏈中的擴散,預計到2027年,售價低於15,000美元的量產車型將廣泛應用,從而擴大對共享出行和配送車輛的需求。
升級充電基礎設施和電網需要大量資金投入。
建造覆蓋整個非洲大陸的快速充電走廊需要巨額資本投入,這將加重公共預算負擔,並與醫療和教育等優先事項產生衝突。在南非,約有316個公共充電樁投入運作,主要集中在豪登省,這凸顯了即使在最先進的汽車產業中心,基礎設施也存在差距。奈及利亞的旗艦級大型充電站展現了私營部門的熱情,但在其他53個國家,資金籌措需求仍然是一項重大挑戰,因為這些國家的電網建設資金往往不足。電網現代化必須與充電樁的部署同步進行,這種雙管齊下的投資方式延長了開發商的投資回收期。許多非洲國家的高昂借貸成本進一步拉低了專案的內部報酬率(IRR)。因此,混合資金籌措結構和優先氣候基金對於擴大充電網路、支持非洲電動車市場的永續發展至關重要。
細分市場分析
預計到2025年,電池式電動車)將佔非洲電動車銷量的78.65%,成為非洲電動車市場的基礎。在南非斥資47億歐元利用其鉑金蘊藏量的綠色氫能計畫的支持下,燃料電池汽車預計將在2031年前以56.40%的複合年成長率加速成長。隨著綠色氫能中心從2027年開始商業化運營,非洲燃料電池平台電動車市場規模預計將迅速擴大。同時,插電式混合動力汽車仍處於小眾市場,因為大多數政府都在鼓勵全面電氣化,以減少對進口燃料的依賴。由於不受傳統內燃機(ICE)供應鏈的束縛,非洲組裝可以完全專注於純電動車架構,將有限的資金集中在單一技術堆疊中。隨著本地電池工廠規模的擴大,純電動車的標價預計將會下降,而隨著燃料電池生態系統的同步成熟,純電動車將進一步鞏固其市場主導地位。
在非洲電動車市場,預計到2031年,純電動車(BEV)的市佔率將超過70%。即使燃料電池電動車(FCEV)逐漸滲透到貨運、採礦和城際公車等領域(這些領域更注重氫能的長續航里程),這一趨勢仍將持續。氫能基礎設施部署政策的清晰度將決定卡車從柴油動力過渡到燃料電池動力的速度。在此之前,純電動車將繼續主導乘用車和輕型商用車市場,因為充電網路的擴張速度快於加氫站的建造速度。因此,動力系統的發展趨勢是純電動車成為主流,而燃料電池電動車則選擇性地引入到利用率較高的大型車輛等細分市場。
預計到2025年,乘用車銷量將佔總銷量的61.25%,而摩托車和三輪車的複合年成長率預計將達到57.90%,這反映了非洲大陸共享出行和貨運的發展趨勢。隨著微旅遊公司持續擴展其電池更換網路,預計2025年至2027年間,非洲電動摩托車市場規模將成長兩倍。營運商青睞電動機車。
商用貨車和巴士雖然市佔率仍然較小,但其戰略意義依然重大。 Roam Kenya公司引進的電動巴士已使營運商的能源成本降低了50%,並改善了內羅畢市的空氣品質指數,促使內羅畢郡政府免除了零排放車輛的牌照費。對於長途巴士和重型卡車而言,仍需要開發高容量充電走廊和氫燃料替代方案。然而,隨著城市公車電氣化項目的擴展,基於站點的直流快速充電中心的建立將加強非洲電動車市場的基礎設施,最終實現快速充電樁的廣泛普及。
其他好處:
- Excel格式的市場預測(ME)表
- 3個月的分析師支持
目錄
第1章:引言
- 研究假設和市場定義
- 調查範圍
第2章:調查方法
第3章執行摘要
第4章 市場狀況
- 市場概覽
- 市場促進因素
- 政府激勵措施和免稅進口使電動車(EV)更加經濟實惠。
- 電池組價格的大幅下降正在提升大眾市場機型的受歡迎程度。
- 泛非礦產價值鏈的發展正在促進當地對電動車和電池的投資。
- 最後一公里物流領域向電動機車和嘟嘟車的巨大轉變
- 電池更換和計量收費模式減輕了前期成本的負擔。
- OEM金融科技透過微租賃擴大了非正規部門司機獲得用車服務的管道。
- 市場限制因素
- 升級充電基礎設施和電網需要大量資金投入。
- 大都會圈以外地區輸電網路可靠度低、電氣化率低。
- 廉價二手內燃機汽車進口激增,抑制了對新型電動車的需求。
- 二手電動車市場仍在發展中,這削弱了人們對車輛殘值的信心。
- 價值供應鏈分析
- 監理情勢
- 技術趨勢(全固態電池、鈉離子電池、氫燃料電池汽車)
- 波特五力模型
第5章 市場規模及成長預測(價值:美元,數量:單位)
- 依推進類型
- 電池式電動車(BEV)
- 插電式混合動力車(PHEV)
- 混合動力電動車(HEV)
- 燃料電池汽車(FCEV)
- 按車輛類型
- 搭乘用車
- 商用車輛
- 二輪車和三輪車
- 巴士和長途汽車
- 車輛驅動系統
- 前輪驅動
- 後輪驅動
- 全輪驅動
- 電池化學成分
- 磷酸鋰鐵(LFP)
- 鎳錳鈷(NMC)
- 鈉離子
- 固態電池
- 其他新興化學組合物(Li-S、Li-Air)
- 透過充電方法
- 交流低功率(小於 22 千瓦)
- 直流快速充電(50千瓦或以上)
- 國家
- 南非
- 摩洛哥
- 奈及利亞
- 埃及
- 衣索比亞
- 迦納
- 肯亞
- 其他非洲國家
第6章 競爭情勢
- 市場集中度
- 策略趨勢
- 市佔率分析
- 公司簡介
- Tesla Inc.
- BYD Co. Ltd.
- Nissan Motor Co. Ltd.
- Volkswagen AG
- Hyundai Motor Co.(incl. Kia)
- BMW AG
- Toyota Motor Corporation
- Mercedes-Benz Group AG
- Volvo Car AB
- Groupe Renault
- Rivian Automotive Inc.
- Ampersand Rwanda
- Roam(Kenya)
- Phoenix Mobility(Egypt)
- Katanka Automobile(Ghana)
- Jet Motor Company(Nigeria)
- Oryx Motors(Morocco)
第7章 市場機會與未來展望
According to Mordor Intelligence, Africa electric vehicle market size in 2026 is estimated at USD 0.69 billion, growing from 2025 value of USD 0.45 billion with 2031 projections showing USD 5.99 billion, growing at 53.9% CAGR over 2026-2031.
This report is Segmented by Propulsion Type (Battery Electric Vehicles, and More), Vehicle Type (Passenger Cars, and More), Vehicle Drive Type (Front-Wheel Drive, and More), Battery Chemistry (Lithium-Iron-Phosphate, Nickel-Manganese-Cobalt, and More), Charging Method (AC Slow and DC Fast), and Country. The Market Forecasts are Provided in Terms of Value (USD) and Volume in Units.
Africa Electric Vehicle Market Trends and Insights
Government Incentives and Zero-Duty Imports Surge EV Affordability
Ethiopia's 2024 ban on internal-combustion vehicle imports lifted electric-vehicle registrations above 60% of new sales by early 2025. Ghana's eight-year zero-tariff window eliminates customs duties on fully electric imports, stimulating assembly investment commitments by global OEMs. South Africa's draft incentive framework proposes production rebates that pivot the policy mix from consumption to manufacturing, enhancing the Africa electric vehicle market's regional supply-chain depth. Kenya's VAT exemption, combined with a discounted e-mobility electricity tariff, drove a five-fold rise in 2023 registrations, confirming price elasticity of demand. Rwanda's tax holiday and renewable power share reinforce affordability, enabling Volkswagen's GenFarm e-tractor rollout.
Plummeting Battery-Pack Prices Unlock Mass-Market Models
Rapid cell-price declines, coupled with Morocco's USD 6.5 billion Gotion gigafactory and BTR's USD 366 million cathode plant, are lowering landed-cost structures for regional assemblers. Localizing battery production sidesteps forex risk and logistics premiums, trimming vehicle sticker prices and improving the Africa electric vehicle market's total cost of ownership. COBCO's 70 GWh precursor facility illustrates economies of scale cascading across West, Central, and North African export corridors. With rise of renewable energy penetration in Morocco, further cuts energy input costs, translating into competitive battery pricing across the continent. As scale advantages stretch across supply chains, sub-USD 15,000 mass-market models are expected to proliferate by 2027, widening addressable demand among ride-hailing and delivery fleets.
High Cap-Ex for Charging and Grid Upgrades
Rolling out continent-wide fast-charging corridors entails heavy capital intensity that strains public budgets competing with health and education priorities. South Africa runs roughly 316 public chargers, concentrated around Gauteng, underscoring the infrastructure gap even in the most advanced auto hub. Nigeria's flagship charging super-station signals private-sector appetite, but financing requirements remain daunting for the 53 other countries where electricity networks are often under-funded. Grid modernization must occur in tandem with charger deployment, a dual investment track extending developers' payback periods. Elevated borrowing costs across many African economies further depress project internal-rate-of-return calculations. Consequently, blended-finance structures and concessional climate funds will be essential to scale charging networks that can support sustained growth in the Africa electric vehicle market.
Other drivers and restraints analyzed in the detailed report include:
- Pan-African Mineral Value-Chain Push Fuels Local EV/Battery Investment
- Leap-Frogging to E-Motorcycles and Tuk-Tuks for Last-Mile Logistics
- Weak Grid Reliability and Low Electrification Outside Metros
For complete list of drivers and restraints, kindly check the Table Of Contents.
Segment Analysis
Battery-electric vehicles generated 78.65% of 2025 revenue, anchoring the Africa electric vehicle market. Fuel-cell vehicles will accelerate at 56.40% CAGR through 2031, underpinned by South Africa's EUR 4.7 billion green-hydrogen program that leverages the nation's platinum reserves. The Africa electric vehicle market size for fuel-cell platforms is projected to rise sharply once green-hydrogen hubs reach commercialization after 2027. Plug-in hybrids remain niche because most governments incentivize full electrification to bypass imported fuel dependencies. Unencumbered by legacy ICE supply chains, African assemblers can commit entirely to BEV architectures, channeling limited capital toward a single technology stack. As local battery plants scale, BEV sticker prices are set to fall, reinforcing their market supremacy while fuel-cell ecosystems mature in parallel.
The Africa electric vehicle market share of BEVs is expected to remain above 70.00% through 2031, even as FCEVs penetrate freight, mining, and inter-city bus routes that value hydrogen's long-range attributes. Policy clarity around hydrogen infrastructure roll-out will determine the pace at which truck fleets pivot from diesel to fuel cells. Until then, BEVs will continue dominating passenger and light-commercial categories because charging networks expand faster than hydrogen refueling stations. The propulsion landscape, therefore, tilts toward a BEV-first trajectory with selective FCEV uptake in high-utilization heavy-duty niches.
Passenger cars led the 2025 revenue pool at 61.25%, yet two- and three-wheelers will chalk up a 57.90% CAGR, mirroring the continent's ride-hail and cargo-delivery dynamics. The Africa electric vehicle market size for two-wheelers is projected to triple between 2025 and 2027 as micro-mobility companies expand battery-swap networks. Operators prefer electric bikes because daily fuel savings exceed battery-subscription fees, directly boosting take-home income. Ride-hailing platforms bundle bikes with insurance and digital-wallet repayment plans, broadening access for drivers lacking formal credit histories.
Commercial vans and buses remain smaller slices but hold strategic relevance. Electric buses employed by Roam Kenya cut operator energy costs by 50% and improve urban air-quality metrics, prompting Nairobi County to waive route-licensing fees for zero-emission fleets. Long-distance coaches and heavy trucks await higher-capacity charging corridors or hydrogen alternatives. Nevertheless, growing city-bus electrification projects will anchor depot-based DC fast-charging hubs that spill over into public-access fast-chargers, strengthening the Africa electric vehicle market infrastructure base.
Complete Report Scope:
- By Propulsion Type
- Battery Electric Vehicles (BEV)
- Plug-in Hybrid Electric Vehicles (PHEV)
- Hybrid Electric Vehicles (HEV)
- Fuel-Cell Electric Vehicles (FCEV)
- By Vehicle Type
- Passenger Cars
- Commercial Vehicles
- Two- and Three-Wheelers
- Buses and Coaches
- By Vehicle Drive Type
- Front-Wheel Drive
- Rear-Wheel Drive
- All-Wheel Drive
- By Battery Chemistry
- Lithium-Iron-Phosphate (LFP)
- Nickel-Manganese-Cobalt (NMC)
- Sodium-ion
- Solid-State
- Other Emerging Chemistries (Li-S, Li-Air)
- By Charging Method
- AC Slow (Below 22 kW)
- DC Fast (Above50 kW)
- By Country
- South Africa
- Morocco
- Nigeria
- Egypt
- Ethiopia
- Ghana
- Kenya
- Rest of Africa
List of Companies Covered in this Report:
- Tesla Inc.
- BYD Co. Ltd.
- Nissan Motor Co. Ltd.
- Volkswagen AG
- Hyundai Motor Co. (incl. Kia)
- BMW AG
- Toyota Motor Corporation
- Mercedes-Benz Group AG
- Volvo Car AB
- Groupe Renault
- Rivian Automotive Inc.
- Ampersand Rwanda
- Roam (Kenya)
- Phoenix Mobility (Egypt)
- Katanka Automobile (Ghana)
- Jet Motor Company (Nigeria)
- Oryx Motors (Morocco)
Additional Benefits:
- The market estimate (ME) sheet in Excel format
- 3 months of analyst support
TABLE OF CONTENTS
1 Introduction
- 1.1 Study Assumptions & Market Definition
- 1.2 Scope of the Study
2 Research Methodology
3 Executive Summary
4 Market Landscape
- 4.1 Market Overview
- 4.2 Market Drivers
- 4.2.1 Government Incentives and Zero-Duty Imports Surge EV Affordability.
- 4.2.2 Plummeting Battery-Pack Prices Unlock Mass-Market Models
- 4.2.3 Pan-African Mineral Value-Chain Push Fuels Local EV/Battery Investment
- 4.2.4 Leap-Frogging To E-Motorcycles and Tuk-Tuks for Last-Mile Logistics
- 4.2.5 Battery-Swap and Pay-Per-Use Models Mitigate Upfront-Cost Barrier
- 4.2.6 OEM Fin-Tech Micro-Leasing Widens Access for Informal-Sector Drivers
- 4.3 Market Restraints
- 4.3.1 High Capex for Charging and Grid Upgrades
- 4.3.2 Weak Grid Reliability and Low Electrification Outside Metros
- 4.3.3 Flood Of Cheap Used ICE Imports Undercuts New-EV Demand
- 4.3.4 Nascent Second-Hand EV Market Hurts Residual-Value Confidence
- 4.4 Value / Supply-Chain Analysis
- 4.5 Regulatory Landscape
- 4.6 Technological Outlook (solid-state, sodium-ion, H2-FCEV)
- 4.7 Porter's Five Forces
- 4.7.1 Threat of New Entrants
- 4.7.2 Bargaining Power of Buyers
- 4.7.3 Bargaining Power of Suppliers
- 4.7.4 Threat of Substitutes
- 4.7.5 Competitive Rivalry
5 Market Size & Growth Forecasts (Value in USD, Volume in Units)
- 5.1 By Propulsion Type
- 5.1.1 Battery Electric Vehicles (BEV)
- 5.1.2 Plug-in Hybrid Electric Vehicles (PHEV)
- 5.1.3 Hybrid Electric Vehicles (HEV)
- 5.1.4 Fuel-Cell Electric Vehicles (FCEV)
- 5.2 By Vehicle Type
- 5.2.1 Passenger Cars
- 5.2.2 Commercial Vehicles
- 5.2.3 Two- and Three-Wheelers
- 5.2.4 Buses and Coaches
- 5.3 By Vehicle Drive Type
- 5.3.1 Front-Wheel Drive
- 5.3.2 Rear-Wheel Drive
- 5.3.3 All-Wheel Drive
- 5.4 By Battery Chemistry
- 5.4.1 Lithium-Iron-Phosphate (LFP)
- 5.4.2 Nickel-Manganese-Cobalt (NMC)
- 5.4.3 Sodium-ion
- 5.4.4 Solid-State
- 5.4.5 Other Emerging Chemistries (Li-S, Li-Air)
- 5.5 By Charging Method
- 5.5.1 AC Slow (Below 22 kW)
- 5.5.2 DC Fast (Above50 kW)
- 5.6 By Country
- 5.6.1 South Africa
- 5.6.2 Morocco
- 5.6.3 Nigeria
- 5.6.4 Egypt
- 5.6.5 Ethiopia
- 5.6.6 Ghana
- 5.6.7 Kenya
- 5.6.8 Rest of Africa
6 Competitive Landscape
- 6.1 Market Concentration
- 6.2 Strategic Moves
- 6.3 Market Share Analysis
- 6.4 Company Profiles (Includes Global level Overview, Market level overview, Core Segments, Financials as available, Strategic Information, Market Rank/Share for key companies, Products & Services, and Recent Developments)
- 6.4.1 Tesla Inc.
- 6.4.2 BYD Co. Ltd.
- 6.4.3 Nissan Motor Co. Ltd.
- 6.4.4 Volkswagen AG
- 6.4.5 Hyundai Motor Co. (incl. Kia)
- 6.4.6 BMW AG
- 6.4.7 Toyota Motor Corporation
- 6.4.8 Mercedes-Benz Group AG
- 6.4.9 Volvo Car AB
- 6.4.10 Groupe Renault
- 6.4.11 Rivian Automotive Inc.
- 6.4.12 Ampersand Rwanda
- 6.4.13 Roam (Kenya)
- 6.4.14 Phoenix Mobility (Egypt)
- 6.4.15 Katanka Automobile (Ghana)
- 6.4.16 Jet Motor Company (Nigeria)
- 6.4.17 Oryx Motors (Morocco)
7 Market Opportunities & Future Outlook

 2026年全球電動車市場預測印度電動車市場,2025-2032年
 北美電動車市場:市場佔有率分析、產業趨勢與統計、成長預測(2026-2031)新加坡電動車市場:市場佔有率分析、產業趨勢與統計及成長預測(2026-2031年)法國電動車市場:市場佔有率分析、產業趨勢與統計及成長預測(2026-2031)電動車:市場佔有率分析、產業趨勢與統計、成長預測(2026-2031)越南電動車市場:市場佔有率分析、產業趨勢與統計及成長預測(2026-2031年)電動車中800V架構的演變東協電動車市場:市場佔有率分析、產業趨勢與統計及成長預測(2026-2031)800V電動車架構的市場規模、佔有率、成長、全球產業分析、區域趨勢與2026年至2034年預測