


 |
市場調查報告書
商品編碼
2117458
北美電動車市場:市場佔有率分析、產業趨勢與統計、成長預測(2026-2031)North America Electric Vehicle - Market Share Analysis, Industry Trends & Statistics, Growth Forecasts (2026 - 2031) |
||||||

※ 本網頁內容可能與最新版本有所差異。詳細情況請與我們聯繫。
根據 Mordor Intelligence 預測,北美電動車市場規模將從 2025 年的 950.5 億美元和 2026 年的 1026.6 億美元成長到 2031 年的 1509.2 億美元,2026 年至 2031 年的複合年成長率為 8.01%。
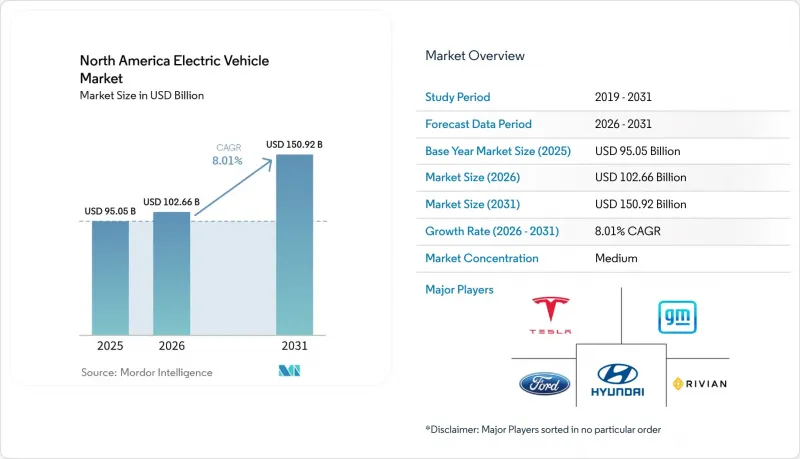
本報告按車輛類型(乘用車、輕型商用車等)、動力系統(電池式電動車、插電式混合動力汽車等)、驅動方式(前輪驅動、後輪驅動等)、功率輸出(小於100千瓦、100-250千瓦等)和國家/地區進行分類。市場預測以價值(美元)和銷售(輛)為單位呈現。
北美電動車市場趨勢與分析
更低的電池成本和更長的續航里程
預計到2025年,電池組價格將降至108美元/千瓦時,隨著磷酸鋰鐵(LFP)化學品的量產,價格將進一步下降。特斯拉和LG能源解決方案公司已宣布計劃於2027年在密西根州運作一家LFP電池工廠[2],這證實了電池化學品生產的區域性轉移。 2026年推出的大多數車型續航里程將超過300英里,正如售價3.5萬美元的入門級雪佛蘭Equinox電動車所展現的那樣,「里程焦慮」正在緩解。然而,在寒冷氣候下性能下降(額定續航里程可能減少約三分之一)限制了電動車的普及,尤其是在加拿大。儘管如此,每一次成本的小幅降低都會擴大潛在客戶群,他們有望節省的總體擁有成本將超過購車時的溢價。
聯邦稅收優惠和個人退休帳戶補貼
《通貨膨脹控制法案》(IRA) 提供大額製造業稅額扣抵,縮短了消費者和汽車製造商的投資回收期。合格標準逐年提高,迫使企業重組供應鏈,以採購北美零件。財政部於 2024 年發布的指南豁免了由受關注營業單位供應的含石墨電池,導致原始設備製造商 (OEM) 將合約轉移到澳洲和加拿大。擁有國內電池生產線的垂直整合製造商更容易遵守這些規定,這使它們比依賴合資企業的競爭對手更具成本優勢。每輛商用車最高 4 萬美元的稅額扣抵鼓勵了宅配和市政車輛的電氣化,使企業買家能夠最大限度地利用這項補貼。隨著資格標準的逐步提高,擁有國內煉油和中游生產能力的供應商將在合規成本方面具有優勢。
公共充電基礎設施密度不足
根據美國國家再生能源實驗室(NREL)的估計,到2030年,全球將需要2,800萬個充電樁,但截至2025年底,實際上僅有800萬個。儘管聯邦政府推出了50億美元的走廊計劃,但授權發放瓶頸限制了充電樁的部署。在中西部和阿巴拉契亞地區的農村地區,充電樁密度仍然低於每100平方英里一個,這阻礙了長途旅行。加拿大各省之間的充電網路缺乏互通性,跨省旅行時需要使用多種支付系統。除非充電樁密度的差距縮小,否則消費者信心和二手車轉售價值將持續受到壓力。
細分市場分析
2025年,乘用車銷量佔比高達77.13%,但隨著首批早期用戶推動的市場逐漸趨於飽和,其成長速度正在放緩。成長最快的細分市場-輕型商用車,預計將以9.02%的複合年成長率成長,反映出小包裹遞送公司和市政部門正轉向使用電池驅動的貨車。美國郵政服務和亞馬遜的訂單支撐著商用車需求的持續成長,而市政公車競標則推動了公共交通電氣化的發展。因此,儘管北美商用貨車電動車的市場基數較小,但預計其成長速度將超過搭乘用轎車。
車隊的運作週期決定了車輛的運作。可預測的路線使得車輛能夠在基地台充電,提高每日利用率,從而降低每英里成本。市政車輛零排放的法規進一步推動了垃圾收集和機場接駁車等應用領域的發展。資金籌措模式也不斷演變,租賃公司現在將充電樁和維護服務打包,以減輕市政當局的資金負擔。即使獎勵逐步取消,大規模小包裹遞送車輛仍將受益於其明確的殘值,因為它們為低載重二手的二手貨車提供了次市場。
預計到2025年,電池式電動車)將佔北美電動車市場70.25%的佔有率,並以11.22%的複合年成長率(CAGR)實現最快成長。加州擁有超過60個加氫站的網路以及加拿大的試點走廊項目,正吸引那些擔心電池重量增加的大型車輛營運商。因此,在北美電動車市場,燃料電池電動車的佔有率將在長途貨運和城際長途客車等細分市場逐步提升,因為快速加氫有助於提高車輛的利用率。
各汽車製造商的資源配置策略各不相同。一些老牌廠商暫停了插電式混合動力汽車型的更新換代,並將資金重新投入符合相關法規並獲得補貼的電池組。同時,卡車製造商與工業氣體供應商之間的合作表明,他們對綠色氫氣的成本曲線充滿信心。市場分析師預計,除非氫氣價格降至政策制定者設定的每公斤2美元的目標水準附近,否則燃料電池在輕型汽車領域仍將維持補充而非競爭關係。
其他好處:
- Excel格式的市場預測(ME)表
- 3個月的分析師支持
目錄
第1章:引言
- 市場分析與定義的前提條件
- 分析範圍
第2章 分析方法
第3章執行摘要
第4章 市場狀況
- 市場概覽
- 市場促進因素
- 更低的電池成本和更長的續航里程
- 聯邦稅收優惠和《通貨膨脹控制法案》津貼
- 汽車製造商的電氣化藍圖和投資
- 基於美墨加獎勵的國內電池供應鏈本地化
- 區域電力公司所進行的V2G(車輛到電網)示範項目
- 垂直整合的電池回收生態系統
- 市場限制因素
- 公共充電基礎設施密度不足。
- 高昂的初始購買價格與內燃機替代方案的比較
- 二手市場中二手電動車價格的不確定性
- 直流快速充電站的併網延遲
- 價值鍊和供應鏈分析
- 監理情勢
- 技術展望
- 波特五力分析
第5章:預測市場規模與成長率
- 按車輛類型
- 搭乘用車
- 輕型商用車(LCV)
- 中型和大型商用車輛(M&HCV)
- 巴士和長途汽車
- 透過推進方法
- 電池式電動車(BEV)
- 插電式混合動力汽車(PHEV)
- 混合動力汽車(HEV)
- 燃料電池汽車(FCEV)
- 透過驅動系統
- 前輪驅動(FWD)
- 後輪驅動(RWD)
- 全輪驅動(AWD)
- 依輸出類型
- 小於100千瓦
- 100~250 kW
- 250度或以上
- 國家
- 美國
- 加拿大
- 墨西哥
第6章 競爭情勢
- 市場集中度
- 策略趨勢
- 市佔率分析
- 公司簡介
- Tesla, Inc.
- General Motors Company
- Ford Motor Company
- Hyundai Motor Company
- Rivian Automotive, Inc.
- Stellantis NV
- Lucid Group, Inc.
- Nissan Motor Co., Ltd.
- Honda Motor Co., Ltd.
- BMW Group
- Mercedes-Benz Group AG
- Volvo Car AB
- BYD Auto Co., Ltd.
- Lion Electric Company
- Nikola Corporation
- Daimler Truck Holding AG
- PACCAR Inc.
第7章 市場機會與未來展望
According to Mordor Intelligence, the North America electric vehicle market size is projected to expand from USD 95.05 billion in 2025 and USD 102.66 billion in 2026 to USD 150.92 billion by 2031, registering an 8.01% CAGR between 2026 and 2031.
This report is Segmented by Vehicle Type (Passenger Cars, Light Commercial Vehicles, and More), Propulsion Type (Battery Electric Vehicles, Plug-In Hybrid Electric Vehicles, and More), Drive Type (Front-Wheel Drive, Rear-Wheel Drive, and More), Power Output (Below 100 KW, 100-250 KW, and More), and Country. The Market Forecasts are Provided in Terms of Value (USD) and Volume (Units).
North America Electric Vehicle Market Trends and Insights
Declining Battery Costs and Extended Range
Pack prices fell to USD 108/kWh in 2025 and are expected to ease further as lithium-iron-phosphate chemistries scale. Tesla and LG Energy Solution announced a Michigan LFP cell facility scheduled for 2027[2], underscoring the regional shift in chemistry production. Range anxiety is easing because most 2026 model launches clear the 300-mile mark, as seen in the Chevrolet Equinox EV at a USD 35,000 entry price. Cold-weather degradation, however, still trims roughly one-third of the rated range, particularly constraining Canadian uptake. Even so, every incremental cost reduction expands the addressable pool of buyers for whom total ownership savings eclipse sticker premiums.
Federal Tax Incentives and IRA Subsidies
The Inflation Reduction Act offers sizeable manufacturing credits, shortening payback periods for both consumers and automakers. Eligibility thresholds rise each year, forcing firms to realign their supply chains toward North American components. Treasury guidance issued in 2024 disqualified batteries with graphite from entities of concern, pushing OEMs toward Australian and Canadian contracts. Vertically integrated manufacturers with domestic cell lines meet these rules more easily, strengthening their cost position versus joint-venture-reliant peers. The commercial-vehicle credit of up to USD 40,000 per unit has spurred conversions of parcel and municipal fleets, enabling corporate buyers to fully monetize the subsidy. As the thresholds ratchet upward, compliance costs will favor suppliers with onshore refining and midstream capacity.
Inadequate Public Charging Infrastructure Density
NREL calculates a need for 28 million ports by 2030, but only 8 million existed at 2025's close. Permitting bottlenecks limit roll-outs despite a USD 5 billion federal corridor program. Rural areas in the Midwest and Appalachia fall below one charger per 100 square miles, dissuading long-distance travel. Canada's province-specific networks lack interoperability, requiring multiple payment systems for cross-border drives. Until density gaps shrink, consumer confidence and resale values will remain under pressure.
Other drivers and restraints analyzed in the detailed report include:
- Automakers' Electrification Roadmaps and Investments
- Domestic Battery Supply-Chain Localization Under USMCA Incentives
- High Upfront Purchase Price vs. ICE Alternatives
For complete list of drivers and restraints, kindly check the Table Of Contents.
Segment Analysis
Passenger cars held 77.13% of 2025 revenue but face a gentler growth curve as first-wave early adopters saturate. Light commercial vehicles, the fastest-growing slice, are slated for a 9.02% CAGR, reflecting parcel carriers and municipal fleets switching en masse to battery vans. Contract awards from the U.S. Postal Service and Amazon validate the durability of fleet demand, while municipal bus tenders extend electrification into public transit. The North American electric vehicle market size for commercial vans will therefore expand more quickly than for passenger sedans, even though the absolute base is smaller.
Fleet duty cycles amplify uptime gains: predictable routes enable depot charging and higher daily utilization, lowering cost per mile. Regulations mandating zero-emission municipal fleets intensify momentum in refuse collection and airport shuttle applications. Financing models are also evolving; leasing companies now bundle chargers and maintenance, flattening capital burdens for city agencies. As incentives taper, operators should still benefit from residual-value clarity because large-parcel fleets provide a secondary market for used vans in less-demanding roles.
Battery-electric platforms secured 70.25% of 2025 sales, anchoring the propulsion landscape of the North American electric vehicle market. Fuel-cell models will, however, chart the quickest percentage rise at 11.22% CAGR, albeit from a much smaller baseline. California's network of 60-plus hydrogen stations and Canada's pilot corridors lure heavy-duty operators wary of battery weight penalties. The North American electric vehicle market share of FCEVs will therefore inch upward in the long-haul freight and intercity coach niches, where rapid refueling unlocks asset utilization.
OEM resource allocation signals diverging bets: several legacy brands canceled plug-in hybrid updates to redeploy capital toward battery packs that meet content rules and qualify for credits. Meanwhile, partnerships between truck makers and industrial-gas suppliers demonstrate confidence in green-hydrogen cost curves. Market watchers expect fuel cells to remain complementary rather than competitive in light-duty segments unless hydrogen prices drop near the USD 2/kg parity threshold policymakers target.
Complete Report Scope:
- By Vehicle Type
- Passenger Cars
- Light Commercial Vehicles (LCVs)
- Medium and Heavy Commercial Vehicles (M&HCVs)
- Buses and Coaches
- By Propulsion Type
- Battery Electric Vehicles (BEV)
- Plug-in Hybrid Electric Vehicles (PHEV)
- Hybrid Electric Vehicles (HEV)
- Fuel-Cell Electric Vehicles (FCEV)
- By Drive Type
- Front-Wheel Drive (FWD)
- Rear-Wheel Drive (RWD)
- All-Wheel Drive (AWD)
- By Power Output
- Below 100 kW
- 100-250 kW
- Above 250 kW
- By Country
- United States
- Canada
- Mexico
List of Companies Covered in this Report:
- Tesla, Inc.
- General Motors Company
- Ford Motor Company
- Hyundai Motor Company
- Rivian Automotive, Inc.
- Stellantis N.V.
- Lucid Group, Inc.
- Nissan Motor Co., Ltd.
- Honda Motor Co., Ltd.
- BMW Group
- Mercedes-Benz Group AG
- Volvo Car AB
- BYD Auto Co., Ltd.
- Lion Electric Company
- Nikola Corporation
- Daimler Truck Holding AG
- PACCAR Inc.
Additional Benefits:
- The market estimate (ME) sheet in Excel format
- 3 months of analyst support
TABLE OF CONTENTS
1 Introduction
- 1.1 Study Assumptions & Market Definition
- 1.2 Scope of the Study
2 Research Methodology
3 Executive Summary
4 Market Landscape
- 4.1 Market Overview
- 4.2 Market Drivers
- 4.2.1 Declining Battery Costs and Extended Range
- 4.2.2 Federal Tax Incentives and IRA Subsidies
- 4.2.3 Automakers' Electrification Roadmaps and Investments
- 4.2.4 Domestic Battery Supply-Chain Localization Under USMCA Incentives
- 4.2.5 Vehicle-to-Grid (V2G) Pilots by Regional Utilities
- 4.2.6 Vertically-Integrated Battery Recycling Ecosystems
- 4.3 Market Restraints
- 4.3.1 Inadequate Public Charging Infrastructure Density
- 4.3.2 High Upfront Purchase Price vs. ICE Alternatives
- 4.3.3 BEV Resale-Value Uncertainty in Secondary Markets
- 4.3.4 Grid Interconnection Delays for DC Fast-Charging Hubs
- 4.4 Value / Supply-Chain Analysis
- 4.5 Regulatory Landscape
- 4.6 Technological Outlook
- 4.7 Porter's Five Forces
- 4.7.1 Threat of New Entrants
- 4.7.2 Bargaining Power of Suppliers
- 4.7.3 Bargaining Power of Buyers
- 4.7.4 Threat of Substitutes
- 4.7.5 Competitive Rivalry
5 Market Size & Growth Forecasts (Value (USD) and Volume (Units))
- 5.1 By Vehicle Type
- 5.1.1 Passenger Cars
- 5.1.2 Light Commercial Vehicles (LCVs)
- 5.1.3 Medium and Heavy Commercial Vehicles (M&HCVs)
- 5.1.4 Buses and Coaches
- 5.2 By Propulsion Type
- 5.2.1 Battery Electric Vehicles (BEV)
- 5.2.2 Plug-in Hybrid Electric Vehicles (PHEV)
- 5.2.3 Hybrid Electric Vehicles (HEV)
- 5.2.4 Fuel-Cell Electric Vehicles (FCEV)
- 5.3 By Drive Type
- 5.3.1 Front-Wheel Drive (FWD)
- 5.3.2 Rear-Wheel Drive (RWD)
- 5.3.3 All-Wheel Drive (AWD)
- 5.4 By Power Output
- 5.4.1 Below 100 kW
- 5.4.2 100-250 kW
- 5.4.3 Above 250 kW
- 5.5 By Country
- 5.5.1 United States
- 5.5.2 Canada
- 5.5.3 Mexico
6 Competitive Landscape
- 6.1 Market Concentration
- 6.2 Strategic Moves
- 6.3 Market Share Analysis
- 6.4 Company Profiles (Includes Global Level Overview, Market Level Overview, Core Segments, Financials as Available, Strategic Information, Market Rank/Share for Key Companies, Products and Services, SWOT Analysis, and Recent Developments)
- 6.4.1 Tesla, Inc.
- 6.4.2 General Motors Company
- 6.4.3 Ford Motor Company
- 6.4.4 Hyundai Motor Company
- 6.4.5 Rivian Automotive, Inc.
- 6.4.6 Stellantis N.V.
- 6.4.7 Lucid Group, Inc.
- 6.4.8 Nissan Motor Co., Ltd.
- 6.4.9 Honda Motor Co., Ltd.
- 6.4.10 BMW Group
- 6.4.11 Mercedes-Benz Group AG
- 6.4.12 Volvo Car AB
- 6.4.13 BYD Auto Co., Ltd.
- 6.4.14 Lion Electric Company
- 6.4.15 Nikola Corporation
- 6.4.16 Daimler Truck Holding AG
- 6.4.17 PACCAR Inc.
7 Market Opportunities & Future Outlook
- 7.1 White-space & Unmet-Need Assessment

 2026年全球電動車市場預測印度電動車市場,2025-2032年
 新加坡電動車市場:市場佔有率分析、產業趨勢與統計及成長預測(2026-2031年)法國電動車市場:市場佔有率分析、產業趨勢與統計及成長預測(2026-2031)電動車:市場佔有率分析、產業趨勢與統計、成長預測(2026-2031)越南電動車市場:市場佔有率分析、產業趨勢與統計及成長預測(2026-2031年)電動車中800V架構的演變非洲電動車:市場佔有率分析、產業趨勢與統計及成長預測(2026-2031 年)東協電動車市場:市場佔有率分析、產業趨勢與統計及成長預測(2026-2031)800V電動車架構的市場規模、佔有率、成長、全球產業分析、區域趨勢與2026年至2034年預測