


 |
市場調查報告書
商品編碼
2123150
美國貨運代理市場:市場佔有率分析、產業趨勢與統計、成長預測(2026-2031)United States Freight Brokerage - Market Share Analysis, Industry Trends & Statistics, Growth Forecasts (2026 - 2031) |
||||||

※ 本網頁內容可能與最新版本有所差異。詳細情況請與我們聯繫。
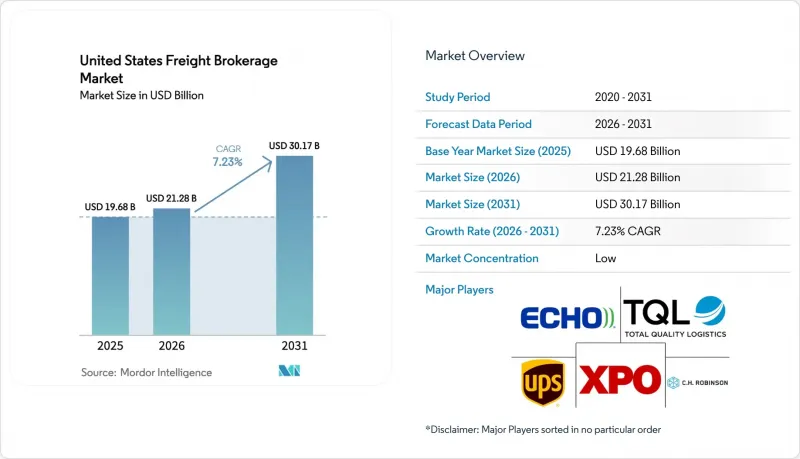
根據 Mordor Intelligence 預測,美國貨運代理市場規模將從 2025 年的 196.8 億美元成長到 2026 年的 212.8 億美元,然後在 2031 年達到 301.7 億美元,2026 年至 2031 年的複合年成長率為 7.23%。
本報告按服務類型(整車運輸等)、設備類型(乾貨車、罐車等)、運輸距離(長途、區域、近距離)、經營模式(傳統貨運代理等)、終端用戶行業(製造業、汽車業等)、客戶規模(小型企業等)和地區(東北地區等)進行分類。市場預測以美元計價。
美國貨運經紀市場的趨勢與洞察
電子商務交易量激增以及人們對隔天達服務的期望。
到2024年,美國電子商務銷售額將超過1.1兆美元,目前90%的人口居住在履約中心50英里(約80公里)的範圍內。這種高密度網路已將配送時間縮短至一天以內,迫使托運人整合區域承運商,並利用能夠保證即時運輸能力的仲介。亞馬遜已新增1000個「最後一公里」配送站,創建了短途接駁服務,仲介會將這些服務與回程傳輸運輸能力進行匹配。沃爾瑪等傳統零售商正在加速採用「最後一公里」技術,這增加了對能夠協調多環節、時效性強的物流流程的仲介的需求。訂單週期已從每週一次轉變為每日一次,這需要數據和行動連線來實現即時卡車位置追蹤,而不是透過電話調度。能夠在30秒內提供貨運報價的平台在這個快節奏的環境中持續贏得競標。
運輸業的高度分散性使得仲介的重要性日益凸顯。
在美國,活躍的貨運公司超過120萬家,其中97%是擁有不到20輛卡車的小規模企業。這些小規模企業屬於「長尾」市場,缺乏競標大宗貨物所需的資金基礎和後勤部門系統,而仲介利用由此產生的資訊不對稱,透過貨物集中和快速付款週期獲利。預計到2024年,小規模貨運公司的司機流動率將超過90%,許多獨立承包商依賴貨運仲介預付燃油費和即時付款。這種分散化使得貨運經紀人能夠在數小時內重新安排貨物運輸離職率,從而保護仲介免受單一貨運公司破產的影響。同時,這也有助於保護仲介免受違約風險,並在貨運公司頻繁退出市場的情況下維持服務水準。
現貨票價的波動給仲介的利潤率帶來了壓力。
2024年,乾貨廂式貨車(一般貨櫃)的現貨運費在每英里1.45美元至2.10美元之間波動,波動幅度高達45%。如果合約定價延遲數月,仲介的利潤將迅速縮水。由於托運人抵制合約期間內運費的調整,仲介被迫要麼自行承擔損失,要麼退出無利可圖的航線。 CH Robinson在2024年第二季報告的利潤率下降280個基點,就印證了這一點。 Echo Global 物流採取了動態定價策略,每月重新報價以緩解利潤率波動,但這給採購團隊帶來了挑戰,因為預測變得更加困難。雖然擁有大量資產的仲介可以利用自有設施來緩解波動,但純粹的仲介業者仍然會受到全面影響。
細分市場分析
到2025年,整車運輸(FTL)將占美國貨運經紀市場的63.63%,反映了其在汽車和零售貨物運輸領域的主導地位,這兩個領域的特點是運輸量大。同時,由於零售商將貨物拆分成更小的批次,並轉向每日小批量配送以降低庫存持有成本,預計2026年至2031年期間,零擔運輸(LTL)將以8.79%的複合年成長率成長。隨著仲介實施多點路線規劃演算法並在托運人之間整合零擔貨物,美國零擔貨運經紀市場預計將穩步擴張。聯邦快遞貨運(FedEx Freight)在2024年第三季的零擔貨運量增加了12%,凸顯了能夠在需求分散的環境下高效調整裝卸貨安排的仲介的優勢。另一方面,整車貨運仲介正在使用數位看板來匹配返程路線並減少空駛里程。 Yellow Corporation的退出導致全國零擔貨運能力下降了12%,迫使仲介支付更高的運費。然而,由此造成的運輸服務缺口已開始被一些精通技術的仲介業者填補。
零擔運輸的成長也得益於將庫存更靠近消費者的在地化配送策略。提供整車運輸和零擔運輸相結合的混合提貨服務的仲介,在交易雙方都獲得了額外的利潤。由於多地點運輸存在更高的索賠風險,擁有自動化理賠系統和全面貨物保險的仲介正在獲得競爭優勢。整車運輸仍然是長途補貨運輸的重要組成部分,但市場正在趨於成熟。同時,隨著電子商務訂單規模的縮小,零擔運輸具有巨大的成長潛力。
2025年,乾貨車佔車輛相關收入的44.57%,但從2026年到2031年,冷藏貨車的貨運量預計將以9.89%的複合年成長率成長,超過所有其他類型的拖車。隨著藥品和食品電商良好分銷規範(GDP)的普及,持續的溫度控制和感測器監控成為必要,而這些服務需額外收取20-30%的運費。因此,由於經紀人將合規相關的附加費轉嫁給客戶,美國冷藏貨物經紀市場的規模成長速度超過了貨運量的成長速度。平板車和階梯式平板車的需求穩定,主要來自1100億美元道路和橋樑改善計劃資助的基礎設施項目。油罐拖車在化學品和散裝液體運輸領域佔據著一定的市場佔有率,但仲介環保署(EPA)更嚴格的監管限制了仲介進入該市場。
2024年,乾貨車(用於普通貨物運輸)的利用率降至92%。這是因為供給能力超過需求,導致利潤率承壓。相較之下,冷藏拖車的數量年增率僅2%,而需求年增率卻高達6-8%,造成供應緊張。投資於溫度追蹤遠端資訊處理技術的仲介可以從競爭對手中脫穎而出,並降低貨物劣化的風險,尤其是在高價值藥品運輸路線上。特種拖車(汽車運輸車、牲畜運輸車、氣罐車等)雖然規模較小,但盈利豐厚,與承運商建立牢固的合作關係可以帶來穩定的收入。
其他好處:
- Excel格式的市場預測(ME)表
- 3個月的分析師支持
目錄
第1章:引言
- 市場分析與定義的前提條件
- 分析範圍
第2章 分析方法
第3章執行摘要
第4章 市場狀況
- 市場概覽
- 市場促進因素
- 電子商務交易量激增以及人們對隔天達服務的期望。
- 運輸業的高度分散性使得仲介的重要性日益凸顯。
- TMS/API整合的快速數位化
- 貨主需要針對碳足跡最佳化的路線規劃
- 透過私募股權投資和將業務外包給仲介來整合貨運公司
- 美國和墨西哥之間的近岸外包和跨境業務擴張
- 市場限制因素
- 現貨票價的波動給中間商利潤帶來了壓力。
- 促進要素短缺和運輸能力的不確定性
- 與擬議引入 AB5 法案和限速器相關的合規成本。
- 透過數位貨運平台直接與貨主簽訂合約
- 價值鍊和供應鏈分析
- 監理情勢
- 技術展望
- 波特五力分析
第5章:預測市場規模與成長率
- 按服務
- 整車運輸 (FTL)
- 零擔運輸(大對大卡車運輸)
- 其他
- 依設備/拖車類型
- 乾燒
- 冷藏車
- 平板/階梯式平板車
- 油輪(散裝液體和化學品)
- 其他
- 按運輸距離
- 長途(500英里或以上)
- 按地區(100-500英里)
- 近距離(不到100英里)
- 按經營模式
- 傳統貨運代理
- 基於資產的貨運經紀
- 代理貨運經紀
- 數位貨運代理
- 按最終用戶行業分類
- 製造業/汽車
- 建築和基礎設施項目
- 石油、天然氣、採礦和化工
- 農業/食品/飲料
- 零售、日常消費品和批發分銷
- 醫療和藥品
- 電子商務與第三方物流履約
- 其他終端用戶產業
- 按客戶規模
- 大型企業貨運商(年營業額超過1億美元)
- 中型貨運公司(年營業額1000萬美元至1億美元)
- 小型企業(營業額低於1000萬美元)
- 按地區
- 東北
- 中西部
- 東南部
- 西南
- 西
第6章 競爭情勢
- 市場集中度
- 策略趨勢
- 市佔率分析
- 公司簡介
- Allen Lund Company
- ArcBest Corporation
- Arrive Logistics
- BlueGrace Logistics
- BNSF Logistics
- CH Robinson
- Convoy Inc.
- Echo Global Logistics
- GlobalTranz(WWEX)
- Hub Group
- JB Hunt Transportation
- Landstar System, Inc.
- Mode Global
- Nolan Transportation Group
- Red Technologies
- Redwood Logistics
- Schneider FreightPlus
- SunteckTTS
- Total Quality Logistics(TQL)
- Trinity Logistics
- Uber Freight
- United Parcel Service of America, Inc.(UPS)
- Worldwide Express
- XPO, Inc.
第7章 市場機會與未來展望
According to Mordor Intelligence, the United States freight brokerage market size is expected to grow from USD 19.68 billion in 2025 to USD 21.28 billion in 2026 and is forecast to reach USD 30.17 billion by 2031 at 7.23% CAGR over 2026-2031.
This report is Segmented by Service (FTL and More), Equipment Type (Dry Van, Tanker, and More), Haul Length (Long-Haul, Regional, and Local), Business Model (Traditional Freight Brokerage and More), End-User Industry (Manufacturing & Automotive and More), Customer Size (Small Businesses and More), and Geography (Northeast and More). The Market Forecasts are Provided in Terms of Value (USD).
United States Freight Brokerage Market Trends and Insights
E-Commerce Volume Surge and Next-Day Delivery Expectations
United States e-commerce sales exceeded USD 1.1 trillion in 2024, and fulfillment centers now sit within 50 miles of 90% of the population. These dense networks compress delivery windows to a single day, prompting shippers to engage brokers that aggregate regional carriers and can guarantee capacity in real time. Amazon added 1,000 last-mile delivery stations, spawning short shuttle runs that brokers match against backhaul capacity. Traditional retailers such as Walmart accelerated last-mile technology adoption, broadening demand for brokers able to orchestrate multi-leg, time-sensitive flows. Order cycles have shifted from weekly to daily replenishment, requiring live truck-location data and mobile integrations rather than phone-based dispatch. Platforms delivering rate quotes in under 30 seconds continue to win bids in this fast-turn environment.
Highly Fragmented Carrier Base Increases Broker Relevance
More than 1.2 million active motor carriers operate in the United States, and 97% run fleets smaller than 20 trucks. The long tail of micro-fleets lacks the balance sheets and back-office systems to bid on enterprise freight, creating an information asymmetry that brokers monetize through load aggregation and faster payment cycles. Driver turnover at small carriers exceeded 90% in 2024, and many owner-operators rely on brokers for fuel advances and same-day pay. This fragmentation protects shippers from single-carrier failure because brokers can reroute cargo within hours. It also shields brokers from default risk and stabilizes service levels despite frequent carrier exits.
Spot-Rate Volatility Compresses Brokerage Margins
Dry-van spot rates fluctuated between USD 1.45 and USD 2.10 per mile during 2024, a 45% swing that quickly erodes broker margins when contract pricing lags by several months. As shippers resist mid-cycle rate resets, brokers either absorb losses or exit unprofitable lanes, as evidenced by a 280-basis-point margin decline reported by C.H. Robinson in Q2 2024. Echo Global Logistics responded with dynamic pricing that re-quotes monthly, lowering margin volatility but creating forecasting challenges for procurement teams. Asset-heavy brokers can cushion swings with their own equipment, but pure intermediaries remain fully exposed.
Other drivers and restraints analyzed in the detailed report include:
- Rapid Digitization of TMS And API Integrations
- Shipper Demand for Carbon-Optimized Routing
- Driver Shortage and Capacity Unpredictability
For complete list of drivers and restraints, kindly check the Table Of Contents.
Segment Analysis
Full-Truckload occupied 63.63% of the United States freight brokerage market in 2025, reflecting its primacy in high-volume automotive and retail shipments. Yet Less-than-Truckload is set to grow at an 8.79% CAGR between 2026-2031 as retailers split loads into smaller, daily shipments to cut inventory carrying costs. The United States freight brokerage market size for LTL is projected to expand steadily as brokers integrate multi-stop routing algorithms and consolidate partial loads across shippers. FedEx Freight recorded 12% LTL volume growth in Q3 2024, highlighting how fragmented demand favors brokers who can orchestrate dock schedules efficiently. FTL brokers, meanwhile, rely on digital boards to match backhauls and curb empty miles. Yellow Corporation's exit removed 12% of national LTL capacity, pushing brokers to pay premium rates but also opening a service gap that tech-savvy intermediaries have begun to fill.
LTL growth is also propelled by regional distribution strategies that position stock closer to consumers. Brokers offering hybrid FTL-LTL consolidation services capture incremental margin on both sides of the transaction. Damage-claim risk is higher on multi-stop moves, so brokers with automated claims handling and enhanced cargo insurance policies gain competitive traction. FTL remains indispensable for long-haul replenishment but is maturing, whereas LTL offers outsized upside as e-commerce order sizes shrink.
Dry Van accounted for 44.57% of 2025 equipment revenue, but Refrigerated Van tonnage is projected to outpace all other trailer types at a 9.89% CAGR between 2026-2031. Pharmaceutical Good Distribution Practice rules and grocery e-commerce growth require continuous temperature control and sensor-based monitoring, services that command 20-30% rate premiums. The United States freight brokerage market size for reefer freight is therefore rising faster than underlying volume as brokers pass through compliance-related surcharges. Flatbed and step-deck equipment enjoy steady demand from infrastructure projects funded under the USD 110 billion roads-and-bridges program. Tanker trailers retain a niche around chemicals and bulk liquids but face stricter EPA oversight, limiting brokerage participation.
Dry Van utilization slipped to 92% in 2024 as capacity outstripped demand, suppressing margins. Conversely, the reefer fleet grew only 2% annually versus 6-8% demand, tightening supply. Brokers that invest in temperature-tracking telematics differentiate themselves and can mitigate spoilage risk, especially in high-value pharmaceutical lanes. Specialized trailers - car carriers, livestock haulers, pneumatic tanks - remain small but profitable sectors where deep carrier relationships provide defensible earnings.
Complete Report Scope:
- By Service
- Full-Truckload (FTL)
- Less-than-Truckload (LTL)
- Others
- By Equipment / Trailer Type
- Dry Van
- Refrigerated Van
- Flatbed / Step-Deck
- Tanker (Bulk Liquid and Chemical)
- Others
- By Haul Length
- Long-Haul (More than 500 miles)
- Regional (100-500 miles)
- Local (Lesser than 100 miles)
- By Business Model
- Traditional Freight Brokerage
- Asset-Based Freight Brokerage
- Agent Model Freight Brokerage
- Digital Freight Brokerage
- By End-User Industry
- Manufacturing and Automotive
- Construction and Infrastructure Projects
- Oil, Gas, Mining and Chemicals
- Agriculture and Food / Beverage
- Retail, FMCG and Wholesale Distribution
- Healthcare and Pharmaceuticals
- E-commerce and 3PL Fulfilment
- Other End-User Industry
- By Customer Size
- Large Enterprise Shippers (Greater than USD 100 M)
- Mid-Market Shippers (USD 10-100 M)
- Small Businesses (Lesser than USD 10 M)
- By Geography
- Northeast
- Midwest
- Southeast
- Southwest
- West
List of Companies Covered in this Report:
- Allen Lund Company
- ArcBest Corporation
- Arrive Logistics
- BlueGrace Logistics
- BNSF Logistics
- C.H. Robinson
- Convoy Inc.
- Echo Global Logistics
- GlobalTranz (WWEX)
- Hub Group
- J.B. Hunt Transportation
- Landstar System, Inc.
- Mode Global
- Nolan Transportation Group
- Red Technologies
- Redwood Logistics
- Schneider FreightPlus
- SunteckTTS
- Total Quality Logistics (TQL)
- Trinity Logistics
- Uber Freight
- United Parcel Service of America, Inc. (UPS)
- Worldwide Express
- XPO, Inc.
Additional Benefits:
- The market estimate (ME) sheet in Excel format
- 3 months of analyst support
TABLE OF CONTENTS
1 Introduction
- 1.1 Study Assumptions and Market Definition
- 1.2 Scope of the Study
2 Research Methodology
3 Executive Summary
4 Market Landscape
- 4.1 Market Overview
- 4.2 Market Drivers
- 4.2.1 E-Commerce Volume Surge and Next-Day Delivery Expectations
- 4.2.2 Highly Fragmented Carrier Base Boosts Broker Relevance
- 4.2.3 Rapid Digitisation of TMS / API Integrations
- 4.2.4 Shipper Demand for Carbon-Footprint-Optimised Routing
- 4.2.5 PE-Backed Shipper Consolidation Outsourcing to Brokers
- 4.2.6 Nearshoring and US-Mexico Cross-Border Expansion
- 4.3 Market Restraints
- 4.3.1 Spot-Rate Volatility Compressing Brokerage Margins
- 4.3.2 Driver Shortage and Capacity Unpredictability
- 4.3.3 Compliance Costs from AB5, Speed-Limiter Proposals
- 4.3.4 Shipper Direct Contracting via Digital Load Boards
- 4.4 Value / Supply-Chain Analysis
- 4.5 Regulatory Landscape
- 4.6 Technological Outlook
- 4.7 Porter's Five Forces Analysis
- 4.7.1 Bargaining Power of Suppliers
- 4.7.2 Bargaining Power of Buyers
- 4.7.3 Threat of New Entrants
- 4.7.4 Threat of Substitutes
- 4.7.5 Competitive Rivalry
5 Market Size and Growth Forecasts
- 5.1 By Service
- 5.1.1 Full-Truckload (FTL)
- 5.1.2 Less-than-Truckload (LTL)
- 5.1.3 Others
- 5.2 By Equipment / Trailer Type
- 5.2.1 Dry Van
- 5.2.2 Refrigerated Van
- 5.2.3 Flatbed / Step-Deck
- 5.2.4 Tanker (Bulk Liquid and Chemical)
- 5.2.5 Others
- 5.3 By Haul Length
- 5.3.1 Long-Haul (More than 500 miles)
- 5.3.2 Regional (100-500 miles)
- 5.3.3 Local (Lesser than 100 miles)
- 5.4 By Business Model
- 5.4.1 Traditional Freight Brokerage
- 5.4.2 Asset-Based Freight Brokerage
- 5.4.3 Agent Model Freight Brokerage
- 5.4.4 Digital Freight Brokerage
- 5.5 By End-User Industry
- 5.5.1 Manufacturing and Automotive
- 5.5.2 Construction and Infrastructure Projects
- 5.5.3 Oil, Gas, Mining and Chemicals
- 5.5.4 Agriculture and Food / Beverage
- 5.5.5 Retail, FMCG and Wholesale Distribution
- 5.5.6 Healthcare and Pharmaceuticals
- 5.5.7 E-commerce and 3PL Fulfilment
- 5.5.8 Other End-User Industry
- 5.6 By Customer Size
- 5.6.1 Large Enterprise Shippers (Greater than USD 100 M)
- 5.6.2 Mid-Market Shippers (USD 10-100 M)
- 5.6.3 Small Businesses (Lesser than USD 10 M)
- 5.7 By Geography
- 5.7.1 Northeast
- 5.7.2 Midwest
- 5.7.3 Southeast
- 5.7.4 Southwest
- 5.7.5 West
6 Competitive Landscape
- 6.1 Market Concentration
- 6.2 Strategic Moves
- 6.3 Market Share Analysis
- 6.4 Company Profiles (includes Global level Overview, Market level overview, Core Segments, Financials as available, Strategic Information, Market Rank/Share for key companies, Products and Services, and Recent Developments)
- 6.4.1 Allen Lund Company
- 6.4.2 ArcBest Corporation
- 6.4.3 Arrive Logistics
- 6.4.4 BlueGrace Logistics
- 6.4.5 BNSF Logistics
- 6.4.6 C.H. Robinson
- 6.4.7 Convoy Inc.
- 6.4.8 Echo Global Logistics
- 6.4.9 GlobalTranz (WWEX)
- 6.4.10 Hub Group
- 6.4.11 J.B. Hunt Transportation
- 6.4.12 Landstar System, Inc.
- 6.4.13 Mode Global
- 6.4.14 Nolan Transportation Group
- 6.4.15 Red Technologies
- 6.4.16 Redwood Logistics
- 6.4.17 Schneider FreightPlus
- 6.4.18 SunteckTTS
- 6.4.19 Total Quality Logistics (TQL)
- 6.4.20 Trinity Logistics
- 6.4.21 Uber Freight
- 6.4.22 United Parcel Service of America, Inc. (UPS)
- 6.4.23 Worldwide Express
- 6.4.24 XPO, Inc.
7 Market Opportunities and Future Outlook
- 7.1 White-space and Unmet-Need Assessment

 貨運代理市場:依運輸方式、服務類型、最終用戶和地區分類。
 2026年全球仲介業者轉運板市場報告
 歐洲貨運代理服務:市場佔有率分析、行業趨勢和統計數據以及成長預測(2026-2031 年)法國貨運代理服務:市場佔有率分析、行業趨勢和統計數據以及成長預測(2026-2031 年)西班牙貨運代理服務:市場佔有率分析、行業趨勢和統計數據以及成長預測(2026-2031 年)貨運代理服務:市場佔有率分析、產業趨勢與統計、成長預測(2026-2031 年)東協貨運代理服務:市場佔有率分析、產業趨勢與統計及成長預測(2026-2031)北美貨運代理服務:市場佔有率分析、行業趨勢和統計數據以及成長預測(2026-2031 年)德國貨運代理服務:市場佔有率分析、行業趨勢和統計數據以及成長預測(2026-2031 年)
 貨運代理服務市場:依服務類型、運輸方式、客戶規模、貨物類型、技術應用及最終用戶產業分類-2026-2032年全球市場預測