


 |
市場調查報告書
商品編碼
2063314
東協貨運代理服務:市場佔有率分析、產業趨勢與統計及成長預測(2026-2031)ASEAN Freight Brokerage Services - Market Share Analysis, Industry Trends & Statistics, Growth Forecasts (2026 - 2031) |
||||||

※ 本網頁內容可能與最新版本有所差異。詳細情況請與我們聯繫。
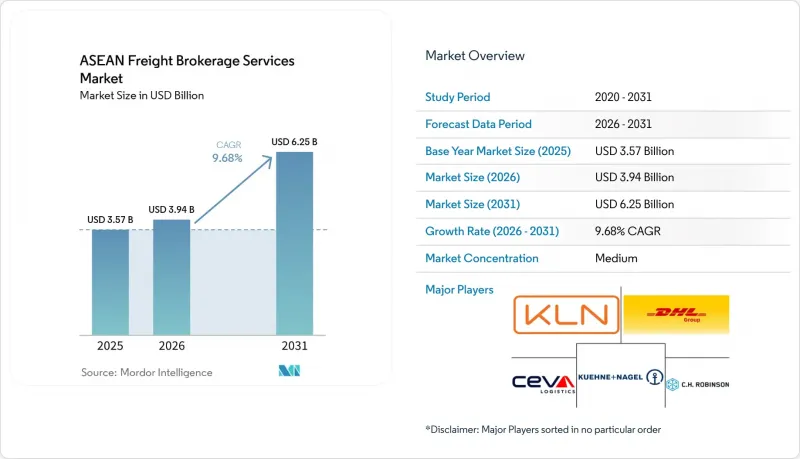
根據 Mordor Intelligence 預測,東協地區的貨運代理服務市場規模將從 2025 年的 35.7 億美元成長到 2026 年的 39.4 億美元,到 2031 年將達到 62.5 億美元,2026 年至 2031 年的複合年成長率為 9.68%。
本報告按服務類型(整車運輸、零擔運輸、其他)、車輛類型(廂型車、冷藏車、平板車、罐車、其他)、運輸距離(長途、區域內、近距離)、經營模式(傳統模式、自有模式、代理模式、數位化模式)、最終用戶(製造業、建設業、農業、零售業等地區、客戶規模(大型企業)、中型企業(大型企業)市場預測(價值,美元)。
東協貨運代理服務市場趨勢與洞察
「中國+1」供應商將拼箱(LCL)貨物近岸外包的現象正在迅速增加。
採購來源多元化意味著單一訂單將被分配到東協地區的多個工廠,導致需要熟練的拼箱安排的子貨櫃運輸量增加。預計到2025年,越南對美國的電子設備出口將達到歷史新高,其零件將在跨太平洋航行前從馬來西亞和泰國的工廠進行拼箱。透過整合互補路線上的小批量貨物,數位化平台可以將單位運輸成本降低高達35%。雖然協調關稅編碼和原產地規則相關的單證工作日益複雜,但精通技術的仲介正在將其轉化為加值服務。儘管運力短缺仍然是一個風險因素,但在高成長航線上,運輸量的成長足以抵銷成本的不利影響。
人工智慧驅動的預測性競標和現貨票價的動態自動化
這台機器學習引擎能夠以高達 85% 的準確率預測托運人的可用性和最佳競標時機,平台每四小時更新一次現貨價格,以反映每條航線的需求和燃油價格波動。已採用這些工具的航線,其航空運輸比例下降了 12% 至 18%,往返仲介的利潤率也有所提高。新加坡和馬來西亞的採用率最高,這得益於其成熟的雲端基礎設施以及與托運人的 EDI 整合。緬甸和柬埔寨的中小型仲介缺乏實施類似系統的資金和技能,加劇了數位落差。隨著技術先進的營運商以低於傳統仲介的價格提供服務,種種跡象表明,持續的投資將加速產業整合。
東協內陸地區貨櫃底盤設施長期失衡
在越南中部和印尼離島等出口密集地區,貨櫃滯留時,仲介每批貨物需承擔300至550美元的搬遷費用。返程空箱率仍維持在50%左右,降低了資產運轉率。此外,在高峰期,冷藏貨櫃和超大貨櫃的前置作業時間可能長達一周,延誤拼箱貨物的提取。印尼地區的情況更為嚴峻,因為滯留在小規模上的底盤很少能有效流通。如果沒有政策干預或拼箱平台,運力不足的問題將繼續擠壓利潤空間。
細分市場分析
預計到2025年,整車運輸(FTL)將佔總收入的61.00%,這反映了其在大規模生產路線上的主導地位。然而,由於「中國+1」策略的實施,訂單被分配到東協地區的多個工廠,零擔運輸(LTL)正以12.20%的複合年成長率成長。數位化拼箱服務商目前正將來自越南、馬來西亞和泰國的零散托盤貨物拼裝到運往美國的貨櫃中,從而將到港成本降低高達35%。基於預測的裝載計劃和自動化單證處理正在防止曾經困擾拼箱貨仲介業務的利潤率下滑。雖然整車運輸對重工業仍然至關重要,但隨著準時制庫存模式的興起,頻繁的小規模運輸更受青睞,其佔有率正在下降。
成長潛力也體現在專業化的加值服務中。溫控零擔運輸路線將符合GDP標準的貨物處理與基於區塊鏈的批次追蹤相結合,為疫苗運輸設定了更高的費率。柔佛和新加坡之間的當日跨境微型零擔運輸計畫旨在滿足歐盟無法等待滿載的補貨週期。擁有動態路線規劃引擎的仲介將這些機會整合到其常規網路中,即使在淡季也能保持85-90%的運轉率。因此,他們獲得了穩定的收入來源,不易受散貨市場週期性波動的影響。
到2025年,乾貨車的市佔率將達到48.94%,但隨著疫苗分發和生鮮食品出口的成長,冷藏貨車市場保持強勁成長,到2031年複合年成長率將達到13.52%。曼谷和胡志明市的製藥產業叢集現在要求在競標中提供全程溫度記錄,並且要求仲介對感測器的完整性和駕駛員的合規性進行認證。配備物聯網技術的冷藏集裝箱透過發送即時警報並將藥品變質率控制在0.5%以下,從而確保了來自全球製藥公司的重複訂單。電子和紡織業對乾貨車的需求仍然強勁,但由於現貨運輸能力的波動導致市場上出現大量過剩貨車,利潤空間受到擠壓。
平板拖車和階梯式拖車受益於高速公路基礎設施投資以及風力發電廠部件的運輸,而罐車則支持區域化學品運輸。然而,真正的競爭焦點在於數據視覺性。將特定路線的溫度變化納入運費計算的仲介,比那些僅確保運力的普通貨運代理,更有資格收取更高的定價。隨著投資者尋求符合環境、社會和治理(ESG)標準的資產,配備電動冷凍裝置和太陽能監控系統的車輛能夠降低資金籌措成本,並正在推動低溫運輸仲介業務的成長。
其他好處:
- Excel格式的市場預測(ME)表
- 3個月的分析師支持
目錄
第1章:引言
- 研究假設和市場定義
- 調查範圍
第2章:調查方法
第3章執行摘要
第4章 市場狀況
- 市場概覽
- 市場促進因素
- 人工智慧驅動的預測性競標和動態現貨價格自動化
- 由於東協海關單一窗口系統第二階段的推出,等待時間縮短。
- 綠色貨運走廊的興起與ESG掛鉤的航運融資
- LCL整合的激增是由「中國+1」供應商的近岸外包所推動的。
- 區域低溫運輸醫藥中心的擴張促進了溫控仲介業務的發展。
- 海運保險費向其他海運轉運樞紐轉移
- 市場限制因素
- 東協內陸地區貨櫃和底盤設施長期失衡
- 關於數位仲介的許可和資料本地化義務的監管模糊性。
- 二級閘道器內部長期存在連接埠擁塞和連線不足的問題。
- 外匯波動導致的避險成本給證券公司的利潤率帶來了壓力。
- 價值供應鏈分析
- 監理情勢
- 技術展望
- 波特五力模型
第5章 市場規模與成長預測
- 按服務
- 全軌道公路(FTL)
- 低於100%的運費(零擔運輸)
- 其他
- 按設備類型/按拖車類型
- 乾燒
- 冷藏車
- 平板/階梯式平板車
- 油輪(散裝液體和化學品)
- 其他
- 按運輸距離
- 長途運輸(超過 500 英里)
- 按地區(100-500英里)
- 近距離(不到100英里)
- 按經營模式
- 傳統貨運代理
- 資產持有型貨運經紀
- 代理貨運經紀
- 數位貨運代理
- 按最終用戶行業分類
- 製造業/汽車
- 建築和基礎設施項目
- 石油、天然氣、採礦、化工
- 農業/食品/飲料
- 零售、快速消費品和批發分銷
- 醫療和藥品
- 電子商務與第三方物流履約
- 其他終端用戶產業
- 按客戶規模
- 大型企業貨運商(年營業額超過1億美元)
- 中型貨運公司(年營業額1000萬美元至1億美元)
- 中小企業(營業額低於1000萬美元)
- 國家
- 印尼
- 越南
- 泰國
- 馬來西亞
- 菲律賓
- 新加坡
- 緬甸
- 柬埔寨
- 寮國
- 汶萊
第6章 競爭情勢
- 市場集中度
- 策略舉措和趨勢
- 市佔率分析
- 公司簡介
- DHL Group
- Kuehne+Nagel
- Kerry Logistics Network
- CEVA Logistics
- CH Robinson
- Nippon Express
- DSV
- Yusen Logistics
- Expeditors International
- Transporeon
- CJ Logistics
- Forto
- Tiong Nam Logistics
- Linc Group
- Geodis
- Rhenus Logistics
- Hellmann Worldwide Logistics
- APX Logistics Solutions Co., Ltd
- Haulio
- Logisly
第7章 市場機會與未來展望
According to Mordor Intelligence, the aSEAN freight brokerage services market size is expected to grow from USD 3.57 billion in 2025 to USD 3.94 billion in 2026 and is forecast to reach USD 6.25 billion by 2031 at a 9.68% CAGR over 2026-2031.
This report is Segmented by Service (FTL, LTL, Others), by Equipment (Dry Van, Refrigerated, Flatbed, Tanker, Others), by Haul Length (Long-Haul, Regional, Local), by Business Model (Traditional, Asset-Based, Agent, Digital), by End-User (Manufacturing, Construction, Agriculture, Retail, and More), by Customer Size (Large, Mid-Market, Small), and Geography. Market Forecasts in Value (USD)
ASEAN Freight Brokerage Services Market Trends and Insights
Nearshoring Surge in LCL Consolidation from "China + 1" Suppliers
Diversified sourcing sends single orders across several ASEAN factories, swelling sub-container loads that require skilled consolidation. Vietnam's electronics exports to the U.S. hit record highs in 2025, with components pooled from plants in Malaysia and Thailand before trans-Pacific sailings. Digital platforms that blend fractional freight across complementary routes cut per-unit shipping costs by up to 35%. Harmonizing tariff codes and rules-of-origin paperwork adds complexity that tech-savvy brokers monetize as a premium service. Equipment shortages still pose a risk, but the volume upside outweighs the cost headwinds in high-growth lanes.
AI-Driven Predictive Tendering & Dynamic Spot-Rate Automation
Machine-learning engines predict carrier availability and ideal tender timing with up to 85% accuracy, letting platforms refresh spot quotes every four hours to reflect lane-level demand shifts and fuel movements. Empty-mile ratios have fallen 12-18% on corridors that adopt these tools, lifting brokerage margins on round trips. Singapore and Malaysia show the highest uptake because cloud infrastructure and carrier EDI integration are mature. Smaller brokers in Myanmar and Cambodia lack the capital and skills to deploy comparable systems, widening the digital divide. Continued investment signals faster consolidation as tech-enabled players undercut legacy brokers.
Chronic Container and Chassis Equipment Imbalance Within ASEAN Hinterlands
Brokers absorb USD 300-550 per move in repositioning fees when boxes pile up in export-heavy zones such as Central Vietnam and outlying Indonesian islands. Empty-mile ratios still hover near 50% on return legs, throttling asset utilization. Refrigerated and out-of-gauge equipment lead-time now stretches to a week in peak months, delaying LCL consolidations. Indonesia's geography compounds the deficit because chassis stranded on smaller islands rarely cycle back efficiently. Without policy interventions or pooling platforms, equipment scarcity will keep trimming margins.
Other drivers and restraints analyzed in the detailed report include:
- ASEAN Customs Single Window Phase II Roll-Out Compressing Dwell Times
- Emergence of Green Freight Corridors & ESG-Linked Shipping Finance
- Enduring Port Congestion at Secondary Gateways and Inland Connectivity Gaps
For complete list of drivers and restraints, kindly check the Table Of Contents.
Segment Analysis
Full-truckload (FTL) transport held 61.00% of the overall 2025 revenue, reflecting its grip on bulk manufacturing lanes. Yet, less-than-truckload (LTL) is advancing at a 12.20% CAGR because China + 1 strategies splinter orders across multiple ASEAN plants. Digital consolidators now sweep partial pallets from Vietnam, Malaysia, and Thailand into single containers for U.S. sailings, shrinking landed costs by up to 35%. Predictive cube-planning and automated documentation prevent the margin erosion that once plagued LCL brokerage. FTL remains indispensable for heavy industry, but its share edges lower as just-in-time inventory models favor frequent, smaller moves.
Growth potential also lies in specialized add-ons. Temperature-controlled LTL lanes bundle GDP-compliant handling with blockchain lot tracking for vaccines, commanding premium rates. Same-day cross-border micro-LTL projects between Johor and Singapore target e-commerce replenishment cycles that cannot wait for full loads. Brokers equipped with dynamic routing engines stitch these opportunities into scheduled networks that run at 85-90% utilization even in off-peak weeks. The result is a resilient revenue mix less exposed to cyclical bulk-cargo swings.
Dry vans dominated at 48.94% share in 2025, but refrigerated vans registered a brisk 13.52% CAGR through 2031 as vaccine distribution and fresh-food exports multiply. Pharma clusters in Bangkok and Ho Chi Minh City now specify end-to-end temperature logs in tenders, obliging brokers to prove sensor integrity and driver compliance. IoT-enabled reefers transmit real-time alerts that cut spoilage claims below 0.5%, winning repeat orders from global drug makers. Dry-van demand endures for electronics and textiles, yet margins compress when spot capacity swings flood the market with extra trucks.
Flatbed and step-deck trailers ride infrastructure spending on highways and wind-farm components, while tankers support regional chemical flows. Still, the real battleground is data visibility. Brokers embedding lane-level temperature variance into rate formulas justify premiums over commodity forwarders who merely procure capacity. As investors chase ESG-aligned assets, fleets with electric refrigeration units and solar-powered monitoring draw lower financing costs, reinforcing the growth loop in cold-chain brokerage.
List of Companies Covered in this Report:
- DHL Group
- Kuehne + Nagel
- Kerry Logistics Network
- CEVA Logistics
- C.H. Robinson
- Nippon Express
- DSV
- Yusen Logistics
- Expeditors International
- Transporeon
- CJ Logistics
- Forto
- Tiong Nam Logistics
- Linc Group
- Geodis
- Rhenus Logistics
- Hellmann Worldwide Logistics
- APX Logistics Solutions Co., Ltd
- Haulio
- Logisly
Additional Benefits:
- The market estimate (ME) sheet in Excel format
- 3 months of analyst support
TABLE OF CONTENTS
1 Introduction
- 1.1 Study Assumptions and Market Definition
- 1.2 Scope of the Study
2 Research Methodology
3 Executive Summary
4 Market Landscape
- 4.1 Market Overview
- 4.2 Market Drivers
- 4.2.1 AI-Driven Predictive Tendering and Dynamic Spot-Rate Automation
- 4.2.2 ASEAN Customs Single Window Phase II Roll-Out Compressing Dwell Times
- 4.2.3 Emergence of Green Freight Corridors and ESG-Linked Shipping Finance
- 4.2.4 Nearshoring-Driven Surge in LCL Consolidation from "China + 1" Suppliers
- 4.2.5 Expansion of Regional Cold-Chain Pharma Hubs Boosting Temperature-Controlled Brokerage
- 4.2.6 Shift of Marine Insurance Premia Toward Alternate Sea Trans-Shipment Hubs
- 4.3 Market Restraints
- 4.3.1 Chronic Container and Chassis Equipment Imbalance within ASEAN Hinterlands
- 4.3.2 Regulatory Ambiguity on Digital-Broker Licensing and Data-Localization Mandates
- 4.3.3 Enduring Port Congestion at Secondary Gateways and Inland Connectivity Gaps
- 4.3.4 Currency-Volatility-Driven Hedging Costs Compressing Brokerage Margins
- 4.4 Value / Supply-Chain Analysis
- 4.5 Regulatory Landscape
- 4.6 Technological Outlook
- 4.7 Porter's Five Forces
- 4.7.1 Threat of New Entrants
- 4.7.2 Bargaining Power of Suppliers
- 4.7.3 Bargaining Power of Buyers
- 4.7.4 Threat of Substitutes
- 4.7.5 Competitive Rivalry
5 Market Size and Growth Forecasts (Value)
- 5.1 By Service
- 5.1.1 Full-Truckload (FTL)
- 5.1.2 Less-than-Truckload (LTL)
- 5.1.3 Others
- 5.2 By Equipment / Trailer Type
- 5.2.1 Dry Van
- 5.2.2 Refrigerated Van
- 5.2.3 Flatbed / Step-Deck
- 5.2.4 Tanker (Bulk Liquid and Chemical)
- 5.2.5 Others
- 5.3 By Haul Length
- 5.3.1 Long-Haul (More than 500 miles)
- 5.3.2 Regional (100-500 miles)
- 5.3.3 Local (Less than 100 miles)
- 5.4 By Business Model
- 5.4.1 Traditional Freight Brokerage
- 5.4.2 Asset-Based Freight Brokerage
- 5.4.3 Agent Model Freight Brokerage
- 5.4.4 Digital Freight Brokerage
- 5.5 By End-User Industry
- 5.5.1 Manufacturing and Automotive
- 5.5.2 Construction and Infrastructure Projects
- 5.5.3 Oil, Gas, Mining and Chemicals
- 5.5.4 Agriculture and Food / Beverage
- 5.5.5 Retail, FMCG and Wholesale Distribution
- 5.5.6 Healthcare and Pharmaceuticals
- 5.5.7 E-commerce and 3PL Fulfilment
- 5.5.8 Other End-User Industry
- 5.6 By Customer Size
- 5.6.1 Large Enterprise Shippers (More than USD 100 M)
- 5.6.2 Mid-Market Shippers (USD 10-100 M)
- 5.6.3 Small Businesses (Less than USD 10 M)
- 5.7 By Country
- 5.7.1 Indonesia
- 5.7.2 Vietnam
- 5.7.3 Thailand
- 5.7.4 Malaysia
- 5.7.5 Philippines
- 5.7.6 Singapore
- 5.7.7 Myanmar
- 5.7.8 Cambodia
- 5.7.9 Laos
- 5.7.10 Brunei
6 Competitive Landscape
- 6.1 Market Concentration
- 6.2 Strategic Moves and Developments
- 6.3 Market Share Analysis
- 6.4 Company Profiles (includes Global level Overview, Market level overview, Core Segments, Financials as available, Strategic Information, Market Rank/Share for key companies, Products and Services, and Recent Developments)
- 6.4.1 DHL Group
- 6.4.2 Kuehne + Nagel
- 6.4.3 Kerry Logistics Network
- 6.4.4 CEVA Logistics
- 6.4.5 C.H. Robinson
- 6.4.6 Nippon Express
- 6.4.7 DSV
- 6.4.8 Yusen Logistics
- 6.4.9 Expeditors International
- 6.4.10 Transporeon
- 6.4.11 CJ Logistics
- 6.4.12 Forto
- 6.4.13 Tiong Nam Logistics
- 6.4.14 Linc Group
- 6.4.15 Geodis
- 6.4.16 Rhenus Logistics
- 6.4.17 Hellmann Worldwide Logistics
- 6.4.18 APX Logistics Solutions Co., Ltd
- 6.4.19 Haulio
- 6.4.20 Logisly
7 Market Opportunities and Future Outlook
- 7.1 White-space and Unmet-Need Assessment

 金融資產中介服務市場規模、佔有率和成長分析:按資產類型、服務類型、客戶類型、服務管道、經營模式和地區分類-產業預測,2026-2033年
 美國貨運代理市場:市場佔有率分析、產業趨勢與統計、成長預測(2026-2031)歐洲貨運代理服務:市場佔有率分析、行業趨勢和統計數據以及成長預測(2026-2031 年)法國貨運代理服務:市場佔有率分析、行業趨勢和統計數據以及成長預測(2026-2031 年)貨運代理服務:市場佔有率分析、產業趨勢與統計、成長預測(2026-2031 年)德國貨運代理服務:市場佔有率分析、行業趨勢和統計數據以及成長預測(2026-2031 年)
 貨運代理服務市場:依服務類型、運輸方式、客戶規模、貨物類型、技術應用及最終用戶產業分類-2026-2032年全球市場預測美國整車貨運經紀市場:市場佔有率分析、產業趨勢與統計、成長預測(2026-2031 年)
 全球貨運仲介市場規模、佔有率、趨勢和成長分析報告(2026-2034)
 2026-2030年全球數位貨運經紀市場