


 |
市場調查報告書
商品編碼
2063302
貨運代理服務:市場佔有率分析、產業趨勢與統計、成長預測(2026-2031 年)Freight Brokerage Services - Market Share Analysis, Industry Trends & Statistics, Growth Forecasts (2026 - 2031) |
||||||

※ 本網頁內容可能與最新版本有所差異。詳細情況請與我們聯繫。
根據 Mordor Intelligence 預測,貨運代理服務市場規模將從 2025 年的 827.3 億美元成長到 2026 年的 889.6 億美元,到 2031 年將達到 1,166 億美元,2026 年至 2031 年的複合年成長率為 6.90%。
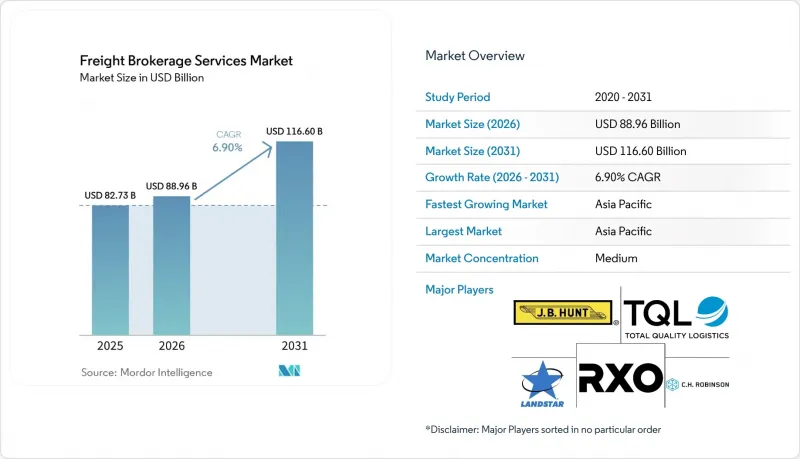
近岸外包正在縮短平均運輸距離,全通路零售正在將貨運批次細分,而仲介和全球第三方物流公司之間的大規模併購正在重新定義競爭格局。本報告按服務類型(整車運輸、其他)、設備/拖車類型(乾貨車、冷藏車、其他)、運輸距離(長途、區域內、近距離)、經營模式(傳統模式、資產持有模式、其他)、終端用戶行業(製造業/汽車業、其他)、客戶規模(大型企業、其他)和地區進行細分。市場預測以美元計價。
全球貨運代理服務市場趨勢及洞察
近岸外包和回岸外包正在將運輸量轉移到跨越國界的短途路線。
近岸外包和回流趨勢正在降低對長途洲際航線的依賴,並提升跨境短程通道的重要性。製造地向墨西哥和東歐等地區的轉移縮短了運輸距離,同時提高了運輸頻率和跨境貨物吞吐量。這給清關、單證和合規帶來了挑戰,使得仲介的角色至關重要。具備雙語能力、合規專業知識以及整合海關解決方案(例如符合CARM標準的平台)的仲介能夠獲得更高的利潤率。雙重認證的承運商網路以及注重韌性而非成本最小化的做法,進一步增強了仲介的競爭優勢,並推動了區域貿易通道的持續需求。
全通路零售的快速成長正在加速對中轉貨運仲介的需求。
全通路零售的成長正在重塑物流網路,其核心在於強調速度、柔軟性和庫存應對力。零售商承諾當日達或隔天達,這就要求門市和履約中心在緊迫的時限內頻繁補貨,從而提升了中程物流的重要性。貨運仲介在路線最佳化和貨物整合方面發揮關鍵作用,先進的路線規劃演算法能夠有效減少空駛距離和運輸成本。數位化平台和即時視覺化工具對於管理高頻次貨運至關重要,而需求與運輸能力的動態匹配則有助於在需求高峰期提升應對力。隨著庫存日益分散化,能夠實現高效中程營運的仲介服務預計將持續成長,並展現出日益重要的戰略意義。
貨櫃運費的快速波動給現貨交易的利潤率帶來了壓力。
貨櫃運費的劇烈波動給貨運仲介的利潤率帶來了巨大的不不確定性,尤其是在週期短的現貨市場。 40英尺貨櫃的運費在短短幾週內波動幅度高達5000美元,迫使仲介頻繁地重新計算貨運價格,這不僅破壞了價格的穩定性,也增加了他們的工作量。在利潤本就微薄的港口到物流中心(DC)短程運輸路線上,這種波動可能會使毛利率下降100個基點以上。此外,當合約價格偏離市場價格時,仲介面臨更大的交易對手風險,而避險和準確預測的選擇卻十分有限。因此,仲介擴大採用動態定價工具並縮短合約週期,但這些措施可能無法完全抵消持續波動的影響。
細分市場分析
受零售商轉向SKU級補貨和共享卡車運輸計劃的推動,零擔貨運(LTL)正以10.05%的複合年成長率成長,這使得拖車裝載率(空間利用率)高達92%,從而帶動了貨運經紀服務市場的發展。多點配送演算法已將仲介在整合路線上的毛利率提高至16%。同時,整車貨運(FTL)仍保持著67.15%的市場佔有率,但由於托運人運輸方式多樣化並需要更靈活的運輸能力選擇,其在貨運經紀服務市場的佔有率下降了2個百分點。
仲介透過將動態運輸方式規則整合到其運輸管理系統 (TMS) 中,來維持傳統的整車運輸 (FTL) 合約。這使得企業客戶無需重新競標即可在整車運輸和零擔運輸 (LTL) 之間切換訂單,從而提高客戶留存率並穩定收入。憑藉零擔運輸的結構性優勢、避免額外的小包裹費用、透過全通路提高配送速度以及透過近岸外包整合運輸路線等優勢,零擔運輸必將佔據不斷成長的大部分需求。
到2025年,乾貨車將佔貨運仲介服務市場的46.04%,但冷藏貨車正以11.15%的複合年成長率快速成長,這主要得益於藥品GDP法規和生鮮食品電商對全程溫度遙測的需求。仲介透過引入物聯網探頭,以5分鐘為間隔記錄溫度並存檔合規的數位化證明,從而減少索賠並鞏固其作為疫苗生產商首選托運人的地位。
由於利潤率高,供應商正將約7%的乾貨車改裝成保溫或混合冷氣配置,以追求高利潤的低溫運輸路線,同時兼顧資產風險。冷藏貨運代理服務市場預計將會擴張,而設備專業化正在增強競爭優勢,因為托運人優先考慮那些在密封完整性、監管文件和緊急繞行管理方面擁有專業知識的合作夥伴。
區域分析
亞太地區佔據44.13%的銷售佔有率,預計到2031年,該地區的貨運代理服務市場將以9.03%的複合年成長率成長。東協關稅協調已將邊境通關手續縮短至30分鐘,促進了泰國和越南中小托運人採用數位貨運代理應用程式。印度商品及服務稅(GST)電子運單(e-way bills)的自動化提高了透明度,並吸引了尋求合規中間環節合作夥伴的海外零售商。
在北美,近岸外包模式正在加速發展,美國和墨西哥之間陸路跨境零擔貨運量較去年同期成長18%。利用雙語客服中心和FAST認證承運商的仲介已將邊境等待時間縮短了42%,並因此獲得了汽車製造商頒發的「運輸方式轉變獎」。加拿大引進CARM(海關申報參考模型)後,仲介必須整合海關計算工具,預計僅2026年,合規相關服務的收入將增加1.2億美元。
歐洲正努力適應歐盟排放交易體系第四階段。提供鐵路和公路聯運的仲介,與僅使用公路運輸相比,可將碳排放強度降低42%,並在零售商的競標中獲得優先地位。對eIDAS認證的投資正在激增,早期採用者在需要可審計儲存歷史記錄的製藥行業托運人中獲得了更高的品牌價值。
儘管南美洲和中東/非洲地區的銷售額僅佔全球整體銷售額的不到10%,但作為新興市場,它們蘊藏著巨大的成長潛力。巴西BR-163公路的鋪設將確保大豆出口通道的暢通,而海灣合作理事會(GCC)的鐵路連接項目則有望為多模態仲介業務帶來機遇,助力企業從石油領域多元化發展至化工領域。
其他好處
- Excel格式的市場預測(ME)表
- 3個月的分析師支持
目錄
第1章:引言
- 研究假設和市場定義
- 調查範圍
第2章:調查方法
第3章執行摘要
第4章 市場狀況
- 市場概覽
- 市場促進因素
- 近岸外包和回岸外包正在將運輸量轉移到跨越國界的短途走廊。
- 全通路零售的快速發展正在推動對中間環節中介機構的需求不斷成長。
- 中小企業的自助服務入口網站正在擴大其服務範圍,涵蓋長尾客戶。
- 仲介和全球第三方物流公司之間的大規模合併將創建一個一站式運輸能力網路。
- 即時貨物保險API可產生高利潤的新型輔助收入。
- 與碳排放掛鉤的貨運衍生性商品正在吸引具有環境、社會和治理 (ESG) 意識的托運人使用仲介平台。
- 市場限制因素
- 貨櫃運費的快速波動給現貨利潤率帶來了壓力。
- 疫情後庫存減少將限制 2024 年至 2026 年間的出貨量。
- 數位巨頭對演算法交易能力的壟斷,正在將中型仲介排除在市場之外。
- 對數位身分和網路安全(eIDAS 2.0、NIST 800-63)的更嚴格監管導致遵循成本激增。
- 價值供應鏈分析
- 監理情勢
- 技術展望
- 波特五力模型
第5章 市場規模與成長預測
- 按服務
- 全軌道公路(FTL)
- 低於100%的運費(零擔運輸)
- 其他
- 設備/拖車類型
- 乾燒
- 冷藏車
- 平板/階梯式平板車
- 油輪(散裝液體和化學品)
- 其他
- 按運輸距離
- 長途(500英里或以上)
- 在區域內(100-500英里)
- 近距離(100英里以內)
- 按經營模式
- 傳統的
- 資產持有類型
- 基於代理的
- 數位的
- 按最終用戶行業分類
- 製造業/汽車
- 建築和基礎設施項目
- 石油、天然氣、採礦和化工
- 農業/食品/飲料
- 零售、快速消費品和批發分銷
- 藥物
- 電子商務與第三方物流履約
- 其他
- 按客戶規模
- 大型企業貨運商(年營業額超過1億美元)
- 中型貨運公司(年營業額1000萬美元至1億美元)
- 中小型貨運公司(年營業額低於1000萬美元)
- 按地區
- 北美洲
- 美國
- 加拿大
- 墨西哥
- 南美洲
- 巴西
- 秘魯
- 智利
- 阿根廷
- 其他南美國家
- 亞太地區
- 印度
- 中國
- 日本
- 澳洲
- 韓國
- 東南亞(新加坡、馬來西亞、泰國、印尼、越南、菲律賓)
- 其他亞太國家
- 歐洲
- 英國
- 德國
- 法國
- 西班牙
- 義大利
- 比荷盧經濟聯盟(比利時、荷蘭、盧森堡)
- 北歐國家(丹麥、芬蘭、冰島、挪威、瑞典)
- 其他歐洲國家
- 中東和非洲
- 阿拉伯聯合大公國
- 沙烏地阿拉伯
- 南非
- 奈及利亞
- 其他中東和非洲國家
- 北美洲
第6章 競爭情勢
- 市場集中度
- 策略趨勢
- 市佔率分析
- 公司簡介
- CH Robinson Worldwide Inc
- Total Quality Logistics LLC
- RXO Inc.
- Landstar System Inc.
- JB Hunt Transport Services Inc.
- Echo Global Logistics Inc.
- Schneider National Inc.
- Hub Group Inc.
- Mode Transportation LLC
- ArcBest Corporation
- Kuehne+Nagel
- Arrive Logistics LLC
- Worldwide Express LLC(WWEX Group)
- DSV A/S
- Sinotrans Limited
- NYK(Yusen Logistics Ltd)
- GEODIS
- Hellmann Worldwide Logistics
- Rohlig Logistics GmbH & Co. KG
- PLS Logistics Services Inc.
第7章 市場機會與未來展望
According to Mordor Intelligence, the freight brokerage services market size is expected to increase from USD 82.73 billion in 2025 to USD 88.96 billion in 2026 and reach USD 116.60 billion by 2031, growing at a CAGR of 6.90% over 2026-2031.
Nearshoring is shortening average haul lengths, omni-channel retail is fragmenting shipment lots, and mega-mergers between brokers and global 3PLs are redefining competitive boundaries. This report is Segmented by Service (Full-Truckload, and More), by Equipment/Trailer Type (Dry Van, Refrigerated Van, and More), by Haul Length (Long-Haul, Regional, Local), by Business Model (Traditional, Asset-Based, and More), by End-User Industry (Manufacturing & Auto, and More), by Customer Size (Large Enterprise, and More), and by Geography. The Market Forecasts are in Terms of Value (USD).
Global Freight Brokerage Services Market Trends and Insights
Nearshoring and Reshoring Shift Volumes Toward Cross-Border Short-Haul Corridors
Nearshoring and reshoring trends are reducing reliance on long-haul intercontinental routes and increasing the importance of cross-border short-haul corridors. Manufacturing shifts to regions like Mexico and Eastern Europe are shortening shipment distances while increasing shipment frequency and border-crossing volumes. This creates challenges in customs clearance, documentation, and compliance, elevating brokers' roles. Brokers with bilingual skills, compliance expertise, and integrated customs solutions, such as CARM-ready platforms, are better positioned to capture higher margins. Dual-qualified carrier networks and a focus on resilience over cost minimization further enhance brokers' competitive advantage, driving sustained demand in regional trade corridors .
Omni-Channel Retail Boom Intensifies Middle-Mile Brokerage Demand
The growth of omni-channel retail is reshaping logistics networks by emphasizing speed, flexibility, and inventory responsiveness. Retailers' commitments to same-day or next-day delivery require frequent replenishment of stores and fulfillment centers within tight timeframes, increasing the importance of middle-mile logistics. Freight brokers play a key role in optimizing routes and consolidating loads, aided by advanced routing algorithms that reduce empty miles and transportation costs. Digital platforms and real-time visibility tools are essential for managing high-frequency shipments, while dynamic demand-capacity matching enhances responsiveness during demand spikes. As inventory decentralization continues, brokerage services enabling efficient middle-mile operations are expected to see sustained growth and strategic importance .
Container-Rate Whiplash Compresses Spot-Margin Windows
Extreme volatility in container freight rates is causing significant margin uncertainty for freight brokers, particularly in short-cycle spot markets. Fluctuations of up to USD 5,000 in 40-foot container rates within weeks force brokers to frequently re-quote shipments, disrupting pricing consistency and increasing operational workload. In port-to-distribution center (DC) drayage lanes, where margins are already narrow, such changes can reduce gross margins by over 100 basis points. Brokers also face heightened counterparty risk when contracted rates diverge from market prices, with limited options for hedging or accurate forecasting. As a result, brokers are adopting dynamic pricing tools and shorter contract cycles, though these measures may not fully offset the impact of sustained volatility..
Other drivers and restraints analyzed in the detailed report include:
- SME Self-Service Portals Expand Long-Tail Customer Penetration
- Mega-Mergers Between Brokers and Global 3PLs Unlock One-Stop Capacity Networks
- Inventory Destocking Post-Pandemic Dampens Shipment Volumes 2024-2026
For complete list of drivers and restraints, kindly check the Table Of Contents.
Segment Analysis
Less-than-Truckload shipments are expanding at a 10.05% CAGR, lifting the freight brokerage services market as retailers shift to SKU-level replenishment and shared-truckload programs push trailer cube utilization to 92%. Multi-stop algorithms widen broker gross margin to 16% on consolidated routes, while Full-Truckload continues to anchor 67.15% market share but sees its freight brokerage services market share decline two percentage points as shippers diversify modes and demand flexible capacity options.
Brokers protect legacy FTL contracts by integrating dynamic mode-shifting rules in Transportation Management Systems that let enterprise clients flip orders between FTL and LTL without re-tendering, deepening account stickiness, and smoothing revenue. LTL's structural tailwinds, parcel surcharge avoidance, omni-channel velocity, and nearshoring-driven lane compression ensure it captures an outsized portion of incremental demand.
Dry Vans held 46.04% of the 2025 freight brokerage services market, but Refrigerated Van is compounding at an 11.15% CAGR as pharma GDP mandates and fresh-food e-commerce require lane-level temperature telemetry. Brokers embed IoT probes that record five-minute temperature intervals and archive digital proof of compliance, reducing claims and securing preferred-shipper status with vaccine producers.
Capitalizing on premium yields, providers are reallocating roughly 7% of dry-van inventory to insulated or hybrid-cooling retrofits, balancing asset risk while pursuing higher-margin cold-chain lanes. The freight brokerage services market for Reefer loads is slated to rise, and equipment specialization strengthens competitive moats because shippers prize partners who master seal integrity, regulatory paperwork, and contingency routing.
Geography Analysis
Asia-Pacific sustains 44.13% revenue share, with the freight brokerage services market size in the region and forecasts to rise with 9.03% CAGR by 2031. ASEAN customs harmonization trims border clearance to 30 minutes, encouraging small Thai and Vietnamese shippers to adopt digital brokerage apps. Indian GST e-way bill automation injects transparency, attracting foreign retailers who demand compliant middle-mile partners.
North America re-orients around nearshoring; US-Mexico surface lanes see cross-border LTL loads jump 18% YoY. Brokers employing bilingual call centers and certified FAST carriers reduce border dwell by 42%, winning Mode Shift awards from automotive OEMs. Canada's CARM rollout compels brokers to embed tariff calculators, lifting compliance service revenue by USD 120 million in 2026 alone.
Europe grapples with ETS Phase 4. Brokers bundling intermodal rail with truck legs cut carbon intensity 42% versus truck-only, earning premium placement on retailer bid boards. eIDAS-driven authentication investment spikes, but early movers enjoy brand lift among pharma shippers who require auditable chain-of-custody logs.
South America and MEA, although sub-10% of global turnover, present frontier upside. Brazilian BR-163 highway paving unlocks soy export corridors, while GCC rail link projects promise multi-modal brokerage opportunities tied to oil-to-chemicals diversification.
- C.H. Robinson Worldwide Inc
- Total Quality Logistics LLC
- RXO Inc.
- Landstar System Inc.
- J.B. Hunt Transport Services Inc.
- Echo Global Logistics Inc.
- Schneider National Inc.
- Hub Group Inc.
- Mode Transportation LLC
- ArcBest Corporation
- Kuehne+Nagel
- Arrive Logistics LLC
- Worldwide Express LLC (WWEX Group)
- DSV A/S
- Sinotrans Limited
- NYK (Yusen Logistics Ltd)
- GEODIS
- Hellmann Worldwide Logistics
- Rohlig Logistics GmbH & Co. KG
- PLS Logistics Services Inc.
Additional Benefits:
- The market estimate (ME) sheet in Excel format
- 3 months of analyst support
TABLE OF CONTENTS
1 Introduction
- 1.1 Study Assumptions and Market Definition
- 1.2 Scope of the Study
2 Research Methodology
3 Executive Summary
4 Market Landscape
- 4.1 Market Overview
- 4.2 Market Drivers
- 4.2.1 Nearshoring and Reshoring Shift Volumes Toward Cross-Border Short-Haul Corridors
- 4.2.2 Omni-Channel Retail Boom Intensifies Middle-Mile Brokerage Demand
- 4.2.3 SME Self-Service Portals Expand Long-Tail Customer Penetration
- 4.2.4 Mega-Mergers Between Brokers and Global 3PLs Unlock One-Stop Capacity Networks
- 4.2.5 Real-Time Cargo-Insurance APIs Create New high-Margin Ancillary Revenue
- 4.2.6 Carbon-Linked Freight Derivatives Attract ESG-Focused Shippers to Broker Platforms
- 4.3 Market Restraints
- 4.3.1 Container-Rate Whiplash Compresses Spot-Margin Windows
- 4.3.2 Inventory Destocking Post-Pandemic Dampens Shipment Volumes 2024-2026
- 4.3.3 Algorithmic Capacity Hoarding by Digital Giants Sidelines Mid-Tier Brokers
- 4.3.4 Stricter Digital-identity & Cybersecurity Mandates (eIDAS 2.0, NIST 800-63) Spike Compliance Spend
- 4.4 Value / Supply-Chain Analysis
- 4.5 Regulatory Landscape
- 4.6 Technological Outlook
- 4.7 Porter's Five Forces
- 4.7.1 Threat of New Entrants
- 4.7.2 Bargaining Power of Suppliers
- 4.7.3 Bargaining Power of Buyers
- 4.7.4 Threat of Substitutes
- 4.7.5 Industry Rivalry
5 Market Size and Growth Forecasts (Value)
- 5.1 By Service
- 5.1.1 Full-Truckload (FTL)
- 5.1.2 Less-than-Truckload (LTL)
- 5.1.3 Others
- 5.2 By Equipment / Trailer Type
- 5.2.1 Dry Van
- 5.2.2 Refrigerated Van
- 5.2.3 Flatbed / Step-Deck
- 5.2.4 Tanker (Bulk Liquid and Chemical)
- 5.2.5 Others
- 5.3 By Haul Length
- 5.3.1 Long-Haul (More than 500 miles)
- 5.3.2 Regional (100-500 miles)
- 5.3.3 Local (Less than 100 miles)
- 5.4 By Business Model
- 5.4.1 Traditional Freight Brokerage
- 5.4.2 Asset-Based Freight Brokerage
- 5.4.3 Agent Model Freight Brokerage
- 5.4.4 Digital Freight Brokerage
- 5.5 By End-User Industry
- 5.5.1 Manufacturing and Automotive
- 5.5.2 Construction and Infrastructure Projects
- 5.5.3 Oil, Gas, Mining and Chemicals
- 5.5.4 Agriculture and Food / Beverage
- 5.5.5 Retail, FMCG and Wholesale Distribution
- 5.5.6 Healthcare and Pharmaceuticals
- 5.5.7 E-commerce and 3PL Fulfilment
- 5.5.8 Other End-User Industry
- 5.6 By Customer Size
- 5.6.1 Large Enterprise Shippers (More than USD 100 M)
- 5.6.2 Mid-Market Shippers (USD 10-100 M)
- 5.6.3 Small Businesses (Less than USD 10 M)
- 5.7 By Geography
- 5.7.1 North America
- 5.7.1.1 United States
- 5.7.1.2 Canada
- 5.7.1.3 Mexico
- 5.7.2 South America
- 5.7.2.1 Brazil
- 5.7.2.2 Peru
- 5.7.2.3 Chile
- 5.7.2.4 Argentina
- 5.7.2.5 Rest of South America
- 5.7.3 Asia-Pacific
- 5.7.3.1 India
- 5.7.3.2 China
- 5.7.3.3 Japan
- 5.7.3.4 Australia
- 5.7.3.5 South Korea
- 5.7.3.6 South East Asia (Singapore, Malaysia, Thailand, Indonesia, Vietnam, and Philippines)
- 5.7.3.7 Rest of Asia-Pacific
- 5.7.4 Europe
- 5.7.4.1 United Kingdom
- 5.7.4.2 Germany
- 5.7.4.3 France
- 5.7.4.4 Spain
- 5.7.4.5 Italy
- 5.7.4.6 BENELUX (Belgium, Netherlands, and Luxembourg)
- 5.7.4.7 NORDICS (Denmark, Finland, Iceland, Norway, and Sweden)
- 5.7.4.8 Rest of Europe
- 5.7.5 Middle East and Africa
- 5.7.5.1 United Arab of Emirates
- 5.7.5.2 Saudi Arabia
- 5.7.5.3 South Africa
- 5.7.5.4 Nigeria
- 5.7.5.5 Rest of Middle East And Africa
- 5.7.1 North America
6 Competitive Landscape
- 6.1 Market Concentration
- 6.2 Strategic Moves
- 6.3 Market Share Analysis
- 6.4 Company Profiles {(includes Global Level Overview, Market Level overview, Core Segments, Financials as available, Strategic Information, Market Rank/Share for key companies, Products and Services, and Recent Developments)}
- 6.4.1 C.H. Robinson Worldwide Inc
- 6.4.2 Total Quality Logistics LLC
- 6.4.3 RXO Inc.
- 6.4.4 Landstar System Inc.
- 6.4.5 J.B. Hunt Transport Services Inc.
- 6.4.6 Echo Global Logistics Inc.
- 6.4.7 Schneider National Inc.
- 6.4.8 Hub Group Inc.
- 6.4.9 Mode Transportation LLC
- 6.4.10 ArcBest Corporation
- 6.4.11 Kuehne+Nagel
- 6.4.12 Arrive Logistics LLC
- 6.4.13 Worldwide Express LLC (WWEX Group)
- 6.4.14 DSV A/S
- 6.4.15 Sinotrans Limited
- 6.4.16 NYK (Yusen Logistics Ltd)
- 6.4.17 GEODIS
- 6.4.18 Hellmann Worldwide Logistics
- 6.4.19 Rohlig Logistics GmbH & Co. KG
- 6.4.20 PLS Logistics Services Inc.
7 Market Opportunities and Future Outlook
- 7.1 White-Space and Unmet-Need Assessment

 金融資產中介服務市場規模、佔有率和成長分析:按資產類型、服務類型、客戶類型、服務管道、經營模式和地區分類-產業預測,2026-2033年
 美國貨運代理市場:市場佔有率分析、產業趨勢與統計、成長預測(2026-2031)歐洲貨運代理服務:市場佔有率分析、行業趨勢和統計數據以及成長預測(2026-2031 年)法國貨運代理服務:市場佔有率分析、行業趨勢和統計數據以及成長預測(2026-2031 年)東協貨運代理服務:市場佔有率分析、產業趨勢與統計及成長預測(2026-2031)德國貨運代理服務:市場佔有率分析、行業趨勢和統計數據以及成長預測(2026-2031 年)
 貨運代理服務市場:依服務類型、運輸方式、客戶規模、貨物類型、技術應用及最終用戶產業分類-2026-2032年全球市場預測美國整車貨運經紀市場:市場佔有率分析、產業趨勢與統計、成長預測(2026-2031 年)
 全球貨運仲介市場規模、佔有率、趨勢和成長分析報告(2026-2034)
 2026-2030年全球數位貨運經紀市場