


 |
市場調查報告書
商品編碼
2063303
北美貨運代理服務:市場佔有率分析、行業趨勢和統計數據以及成長預測(2026-2031 年)North America Freight Brokerage Services - Market Share Analysis, Industry Trends & Statistics, Growth Forecasts (2026 - 2031) |
||||||

※ 本網頁內容可能與最新版本有所差異。詳細情況請與我們聯繫。
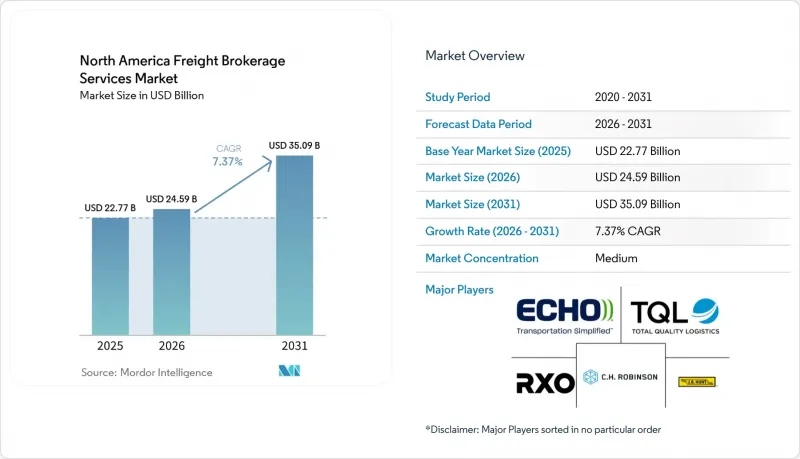
根據 Mordor Intelligence 預測,北美貨運代理服務市場規模將從 2025 年的 227.7 億美元和 2026 年的 245.9 億美元成長到 2031 年的 350.9 億美元,2026 年至 2031 年的複合年成長率為 7.37%。
本報告按服務類型(整車運輸、其他)、車輛/拖車類型(廂型車、其他)、運輸距離(長途、其他)、經營模式(傳統模式、其他)、最終用戶行業(製造業、其他)、客戶規模(大型企業、其他)和國家/地區(美國、其他)進行細分。市場預測以美元計價。
北美貨運代理服務市場的趨勢與洞察
人工智慧驅動的動態定價,逐條路線進行,可以提高仲介的成交率。
目前,機器學習利用即時運輸能力數據和競爭對手報價來為每條運輸路線定價。到2025年,CH Robinson的人工智慧代理商將處理超過300萬個運輸任務,將報價到接受的周期縮短至幾分鐘,並提高波動性較大的運輸路線的盈利能力。先進的模型會分析過往競標結果、天氣和停留時間等指標,以預測服務風險,並增強托運人在競標活動中的信心。擁有龐巨量資料日誌的大型仲介業者可以比小規模競爭對手更快地最佳化演算法,並將市場佔有率轉移到那些將節省的成本再投資於承運商忠誠度計畫的成熟公司手中。這種動態定價的優勢在拉雷多和諾加萊斯的跨境路線上最為明顯,因為即時等待時間會導致即期價格全天波動。小規模仲介則透過專注於平板車和危險品運輸等利基市場來應對,這些市場的演算法貨運歷史數據有限。
美墨加協定下跨境電子商務貨運量的成長刺激了快速清關服務的需求。
美墨加協定(USMCA)的最低限額標準簡化了小包裹的清關流程,加快了從墨西哥倉庫到美國家庭的直接配送速度。仲介透過整合小包裹承運商和零擔貨運(LTL)共乘服務商進行集中清關,將運輸時間縮短了數天,之後包裹會被運往美國國內的樞紐中心。雙語營運團隊仍然負責管理附加在混合托盤上的原產地證書,從而保護托運人免受審計。獲得CTPAT和FAST專案認證的報關行具有競爭優勢,因為他們可以優先處理北向車輛的清關。隨著電子產品和服飾經銷商承諾72小時內跨境送達,此領域的成長潛力進一步擴大。
大型貨主的直接數位承運商平台取代了傳統的仲介。
財富500強零售商正在部署API樞紐,以便從簽約承運商處獲取即時運費,從而在可預測的運輸路線中剔除仲介業者。 IntelliTrans目前已將工廠出貨與2800家承運商即時連接起來,將仲介的使用限制在跨境和超大件貨物上。作為回應,仲介也紛紛提供異常管理、擁塞預防措施以及能夠保證運輸能力的包裝——這些都是僅靠軟體無法實現的功能。在承運商密度最高的東南部主要運輸路線上,利潤率正在急劇下降。如果小規模仲介無法透過標準化API提供貨運數據,則可能面臨排除在企業路線指南之外的風險。
細分市場分析
受8,500億美元電商退貨的推動,小包裹(零擔運輸)收入正以9.66%的複合年成長率成長。這些退貨已擴展為零擔和小包裹混合運輸形式。貨運整合商正利用芝加哥和達拉斯附近的集散中心(小包裹集中於此),降低每次退貨的成本。預計到2025年,整車運輸(FTL)仍將佔據主導地位,佔北美貨運仲介服務市場的71.05%,但承運商自動化應用程式正在蠶食穩定的貨運量,給仲介的利潤率帶來壓力。
數位化仲介將兩種運輸方式整合到一個統一的控制面板中,使經銷商即使在最後一刻也能在托盤運輸和小包裹運輸之間切換,而無需重新競標。由於服裝和電子產品的退貨需要快速處理,因此服務差異化主要集中在索賠處理方面。將退款觸發機制和貨運調度與POS(銷售點)系統整合的仲介正在加深零售商的忠誠度,並提高北美貨運代理市場的轉換成本。
由於藥品和食材自煮包配送商要求從取貨到送貨上門全程溫度控制在攝氏2度以下,冷藏運輸能力正以9.97%的複合年成長率成長。預計到2025年,乾貨車仍將維持在北美貨運仲介服務市場的領先地位,佔43.78%的市場佔有率,但由於西海岸港口底盤短缺,現貨運運費仍波動較大。
在自動駕駛測試作業中,冷藏車通常在夜間交通流量較低時運行,這樣可以提高資產利用率。仲介透過部署遠端資訊處理中心來檢測溫度的突然升高並發出主動警報,從而減少了延誤、遺失和損壞 (OS&D) 索賠。油罐車和平板車細分市場保持著穩定的收入,但危險品和超限貨物的許可證申請流程複雜,這使得這些細分仲介免受北美整體貨運代理服務市場演算法同質化的影響。
其他好處
- Excel格式的市場預測(ME)表
- 3個月的分析師支持
目錄
第1章:引言
- 研究假設和市場定義
- 調查範圍
第2章:調查方法
第3章執行摘要
第4章 市場狀況
- 市場概覽
- 市場促進因素
- 人工智慧驅動的逐車道動態定價提高了仲介的成交率。
- 美墨加協定擴大了跨境電子商務運輸,從而提高了對更快清關的需求。
- 企業範圍 3 法規正在推動仲介主導的碳最佳化路由的採用。
- 透過仲介網路儘早實現自動駕駛卡車運輸能力池的商業化
- 零擔貨運和小包裹的整合模式正在擴大仲介在退貨流量領域的市場佔有率。
- 利用 ELD/遠端資訊處理技術進行即時合規性分析,可實現無縫的服務等級協定 (SLA)。
- 市場限制因素
- 大型貨運公司推出的直接數位承運平台取消了傳統仲介作為中間人。
- 州級聯合僱用和問責法規(例如 AB5)增加了法律風險。
- 貨物清單資料的寡占限制了中小仲介取得分析資料。
- 與網路安全和資料隱私相關的合規成本不斷增加(CISA/NIST框架)
- 價值供應鏈分析
- 監理情勢
- 技術展望
- 波特五力分析
第5章 市場規模與成長預測
- 按服務
- 全軌道公路(FTL)
- 低於100%的運費(零擔運輸)
- 其他
- 車輛/拖車類型
- 乾燒
- 冷藏車
- 平板/階梯式平板車
- 油輪(散裝液體和化學品)
- 其他
- 按運輸距離
- 長途(500英里或以上)
- 該區域內(100-500英里)
- 近距離(100英里以內)
- 按經營模式
- 傳統的
- 資產持有類型
- 基於代理的
- 數位的
- 按最終用戶行業分類
- 製造業/汽車
- 基礎建設項目
- 石油、天然氣、採礦和化工
- 農業/食品/飲料
- 零售、快速消費品和批發分銷
- 藥物
- 電子商務與第三方物流履約
- 其他
- 按客戶規模
- 大型企業(年營業額超過1億美元)
- 中型企業(年營業額1000萬美元至1億美元)
- 中小企業(營業額低於1000萬美元)
- 按地區
- 美國
- 加拿大
- 墨西哥
第6章 競爭情勢
- 市場集中度
- 策略性舉措和併購
- 市佔率分析
- 公司簡介
- CH Robinson Worldwide
- Total Quality Logistics(TQL)
- Echo Global Logistics, Inc.
- RXO
- JB Hunt Transport Services, Inc.
- Hub Group, Inc.
- Landstar System
- Schneider Logistics
- WWEX Group
- Arrive Logistics
- Mode Transportation
- BlueGrace Logistics
- Nolan Transportation Group
- Sunset Transportation
- Werner Enterprises
- Trinity Logistics
- Ascent Global Logistics
- Integrity Express Logistics
- Redwood Logistics
- PLS Logistics Services
第7章 市場機會與未來展望
According to Mordor Intelligence, the north america freight brokerage services market size is projected to expand from USD 22.77 billion in 2025 and USD 24.59 billion in 2026 to USD 35.09 billion by 2031, registering a 7.37% CAGR between 2026 and 2031.
This report is Segmented by Service (Full-Truckload, and More), by Equipment/Trailer Type (Dry Van, and More), by Haul Length (Long-Haul, and More), by Business Model (Traditional, and More), by End-User Industry (Manufacturing, and More), by Customer Size (Large Enterprise, and More), and by Country (United States, and More). The Market Forecasts are Provided in Terms of Value (USD).
North America Freight Brokerage Services Market Trends and Insights
AI-Driven Lane-Level Dynamic Pricing Accelerates Broker Win-Rates
Machine learning now prices individual lanes using live capacity signals and competitive quotes. C.H. Robinson's AI agents processed over 3 million shipment tasks in 2025, trimming quote-to-accept cycles to minutes and widening margin capture on volatile corridors. Sophisticated models digest historical tender outcomes, weather, and dwell-time metrics to forecast service risk, raising shipper confidence during bid events. Large intermediaries with deep data logs sharpen algorithms faster than smaller rivals, tilting share toward incumbents that reinvest savings into carrier loyalty programs. The dynamic pricing edge is most pronounced on Laredo and Nogales cross-border lanes, where real-time wait times swing spot rates all day. Smaller brokers counter by niching into flatbed or hazmat niches where algorithmic rate history is sparse.
USMCA-Enabled Cross-Border E-Commerce Shipments Spur Expedited Brokerage Demand
De minimis thresholds under USMCA simplify small-parcel customs, unleashing direct-to-consumer flows from Mexican facilities into US households. Brokers blend parcel carriers with LTL consolidators to clear customs in bulk, then inject parcels into domestic hubs, shaving days off transit. Bilingual operations teams manage certificates of origin that still accompany mixed-case pallets, protecting shippers from audits. Competitive edges arise for brokers certified under CTPAT and FAST programs that fast-track northbound vehicles. Growth potential is magnified by electronics and apparel sellers that now promise seventy-two-hour cross-border delivery windows.
Large Shippers' Direct Digital Carrier Platforms Disintermediate Traditional Brokers
Fortune 500 retailers deploy API hubs that pull live rates from contract carriers, bypassing intermediaries for predictable lanes. IntelliTrans now connects mill shippers with 2,800 carriers in real time, reserving broker use only for cross-border or oversized freight. Brokers respond by packaging exception management, detention shields, and guaranteed capacity bundles that software alone cannot match. Margin loss is acute on head-haul lanes in the Southeast, where carrier density is highest. Smaller brokers risk being locked out of enterprise routing guides if they cannot feed rates via standardized APIs.
Other drivers and restraints analyzed in the detailed report include:
- Corporate Scope-3 Mandates Fuel Broker-Led Carbon-Optimized Routing
- Early Commercialization of Autonomous-Truck Capacity Pools via Broker Networks
- State-Level Co-Employment & Liability Statutes Inflate Legal Exposure
For complete list of drivers and restraints, kindly check the Table Of Contents.
Segment Analysis
Less-than-truckload revenue is advancing at a 9.66% CAGR, lifted by USD 850 billion in e-commerce returns that now span LTL and parcel blends. Consolidators leverage pool points near Chicago and Dallas, where high parcel density lowers cost per return. Full truckload still anchors 71.05% of the North America freight brokerage services market share in 2025, yet automated carrier apps are eroding routine lane volumes, squeezing brokerage margins.
Digital brokers embed both modes in one dashboard, enabling merchants to toggle between pallet and parcel at late cut-off without re-tendering. Service differentiation pivots on claims handling, as apparel and electronics returns demand speedy refurbishment. Brokers that integrate point-of-sale refund triggers with freight scheduling deepen retailer loyalty and raise switching costs within the North America freight brokerage services market.
Refrigerated capacity is climbing at a 9.97% CAGR as pharma and meal-kit shippers seek sub-two-degree compliance from pickup to doorstep. Dry van leads with 43.78% of the North America freight brokerage services market size in 2025, yet spot-rate volatility remains high because of chassis shortages at West Coast ports.
Autonomous trials favor reefers that run overnight when traffic is low, boosting asset utilization. Brokers deploy telematics hubs that capture temperature spikes and push proactive alerts, reducing OS&D claims. Tanker and flatbed niches hold stable revenue but add complexity through hazmat and over-dimensional permits, insulating niche brokers from algorithmic commoditization across the North America freight brokerage services market.
List of Companies Covered in this Report:
- C.H. Robinson Worldwide
- Total Quality Logistics (TQL)
- Echo Global Logistics, Inc.
- RXO
- J.B. Hunt Transport Services, Inc.
- Hub Group, Inc.
- Landstar System
- Schneider Logistics
- WWEX Group
- Arrive Logistics
- Mode Transportation
- BlueGrace Logistics
- Nolan Transportation Group
- Sunset Transportation
- Werner Enterprises
- Trinity Logistics
- Ascent Global Logistics
- Integrity Express Logistics
- Redwood Logistics
- PLS Logistics Services
Additional Benefits:
- The market estimate (ME) sheet in Excel format
- 3 months of analyst support
TABLE OF CONTENTS
1 Introduction
- 1.1 Study Assumptions and Market Definition
- 1.2 Scope of the Study
2 Research Methodology
3 Executive Summary
4 Market Landscape
- 4.1 Market Overview
- 4.2 Market Drivers
- 4.2.1 AI-Driven Lane-Level Dynamic Pricing Accelerates Broker Win-Rates
- 4.2.2 USMCA -Enabled Cross-Border E-Commerce Shipments Spur Expedited Brokerage Demand
- 4.2.3 Corporate Scope-3 Mandates Fuel Adoption of Broker-Led Carbon-Optimized Routing
- 4.2.4 Early Commercialization of Autonomous-Truck Capacity Pools via Broker Networks
- 4.2.5 Integrated LTL-Parcel Consolidation Models Expand Broker Share of Returns Logistics
- 4.2.6 Real-Time Compliance Analytics from ELD/Telematics Unlock Detention-Free SLAs
- 4.3 Market Restraints
- 4.3.1 Large Shippers' Direct Digital Carrier Platforms Disintermediate Traditional Brokers
- 4.3.2 State-Level Co-Employment and Liability Statutes (e.g., AB5) Inflate Legal Exposure
- 4.3.3 Load-Board Data Oligopoly Limits Analytics Access for Small and Mid-Sized Brokers
- 4.3.4 Rising Cybersecurity and Data-Privacy Compliance Costs (CISA/NIST Frameworks)
- 4.4 Value / Supply-Chain Analysis
- 4.5 Regulatory Landscape
- 4.6 Technological Outlook
- 4.7 Porter's Five Forces Analysis
- 4.7.1 Threat of New Entrants
- 4.7.2 Bargaining Power of Suppliers (Carriers)
- 4.7.3 Bargaining Power of Buyers (Shippers)
- 4.7.4 Threat of Substitutes
- 4.7.5 Competitive Rivalry
5 Market Size and Growth Forecasts
- 5.1 By Service
- 5.1.1 Full-Truckload (FTL)
- 5.1.2 Less-than-Truckload (LTL)
- 5.1.3 Others
- 5.2 By Equipment / Trailer Type
- 5.2.1 Dry Van
- 5.2.2 Refrigerated Van
- 5.2.3 Flatbed / Step-Deck
- 5.2.4 Tanker (Bulk Liquid and Chemical)
- 5.2.5 Others
- 5.3 By Haul Length
- 5.3.1 Long-Haul (More than 500 miles)
- 5.3.2 Regional (100-500 miles)
- 5.3.3 Local (Less than 100 miles)
- 5.4 By Business Model
- 5.4.1 Traditional Freight Brokerage
- 5.4.2 Asset-Based Freight Brokerage
- 5.4.3 Agent Model Freight Brokerage
- 5.4.4 Digital Freight Brokerage
- 5.5 By End-User Industry
- 5.5.1 Manufacturing and Automotive
- 5.5.2 Construction and Infrastructure Projects
- 5.5.3 Oil, Gas, Mining and Chemicals
- 5.5.4 Agriculture and Food / Beverage
- 5.5.5 Retail, FMCG and Wholesale Distribution
- 5.5.6 Healthcare and Pharmaceuticals
- 5.5.7 E-commerce and 3PL Fulfilment
- 5.5.8 Other End-User Industry
- 5.6 By Customer Size
- 5.6.1 Large Enterprise Shippers (More than USD 100 M)
- 5.6.2 Mid-Market Shippers (USD 10-100 M)
- 5.6.3 Small Businesses (Less than USD 10 M)
- 5.7 By Geography
- 5.7.1 United States
- 5.7.2 Canada
- 5.7.3 Mexico
6 Competitive Landscape
- 6.1 Market Concentration
- 6.2 Strategic Moves and M&A
- 6.3 Market Share Analysis
- 6.4 Company Profiles (includes Global level Overview, Market level overview, Core Segments, Financials as available, Strategic Information, Market Rank/Share for key companies, Products & Services, and Recent Developments)
- 6.4.1 C.H. Robinson Worldwide
- 6.4.2 Total Quality Logistics (TQL)
- 6.4.3 Echo Global Logistics, Inc.
- 6.4.4 RXO
- 6.4.5 J.B. Hunt Transport Services, Inc.
- 6.4.6 Hub Group, Inc.
- 6.4.7 Landstar System
- 6.4.8 Schneider Logistics
- 6.4.9 WWEX Group
- 6.4.10 Arrive Logistics
- 6.4.11 Mode Transportation
- 6.4.12 BlueGrace Logistics
- 6.4.13 Nolan Transportation Group
- 6.4.14 Sunset Transportation
- 6.4.15 Werner Enterprises
- 6.4.16 Trinity Logistics
- 6.4.17 Ascent Global Logistics
- 6.4.18 Integrity Express Logistics
- 6.4.19 Redwood Logistics
- 6.4.20 PLS Logistics Services
7 Market Opportunities and Future Outlook
- 7.1 White-space and Unmet-need Assessment

 金融資產中介服務市場規模、佔有率和成長分析:按資產類型、服務類型、客戶類型、服務管道、經營模式和地區分類-產業預測,2026-2033年
 美國貨運代理市場:市場佔有率分析、產業趨勢與統計、成長預測(2026-2031)歐洲貨運代理服務:市場佔有率分析、行業趨勢和統計數據以及成長預測(2026-2031 年)法國貨運代理服務:市場佔有率分析、行業趨勢和統計數據以及成長預測(2026-2031 年)貨運代理服務:市場佔有率分析、產業趨勢與統計、成長預測(2026-2031 年)東協貨運代理服務:市場佔有率分析、產業趨勢與統計及成長預測(2026-2031)德國貨運代理服務:市場佔有率分析、行業趨勢和統計數據以及成長預測(2026-2031 年)
 貨運代理服務市場:依服務類型、運輸方式、客戶規模、貨物類型、技術應用及最終用戶產業分類-2026-2032年全球市場預測美國整車貨運經紀市場:市場佔有率分析、產業趨勢與統計、成長預測(2026-2031 年)
 全球貨運仲介市場規模、佔有率、趨勢和成長分析報告(2026-2034)