


 |
市場調查報告書
商品編碼
2123122
新加坡廢棄物管理:市場佔有率分析、產業趨勢與統計及成長預測(2026-2031)Singapore Waste Management - Market Share Analysis, Industry Trends & Statistics, Growth Forecasts (2026 - 2031) |
||||||

※ 本網頁內容可能與最新版本有所差異。詳細情況請與我們聯繫。
根據 Mordor Intelligence 預測,新加坡的廢棄物管理市場規模將從 2025 年的 13.4 億美元成長到 2026 年的 14 億美元,然後在 2031 年達到 17.3 億美元,2026 年至 2031 年的複合年成長率為 4.35%。
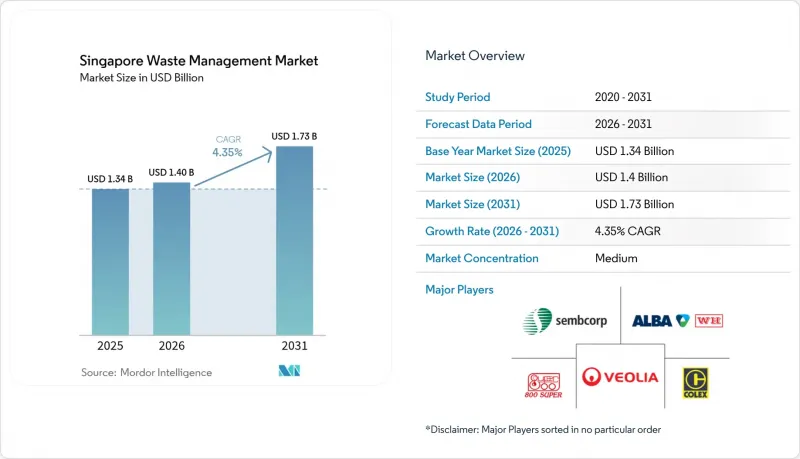
本報告按來源(住宅、商業、工業等)、服務類型(收集、運輸、分類等)、廢棄物類型(生活廢棄物、工業危險廢棄物、電子廢棄物、塑膠等)和合約模式(私人、公共)進行分類。市場預測以美元計價。
新加坡廢棄物管理市場趨勢及洞察
零浪費總體規劃與強制循環經濟
「零廢棄物總體規劃」要求在2030年實現全國70%的回收率和30%的廢棄物掩埋量,這將重塑新加坡廢棄物管理市場的現金流結構。電子廢棄物、食物廢棄物和包裝垃圾這三大優先領域佔所有廢棄物的40%以上,而監管合規正在推動對垃圾分類、堆肥和先進回收設備的需求。 《廢棄物管理條例》(RSA)規定,自2024年起,大型設施必須將食物廢棄物分類,引導企業採用現場厭氧消化器和生物製漿機。新建設施必須預留空間安裝此類設備,從而確保技術供應商的專案可行性。強制性月度報告和逐步提高的罰款等執法措施也提高了收入的可預測性。提供綜合廢棄物發電(WTE)和水回收服務的供應商,例如「Tuas Nexus」項目,在政策制定方面佔據有利地位。
掩埋容量有限,導致人們對焚燒和回收的需求增加。
由於實馬高掩埋可能在2035年達到設計極限,新加坡這個島國要嘛需要更換廢棄物場,要嘛需要減少廢棄物量。目前,新加坡有四座廢棄物焚化發電廠,每年處理380萬噸垃圾,為電網供電2%。同時,2021年投入運作的TuasOne裝置每天處理3,600噸垃圾,向電網輸送120兆瓦電力。計劃在Tuas Nexus建設的綜合廢棄物管理設施(IWMF)日處理能力將達到5800噸,預計將成為世界上最大的單體廢棄物處理設施。隨著垃圾焚燒量的增加,寶貴的土地將被釋放出來,穩定的原料供應前景也促使私部門願意簽訂長期的建設-營運-移轉(BOT)合約。
新設施用地短缺
土地利用競爭推高了機會成本,只有極少數工業用地允許散發異味或潛在危險的活動。多層和地下設計雖然可以減少用地面積,但會增加資本支出 (Capex) 和營運維護 (O&M) 的複雜性。營運商被迫在同一場地設計更高的處理能力,從而導致更高的技術風險和保險費。回收中心需要空間來存放包裝好的廢棄物,但靠近收集區的經濟適用空間稀缺,限制了新進入者的數量。
細分市場分析
到2025年,住宅廢棄物將佔新加坡廢棄物管理市場39.12%的主導地位。這主要是由於住宅發展局(HDB)組屋區和公寓每天持續產生大量廢棄物。商業廢棄物成長最快,年複合成長率達6.31%,這主要得益於《垃圾分類法》(RSA)強制執行的廚餘廢棄物分類、電子產品回收亭的設立以及基本負載租賃要求中關於購物中心廢棄物減量計畫的規定。雖然住宅垃圾為公共垃圾收集路線提供了基礎服務,但私人垃圾收集公司目前正將業務重心轉向酒店和商業園區,提供「按需付費」的定價模式,其中包括堆肥機和即時垃圾桶液位感測器。
商業領域的成長也反映了服務業積極多元化的發展趨勢。連鎖餐廳開始採用由Westcom Bio-Chem等本地新創公司提供的每日處理量2噸的厭氧消化器,從源頭減少垃圾產生量。辦公大樓則採用配備藍牙功能的壓縮機來收集數據,並將其反映在ESG(環境、社會和治理)儀錶板中。這些創新超越了傳統的路邊垃圾收集模式,使企業能夠獲得高利潤的契約,從而鞏固了新加坡廢棄物管理市場的未來價值。
2025年,收集、運輸和分類將佔總收入的47.15%,構成新加坡廢棄物管理市場物流的支柱。卡車將在市內短途行駛至廢棄物,並藉助遠端資訊處理技術減少閒置時間。同時,回收和資源再生產業預計到2031年將維持6.42%的複合年成長率。例如,REMEX公司的爐底灰處理廠可從焚燒灰中回收90%的鐵基金屬,進而將原本會被丟棄的廢棄物轉化為經濟效益。
技術進步正在提升回收企業的獲利能力。殼牌公司位於普洛布科姆的新型熱解油精煉廠,每年可將5萬噸難以回收的塑膠轉化為裂解原料,充分展現了資源回收如何創造增值。這些發展正將新加坡打造成為高價值系統材料的區域中心,並將新加坡龐大的廢棄物管理市場融入石化價值鏈。
其他好處:
- Excel格式的市場預測(ME)表
- 3個月的分析師支持
目錄
第1章:引言
- 研究假設和市場定義
- 調查範圍
第2章:調查方法
第3章執行摘要
第4章 市場狀況
- 市場概覽
- 市場促進因素
- 零廢棄總體規劃及循環經濟需求
- 強制性生產者延伸責任制(EPR)
- 掩埋容量有限,推動了焚燒和回收的需求。
- NEA的津貼正在加速私部門回收能力的擴張。
- 引入氣動廢棄物輸送系統(PWCS)的勢頭
- 大士Nexus的廢棄物製氫先導計畫
- 市場限制因素
- 對先進加工基礎設施的大量資本投資
- 新設施建設用地短缺
- 營運成本上升(人事費用、燃料成本、碳排放稅)
- 小規模國內市場再生商品價格波動
- 價值供應鏈分析
- 監理情勢
- 技術展望
- 產業吸引力—五力分析
- 新進入者的威脅
- 供應商的議價能力
- 買方的議價能力
- 替代品的威脅
- 競爭公司之間的競爭
第5章 市場規模與成長預測
- 來源
- 住宅
- 商業設施(零售、辦公室等)
- 產業
- 醫療保健(健康和藥品)
- 建設與拆除
- 其他(組織、農業等)
- 按服務類型
- 收集、運輸、分類和分離
- 處置/處理
- 掩埋處置
- 回收和資源回收
- 焚燒和垃圾焚化發電
- 其他(化學處理、堆肥等)
- 其他服務(諮詢、審計、訓練等)
- 廢棄物類型
- 一般廢棄物
- 工業用危險廢棄物
- 電子廢棄物
- 塑膠廢棄物
- 醫療廢棄物
- 建築和拆除廢棄物
- 農業廢棄物
- 其他特殊廢棄物(例如放射性廢棄物)
- 訂單模式
- 民眾
- 私人的
第6章 競爭情勢
- 市場集中度
- 策略趨勢
- 市佔率分析
- 公司簡介
- SembWaste(Sembcorp)
- Veolia Singapore
- ALBA W&H Smart City
- Colex Holdings Ltd.
- 800 Super Holdings
- ECO Industrial Environmental Engineering
- Wah & Hua Pte Ltd.
- TES-AMM Singapore
- Ramky Cleantech Services
- Enviro-Hub Holdings
- Cleanway Disposal Services
- ChemCollect Services
- Envipure
- Rictec Pte Ltd.
- CH E-Recycling
- Industrial Wastes Auction
- Citic Envirotech
- IUT Global
- ENVAC Singapore
- Zero Waste SG(Services arm)
第7章 市場機會與未來展望
According to Mordor Intelligence, the Singapore waste management market size is expected to grow from USD 1.34 billion in 2025 to USD 1.4 billion in 2026 and is forecast to reach USD 1.73 billion by 2031 at 4.35% CAGR over 2026-2031.
This report is Segmented by Source (Residential, Commercial, Industrial, and More), by Service Type (Collection, Transportation, Sorting & Segregation, and More), by Waste Type (Municipal Solid, Industrial Hazardous, E-Waste, Plastic, and More), and by by Contract Model (Private and Public). The Market Forecasts are Provided in Terms of Value (USD).
Singapore Waste Management Market Trends and Insights
Zero-Waste Masterplan and Circular-Economy Mandates
The Zero-Waste Masterplan sets a mandatory 70% national recycling rate and orders a 30% cut in landfill waste by 2030, reshaping the cash-flow logic of the Singapore waste management market. Three priority streams, e-waste, food waste, and packaging, together generate more than 40% of total waste, so compliance drives demand for sorting, composting, and advanced recycling kits. The RSA makes food-waste segregation compulsory for large premises from 2024, funneling business toward on-site digesters and bio-pulpers. A new build must now reserve space for such equipment, guaranteeing pipeline projects for technology vendors. Revenue predictability rises because enforcement includes mandatory monthly reporting and escalating penalties. Operators that supply integrated WTE and water recovery, as seen in the Tuas Nexus concept, sit in the policy sweet spot.
Limited Landfill Capacity Driving Incineration and Recycling Demand
Semakau Landfill may reach its design limit by 2035, so the island republic must divert waste or miniaturize it. Four WTE plants currently vaporize 3.8 million t annually and supply 2% of the grid, while the 2021-commissioned TuasOne unit processes 3,600 t per day and delivers 120 MW to the network. The coming Integrated Waste Management Facility (IWMF) at Tuas Nexus will be able to handle 5,800 t per day, becoming the largest single waste complex worldwide. Each incremental tonne incinerated frees scarce land, so feedstock certainty underwrites private-sector appetite for long-term build-operate-transfer deals.
Scarcity of Land for New Facilities
Competing land uses raise opportunity costs, and only a handful of industrial plots remain zoned for odorous or potentially hazardous activities. Multi-story or subterranean designs can compress footprints but raise capex and O&M intricacy. Operators must design for higher throughput in the same envelope, which in turn raises technology risk and insurance premiums. Recycling centers need lay-down yards for baled goods, yet affordable space near collection zones is scarce, limiting new entrants.
Other drivers and restraints analyzed in the detailed report include:
- Mandatory Extended Producer Responsibility Schemes
- NEA Incentive Grants Accelerating Private-Sector Recycling Capacity
- High Capital Expenditure of Advanced Treatment Assets
For complete list of drivers and restraints, kindly check the Table Of Contents.
Segment Analysis
Residential streams captured a commanding 39.12% share of the Singapore waste management market in 2025 as Housing Development Board estates and condominiums generated steady daily tonnage. Commercial waste is the fastest riser, expanding at a 6.31% CAGR on the back of RSA-mandated food-waste segregation, electronics take-back kiosks, and green-lease requirements that compel malls to file waste-reduction plans. The residential backbone ensures base-load demand for public-sector collection routes, yet private haulers now court hotels and business parks with pay-as-you-throw schemes that bundle composters and real-time bin-level sensors.
Growth in the commercial slice also reflects aggressive service diversification. Chain eateries have begun installing 2 t-per-day digesters sourced from local start-ups such as Westcom Bio-Chem, shrinking disposal volumes at source. Office towers adopt Bluetooth-enabled compactors to unlock data that feeds ESG dashboards. Because these innovations go beyond traditional curbside pickup, operators secure higher-margin contracts that underpin the future value of the Singapore waste management market.
Collection, transport, and sorting still represent 47.15% of 2025 revenue, embodying the logistics backbone of the Singapore waste management market. Trucks make short urban hops to transfer stations, supported by Telematics that cut idle time. Yet the recycling and resource-recovery cluster is on a 6.42% CAGR trajectory through 2031. One example is REMEX's bottom-ash processing plant that recovers 90% of ferrous metals from incinerator ash, monetizing an otherwise wasted stream.
Technology upgrades lift margins in recycling. Shell's new pyrolysis oil upgrader turns 50,000 t of hard-to-recycle plastics into cracker feedstock at Pulau Bukom, signaling how resource recovery will dominate incremental dollar value. These moves reposition Singapore as a regional node for high-value circular materials, and they embed the Singapore waste management market size into the petrochemical supply chain.
Complete Report Scope:
- By Source
- Residential
- Commercial (retail, office, etc.)
- Industrial
- Medical (Health and Pharmaceutical)
- Construction & Demolition
- Others (institutional, agricultural, etc)
- By Service Type
- Collection, Transportation, Sorting & Segregation
- Disposal / Treatment
- Landfill
- Recycling & Resource Recovery
- Incineration & Waste-to-Energy
- Others (Chemical Treatment, Composting, etc.)
- Others (Consulting, Audit & Training, etc.)
- By Waste Type
- Municipal Solid Waste
- Industrial Hazardous Waste
- E-waste
- Plastic Waste
- Biomedical Waste
- Construction & Demolition Waste
- Agricultural Waste
- Other Specialized Waste (radio active, etc)
- By Contract Model
- Public
- Private
List of Companies Covered in this Report:
- SembWaste (Sembcorp)
- Veolia Singapore
- ALBA W&H Smart City
- Colex Holdings Ltd.
- 800 Super Holdings
- ECO Industrial Environmental Engineering
- Wah & Hua Pte Ltd.
- TES-AMM Singapore
- Ramky Cleantech Services
- Enviro-Hub Holdings
- Cleanway Disposal Services
- ChemCollect Services
- Envipure
- Rictec Pte Ltd.
- CH E-Recycling
- Industrial Wastes Auction
- Citic Envirotech
- IUT Global
- ENVAC Singapore
- Zero Waste SG (Services arm)
Additional Benefits:
- The market estimate (ME) sheet in Excel format
- 3 months of analyst support
TABLE OF CONTENTS
1 Introduction
- 1.1 Study Assumptions & Market Definition
- 1.2 Scope of the Study
2 Research Methodology
3 Executive Summary
4 Market Landscape
- 4.1 Market Overview
- 4.2 Market Drivers
- 4.2.1 Zero-Waste Masterplan & Circular Economy mandates
- 4.2.2 Mandatory Extended Producer Responsibility (EPR) schemes
- 4.2.3 Limited landfill capacity driving incineration & recycling demand
- 4.2.4 NEA incentive grants accelerating private-sector recycling capacity
- 4.2.5 Pneumatic Waste Conveyance Systems (PWCS) deployment momentum
- 4.2.6 Tuas Nexus waste-to-hydrogen pilot projects
- 4.3 Market Restraints
- 4.3.1 High capex of advanced treatment infrastructure
- 4.3.2 Scarcity of land for new facilities
- 4.3.3 Rising operating costs (labour, fuel, carbon tax)
- 4.3.4 Volatile recyclables prices in a small domestic market
- 4.4 Value / Supply-Chain Analysis
- 4.5 Regulatory Landscape
- 4.6 Technological Outlook
- 4.7 Industry Attractiveness - Porter's Five Force Analysis
- 4.7.1 Threat of New Entrants
- 4.7.2 Bargaining Power of Suppliers
- 4.7.3 Bargaining Power of Buyers
- 4.7.4 Threat of Substitutes
- 4.7.5 Intensity of Competitive Rivalry
5 Market Size & Growth Forecasts (Values, In USD Billion)
- 5.1 By Source
- 5.1.1 Residential
- 5.1.2 Commercial (retail, office, etc.)
- 5.1.3 Industrial
- 5.1.4 Medical (Health and Pharmaceutical)
- 5.1.5 Construction & Demolition
- 5.1.6 Others (institutional, agricultural, etc)
- 5.2 By Service Type
- 5.2.1 Collection, Transportation, Sorting & Segregation
- 5.2.2 Disposal / Treatment
- 5.2.2.1 Landfill
- 5.2.2.2 Recycling & Resource Recovery
- 5.2.2.3 Incineration & Waste-to-Energy
- 5.2.2.4 Others (Chemical Treatment, Composting, etc.)
- 5.2.3 Others (Consulting, Audit & Training, etc.)
- 5.3 By Waste Type
- 5.3.1 Municipal Solid Waste
- 5.3.2 Industrial Hazardous Waste
- 5.3.3 E-waste
- 5.3.4 Plastic Waste
- 5.3.5 Biomedical Waste
- 5.3.6 Construction & Demolition Waste
- 5.3.7 Agricultural Waste
- 5.3.8 Other Specialized Waste (radio active, etc)
- 5.4 By Contract Model
- 5.4.1 Public
- 5.4.2 Private
6 Competitive Landscape
- 6.1 Market Concentration
- 6.2 Strategic Moves
- 6.3 Market Share Analysis
- 6.4 Company Profiles (includes Global level Overview, Market level overview, Core Segments, Financials as available, Strategic Information, Products & Services, and Recent Developments)
- 6.4.1 SembWaste (Sembcorp)
- 6.4.2 Veolia Singapore
- 6.4.3 ALBA W&H Smart City
- 6.4.4 Colex Holdings Ltd.
- 6.4.5 800 Super Holdings
- 6.4.6 ECO Industrial Environmental Engineering
- 6.4.7 Wah & Hua Pte Ltd.
- 6.4.8 TES-AMM Singapore
- 6.4.9 Ramky Cleantech Services
- 6.4.10 Enviro-Hub Holdings
- 6.4.11 Cleanway Disposal Services
- 6.4.12 ChemCollect Services
- 6.4.13 Envipure
- 6.4.14 Rictec Pte Ltd.
- 6.4.15 CH E-Recycling
- 6.4.16 Industrial Wastes Auction
- 6.4.17 Citic Envirotech
- 6.4.18 IUT Global
- 6.4.19 ENVAC Singapore
- 6.4.20 Zero Waste SG (Services arm)
7 Market Opportunities & Future Outlook
- 7.1 White-space & Unmet-need Assessment

 2026-2030年全球廢棄物管理市場
 PFAS廢棄物管理、修復和分解:市場佔有率分析、行業趨勢和統計數據以及成長預測(2026-2031年)紡織廢棄物管理:市場佔有率分析、產業趨勢與統計、成長預測(2026-2031)
 2026-2030年全球建築廢棄物管理市場中國廢棄物管理:市場佔有率分析、產業趨勢與統計、成長預測(2026-2031)印度廢棄物管理:市場佔有率分析、產業趨勢與統計及成長預測(2026-2031)東協廢棄物管理:市場佔有率分析、產業趨勢與統計及成長預測(2026-2031)越南廢棄物管理:市場佔有率分析、產業趨勢與統計、成長預測(2026-2031)非洲廢棄物管理:市場佔有率分析、產業趨勢與統計、成長預測(2026-2031 年)
 多氟烷基物質 (PFAS)廢棄物管理市場:全球產業分析、市場規模、市場佔有率及 2026 年至 2033 年預測(按 PFAS 類型、服務領域、處理方法、廢棄物來源、國家和地區分類)