


 |
市場調查報告書
商品編碼
2117305
紡織廢棄物管理:市場佔有率分析、產業趨勢與統計、成長預測(2026-2031)Textile Waste Management - Market Share Analysis, Industry Trends & Statistics, Growth Forecasts (2026 - 2031) |
||||||

※ 本網頁內容可能與最新版本有所差異。詳細情況請與我們聯繫。
據 Mordor Intelligence 稱,紡織品廢棄物管理市場預計到 2026 年價值 313.9 億美元,高於 2025 年的 283.5 億美元,預計到 2031 年將達到 521.8 億美元。
預計從 2026 年到 2031 年,其複合年成長率將達到 10.72%。
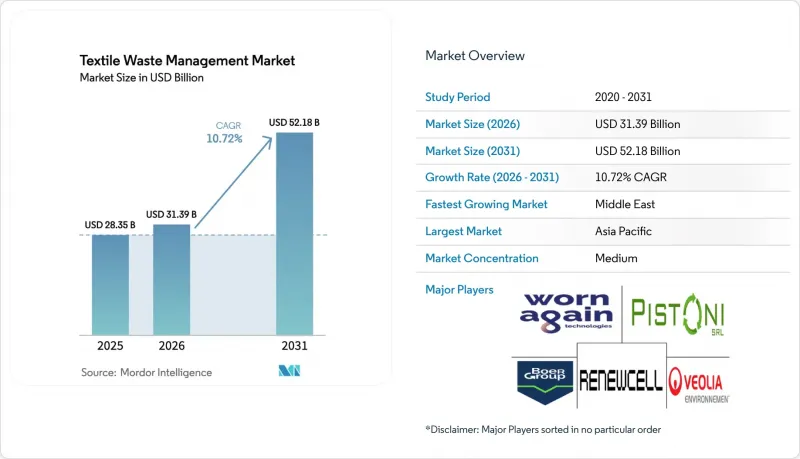
本報告按廢棄物來源(生產前、消費後)、廢棄物類型(天然纖維、合成纖維等)、服務(收集和物流、分類和評級等)、最終用戶(住宅、商業和公共機構等)以及地區(北美、歐洲等)進行細分。市場預測以美元計價。
全球紡織廢棄物管理市場趨勢與洞察
紡織廢棄物強制分類收集的最後期限
隨著歐盟、日本和韓國強制紡織品廢棄物分類收集政策即將到期,預計未來五年內進入正規收集管道的分類紡織品廢棄物量將增加兩倍。初步模型分析表明,由於原料成本下降,具備分類能力的企業與在現貨市場採購原料的企業之間的價格差距將迅速擴大。因此,已簽署收集協議的回收企業很可能在處理費重置之前獲得利潤優勢。此外,市政收集中心建設的加速發展將催生對自動化分類技術的迫切需求,因此,對光學掃描器和機器人技術的投資將成為當務之急。
南亞和東南亞都市區中產階級的快速壯大
孟加拉、越南和印尼居民可支配收入的成長推動了家庭紡織品消費,也導致消費後廢棄物相應增加。儘管將眾多非正規的回收商和貿易商納入正規體系仍然是一項關鍵挑戰,但孟加拉的案例表明,系統性的整合可以降低童工風險,同時創造新的綠色就業機會。為了因應激增的廢棄物流動,地方政府開始考慮掩埋稅。如果回收商不提高分類標準,這項政策措施可能會對回收利潤造成壓力。因此,那些開發低成本可追溯性應用程式的開發者將透過簡化向非正規回收商的付款流程而獲得先發優勢。
與永續發展掛鉤的融資激增
綠色債券、轉型貸款和混合融資機制正在降低參與企業紡織廢棄物管理市場的企業的加權平均資本成本。這種較低的資金籌措縮短了先前難以實現商業化規模的昂貴化學反應器和酵素反應器的投資回收期。由於票面利率與廢棄物再利用率和減排目標掛鉤,經營團隊正優先使用即時績效儀錶板以防止利潤率下降。投資人正在利用這些數據,根據企業的實際影響而非其公開的意圖來檢驗企業,而這種趨勢可能會使缺乏嚴格監控系統的企業處於不利地位。
細分市場分析
至2025年,消費前階段將佔紡織廢棄物管理市場的62.35%,這主要得益於亞洲大規模服飾廠裁剪車間廢棄物的集中。均質的裁剪廢料易於包裝,可直接送到機械回收生產線,進而降低單位物流成本。由於這些廢棄物收集點靠近製造群,服務供應商可以享受規模經濟效益,進而提高營運利潤率。此外,大量廢棄物集中於同一地點,加速了數位化產品護照(用於認證材料來源)的早期應用,而這種方式很可能成為出口市場買方的實際要求。
預計到2031年,廢棄物將以9.55%的複合年成長率成長,超過生產前廢棄物的成長速度,這主要得益於家庭廢棄物收集制度的日益完善,例如強制性分類收集。美國多個城市推行的上門收集計畫以及歐盟提案的生產者責任延伸(EPR)方案表明,日常紡織廢棄物很快就會像玻璃和紙張一樣被追蹤處理。這一趨勢意味著,用於處理各種纖維混合物的自動化分類設備需要更快速的學習曲線,迫使技術供應商不斷改進近紅外線掃描儀和人工智慧分類演算法。隨著各大品牌競相達到再生材料比例目標,那些能夠快速掌握消費後廢棄物多樣性的品牌將獲得更高的處理費用。
預計到2025年,合成纖維(主要是聚酯纖維)將佔紡織廢棄物管理市場規模的47.25%,反映了聚酯纖維在服裝業的重要性。雖然寶特瓶回收基礎設施已在一定程度上得以建立,但閉合迴路的纖維到纖維循環仍處於起步階段,纖維級產品的供應仍不足。改造瓶子生產線以處理紡織廢棄物的運營商面臨高污染水平的問題,但利用現有的解聚技術可以縮短規模化生產週期。原油價格的頻繁波動加劇了人們對再生聚酯獲利能力的敏感性,因此避險已成為回收商的常規做法。
纖維素和再生纖維是成長最快的廢棄物類別,預計年複合成長率將達到 8.63%。酵素水解技術的進步使得棉花能夠轉化為可溶性紙漿,其品質指標可與原生原料媲美,從而實現纖維到纖維的循環回收。先導工廠數據顯示,將酵素與溫和溶劑系統結合使用,可以經濟高效地分離棉滌混紡織物,這為釋放這些混紡織物的價值提供了一條途徑。這項進展預示著市場佔有率將逐漸轉向化學加工方法,因為這些方法能夠在不顯著降低纖維品質的情況下處理多材料服裝。
區域分析
到2025年,亞洲將佔據全球紡織廢棄物管理市場45.65%的佔有率,其中中國是核心,印度和孟加拉則處於領先地位。中國的政策框架正逐步收緊,而孟加拉的紡織廢料收集正從非正規管道轉向半正規管道。如果材料品質標準能夠穩定下來,孟加拉的紡織廢料管理市場可望加速成長。達卡成立的產學研聯合工作小組表明,正規部門的回收商將優先獲得廢料處理進入許可權,從而將那些缺乏合規能力的仲介業者排除在外。這種轉變預示著勞動方式可能會重組,人工分類將被機械化分類線所取代。
預計中東地區將維持最高的成長勢頭,2026年至2031年的複合年成長率將達到8.15%,這主要得益於各國政府旨在到2040年將高達90%的廢棄物掩埋廢棄物進行再利用的政策。阿拉伯聯合大公國的標誌性CircuLife設施等重點項目展現了該地區的獨特優勢,包括低能源成本和一體化的自由區物流。區域監管機構正在對本地生產的紡織品實施最低再生材料含量標準,這有望為海灣國家的產品創造穩定的需求。由此帶來的供應穩定性可能會吸引全球服裝品牌,促使它們在該地區建立採購基地,並間接有助於分散地緣政治風險。
歐洲在明確法規方面發揮了主導作用,已通過相關要求,強制歐盟在2025年1月前對紡織品進行分類回收。目前的回收率約為15%,隨著基礎設施的擴建,仍有很大的成長空間。同時,關於環保定價的討論表明,那些能夠最快地在產品設計中考慮可回收性的生產商將能夠降低合規成本,獎勵上游工程中對紡織品的選擇。北美地區的進展並不均衡。一些州,例如馬薩諸塞州,已經實施了掩埋禁令,導致部分地區原料過剩。這迫使回收商在政策明確的地區擴大其加工能力。儘管拉丁美洲和非洲市場仍然受到非正式體系的限制,但智利和加納的生產者責任延伸制度(EPR)試點計畫可以作為更廣泛實施的典範。這表明,一旦管治穩定下來,市場准入的機會將會出現。
其他好處:
- Excel格式的市場預測(ME)表
- 3個月的分析師支持
目錄
第1章:引言
- 研究假設和市場定義
- 調查範圍
第2章:調查方法
第3章執行摘要
第4章 市場狀況
- 市場概覽
- 市場促進因素
- 強制分類收集紡織廢棄物的最後期限(歐盟:2025 年,日本:2024 年,韓國:2025 年)即將到來,這將導致原料供應擴大。
- 南亞和東南亞都市區中產階級的快速擴張導致需要處理的廢棄紡織品數量激增。
- 歐洲和美國掩埋和焚燒稅的增加,促使地方政府轉向回收合約。
- 海灣合作理事會國家的主權循環經濟基金正在推動中東地區大規模化學品回收中心的建設。
- 拉丁美洲的擴大生產者責任法:發展追償網路與刺激需求
- 與永續發展相關的融資激增,正在降低全球回收基礎設施的資本成本。
- 市場限制因素
- 非洲和南美洲部分地區零散、非正式的採集活動正在損害原料的品質。
- 由於混合纖維回收技術尚未成熟到可商業化應用,因此可回收的廢棄物數量有限。
- 亞洲各地原生聚酯價格的波動給再生纖維的利潤率帶來了壓力。
- 北美地區EPR應用範圍的不一致和政策的不確定性阻礙了其在全國範圍內的推廣。
- 價值供應鏈分析
- 監理與政府政策展望
- 技術展望
- 波特五力模型
- 地緣政治對紡織廢棄物管理的影響
第5章 市場規模及成長預測(價值,十億美元)
- 依廢棄物來源分類
- 生產前廢棄物(製造邊角料)
- 消費後(舊衣服和家用紡織品)
- 廢棄物類型
- 天然纖維
- 棉布
- 羊毛
- 絲綢
- 其他(黃麻、動物纖維等)
- 合成纖維
- 聚酯纖維
- 尼龍
- 其他材質(腈綸、人造絲等)
- 纖維素基和再生纖維
- 黏膠/人造絲
- Lyocell纖維/莫代爾
- 混紡布料
- 有害/受污染的紡織品
- 天然纖維
- 按服務
- 收集和物流
- 分類和分級
- 回收(機械回收、化學/酵素法回收、再利用)
- 能源回收(焚燒和垃圾焚化發電)
- 垃圾掩埋場/掩埋處置
- 最終用戶
- 住宅/一般家庭
- 適用於商業和機構用途(零售、飯店)
- 工業製造(服裝和鞋類)
- 其他(一般廢棄物、醫療設施等)
- 按地區
- 北美洲
- 美國
- 加拿大
- 墨西哥
- 南美洲
- 巴西
- 阿根廷
- 其他南美國家
- 歐洲
- 德國
- 法國
- 英國
- 義大利
- 西班牙
- 比荷盧經濟聯盟(比利時、荷蘭、盧森堡)
- 北歐國家(丹麥、芬蘭、冰島、挪威、瑞典)
- 其他歐洲國家
- 亞太地區
- 中國
- 日本
- 印度
- 孟加拉
- 韓國
- 東協(印尼、泰國、菲律賓、馬來西亞、越南)
- 其他亞太國家
- 中東和非洲
- 沙烏地阿拉伯
- 阿拉伯聯合大公國
- 土耳其
- 埃及
- 南非
- 其他中東和非洲國家
- 北美洲
第6章 競爭情勢
- 市場集中度概述
- 業界領導企業的策略舉措
- 市佔率分析(主要公司)
- 公司簡介
- Worn Again Technologies
- Veolia Environnement SA
- Boer Group
- Renewcell AB
- Pistoni Srl
- Lenzing AG
- Textile Recycling International
- RETEXTIL Deutschland GmbH
- Hyosung TNC Corporation
- Infinited Fiber Company
- Aquafil SpA
- Indorama Ventures PLC
- SOEX Group
- Suez SA
- Le Relais Group
- Fabscrap Inc.
- Patagonia Inc.(Textile Circularity)
- Gr3n SA
- Recover Textile Systems
- Waste Management Inc.
第7章 市場機會與未來展望
According to Mordor Intelligence, textile waste management market size market size in 2026 is estimated at USD 31.39 billion, growing from 2025 value of USD 28.35 billion with 2031 projections showing USD 52.18 billion, growing at 10.72% CAGR over 2026-2031.
This report is Segmented by Waste Source (Pre-Consumer, Post-Consumer), by Waste Type (Natural Fiber, Synthetic Fiber, and More), by Service (Collection & Logistics, Sorting & Grading, and More), by End-User (Residential / Household, Commercial & Institutional, and More), by Geography (North America, Europe and More). The Market Forecasts are Provided in Terms of Value (USD).
Global Textile Waste Management Market Trends and Insights
Mandatory Separate Textile-Waste Collection Deadlines
Mandatory separate collection deadlines in the European Union, Japan, and South Korea are set to triple the volume of sorted textiles entering formal channels within five years. Early-stage modelling indicates that lower feedstock costs will quickly accentuate the spread between operators who own sorting capacity and those who purchase material on the spot market. As a result, recyclers that finalize offtake agreements now will likely lock in margin advantages before processing fees reset. The accelerated build-out of municipal drop-off sites also creates an immediate need for automated sorting technologies, making investment in optical scanners and robotics a likely priority.
Rapid Urban Middle-Class Growth in South & Southeast Asia
Swelling disposable incomes across Bangladesh, Vietnam, and Indonesia are propelling household textile consumption and correspondingly larger post-consumer waste streams. Formalizing the many informal pickers and traders remains the key hurdle, yet evidence from Bangladesh shows that structured aggregation can simultaneously reduce child labor risks and unlock new green-job pathways. The surge in material flow is prompting local authorities to weigh landfill taxes, a policy step that could compress collection margins if recyclers do not upskill sorting standards. Consequently, developers of low-capex traceability apps stand to gain a first-mover advantage by streamlining payment flows to informal collectors.
Surge in Sustainability-Linked Finance
Green bonds, transition loans, and blended-finance vehicles are reducing the weighted average cost of capital for Textile Waste Management market participants. This cheaper funding drives shorter payback periods for expensive chemical or enzymatic reactors, which historically struggled to reach commercial scale. Because coupon step-ups are tied to diversion or emissions targets, executives now prioritize real-time performance dashboards to avoid margin erosion. Investors are using these data layers to differentiate between operators based on verified impact rather than stated intent, a trend that may penalize firms without rigorous monitoring systems.
Other drivers and restraints analyzed in the detailed report include:
- Escalating Landfill & Incineration Levies
- Fragmented Informal Collection in Africa & South America
For complete list of drivers and restraints, kindly check the Table Of Contents.
Segment Analysis
The pre-consumer segment controls 62.35% of the Textile Waste Management market share in 2025, driven by the concentration of cutting-room waste in large Asian garment factories. Homogeneous clippings simplify baling and allow direct channeling into mechanical recycling lines, reducing unit logistics costs. Because these waste nodes are situated near manufacturing clusters, service providers capture economies of density that translate into higher operating margins. The presence of large volumes at single points also encourages early adoption of digital product passports that certify material origin, an approach that is likely to become a de facto buyer requirement in export markets.
Post-consumer waste is forecast to expand at a 9.55% CAGR through 2031, overtaking growth in the pre-consumer stream as separate-collection mandates formalize household take-back. The proliferation of curbside programs in several U.S. municipalities and EPR proposals in the EU suggests that daily textile disposal will soon be tracked much like glass or paper. That momentum implies a steeper learning curve for automated sorting equipment designed to handle variable fiber blends, pushing technology providers to fine-tune near-infrared scanners and AI classifiers. Firms that master post-consumer variability first will secure premium processing fees as brands race to meet recycled-content targets.
Synthetic fibers, mainly polyester, represent 47.25 % of the Textile Waste Management market size in 2025, reflecting polyester's prominence in apparel. Extensive PET bottle recycling infrastructure provides a partial blueprint; however, closed-loop textile-to-textile streams remain embryonic, keeping fiber-grade output in short supply. Operators that retrofit bottle-line assets to digest fabric waste are discovering higher contamination rates, yet can leverage existing depolymerization know-how to shorten scale-up timelines. The incidence of oil-price swings magnifies the sensitivity of recycled-polyester margins, suggesting that hedging instruments will become standard practice for recyclers.
Cellulosic and regenerated fibers exhibit an 8.63 % forecast CAGR, making them the fastest-growing waste cohort. Advances in enzymatic hydrolysis now convert cotton into dissolving pulp with quality metrics comparable to virgin inputs, enabling textile-to-textile circularity. Pilot-plant data indicate that mixed cotton-poly blends can be fractionated economically when enzymes operate in tandem with mild solvent systems, signalling a path to unlock blended-fabric value. This progress foretells a gradual migration of market share toward chemical routes that can process multi-material garments without large fibre-quality sacrifices.
Complete Report Scope:
- By Waste Source
- Pre-consumer (Manufacturing Scrap)
- Post-consumer (Used Garments & Household Textiles)
- By Waste Type
- Natural Fibers
- Cotton
- Wool
- Silk
- Others(Jute, Animal Fibre, etc.)
- Synthetic Fibers
- Polyester
- Nylon
- Others (Acrylic, Rayon, etc.)
- Cellulosic & Regenerated Fibers
- Viscose / Rayon
- Lyocell / Modal
- Blended Fabrics
- Hazardous / Contaminated Textiles
- Natural Fibers
- By Service
- Collection & Logistics
- Sorting & Grading
- Recycling (Mechanical, Chemical/Enzymatic, Reuse)
- Energy Recovery (Incineration & WtE)
- Landfill / Open Dumping
- By End-User
- Residential / Household
- Commercial & Institutional (Retail, Hospitality)
- Industrial Manufacturing (Apparel & Footwear)
- Others (Municipal Garbage, Medical Facilities, etc.)
- By Geography
- North America
- United States
- Canada
- Mexico
- South America
- Brazil
- Argentina
- Rest of South America
- Europe
- Germany
- France
- United Kingdom
- Italy
- Spain
- BENELUX (Belgium, Netherlands, and Luxembourg)
- NORDICS (Denmark, Finland, Iceland, Norway, and Sweden)
- Rest of Europe
- Asia-Pacific
- China
- Japan
- India
- Bangladesh
- South Korea
- ASEAN (Indonesia, Thailand, Philippines, Malaysia, Vietnam)
- Rest of Asia-Pacific
- Middle East and Africa
- Saudi Arabia
- United Arab Emirates
- Turkey
- Egypt
- South Africa
- Rest of Middle East and Africa
- North America
Geography Analysis
Asia holds 45.65% Textile Waste Management market share in 2025, anchored by China and propelled by India and Bangladesh. While China's policy framework gradually tightens, Bangladesh's transition from informal to semi-formal collection reveals a latent acceleration path once material quality standards stabilize. The formation of industry-government taskforces in Dhaka hints that formal sector recyclers will gain privileged access to waste streams, thereby squeezing intermediaries without compliance capabilities. This transformation implies a likely reshaping of labor practices as mechanized sorting lines replace manual grade-outs.
The Middle East records the highest growth trajectory at 8.15% CAGR for 2026-2031, propelled by sovereign mandates that aim to divert up to 90% of waste from landfills by 2040. Anchor projects such as the Landmark CircuLife facility in the UAE showcase region-specific advantages like low energy costs and integrated free-zone logistics. Regional regulators are imposing minimum recycled-content standards on locally produced textiles, which could generate a captive demand pool for Gulf-based output. The ensuing supply stability may attract global apparel brands to establish sourcing bases in the region, implicitly diversifying geopolitical risk.
Europe leads on regulatory clarity after adopting a union-wide requirement for separate textile collection by January 2025. Current capture rates hover near 15%, indicating ample headroom as infrastructure scales. Parallel debate on eco-modulated fees suggests that producers moving fastest on recyclability design will bear lower compliance costs, incentivizing upstream fiber choices. North America shows uneven progress, with states such as Massachusetts implementing landfill bans that create regional pockets of feedstock surplus, pushing recyclers to expand capacity where policy certainty exists. Latin American and African markets remain constrained by informal systems; however, pilot EPR schemes in Chile and Ghana could serve as templates for broader adoption, signaling entry opportunities once governance stabilizes.
- Worn Again Technologies
- Veolia Environnement S.A.
- Boer Group
- Renewcell AB
- Pistoni S.r.l.
- Lenzing AG
- Textile Recycling International
- RETEXTIL Deutschland GmbH
- Hyosung TNC Corporation
- Infinited Fiber Company
- Aquafil S.p.A.
- Indorama Ventures PLC
- SOEX Group
- Suez SA
- Le Relais Group
- Fabscrap Inc.
- Patagonia Inc. (Textile Circularity)
- Gr3n SA
- Recover Textile Systems
- Waste Management Inc.
Additional Benefits:
- The market estimate (ME) sheet in Excel format
- 3 months of analyst support
TABLE OF CONTENTS
1 Introduction
- 1.1 Study Assumptions & Market Definition
- 1.2 Scope of the Study
2 Research Methodology
3 Executive Summary
4 Market Landscape
- 4.1 Market Overview
- 4.2 Market Drivers
- 4.2.1 Mandatory Separate Textile-Waste Collection Deadlines (EU 2025, Japan 2024, South Korea 2025) Expanding Feedstock Supply
- 4.2.2 Rapid Urban Middle-Class Growth in South & Southeast Asia Swelling Post-Consumer Textile Volumes
- 4.2.3 Escalating Landfill & Incineration Levies in Europe and U.S. Driving Municipal Shift to Recycling Contracts
- 4.2.4 GCC Sovereign Circular-Economy Funds Enabling Large-Scale Chemical Recycling Hubs in the Middle East
- 4.2.5 Latin American Extended Producer-Responsibility Laws Formalizing Collection Networks & Stimulating Demand
- 4.2.6 Surge in Sustainability-Linked Finance Lowering Cost of Capital for Global Recycling Infrastructure
- 4.3 Market Restraints
- 4.3.1 Fragmented Informal Collection in Africa & Parts of South America Undermining Feedstock Quality
- 4.3.2 Limited Commercial Readiness of Blended-Fabric Recycling Technologies Restricting Addressable Waste
- 4.3.3 Virgin Polyester Price Volatility Compressing Recycled Fiber Margins Across Asia
- 4.3.4 Patchy EPR Coverage and Policy Uncertainty in North America Hindering Nationwide Scaling
- 4.4 Value / Supply-Chain Analysis
- 4.5 Regulatory & Government Policy Outlook
- 4.6 Technological Outlook
- 4.7 Porter's Five Forces
- 4.7.1 Threat of New Entrants
- 4.7.2 Bargaining Power of Buyers
- 4.7.3 Bargaining Power of Suppliers
- 4.7.4 Threat of Substitutes
- 4.7.5 Intensity of Competitive Rivalry
- 4.8 Impact of Geopolitics on Textile Waste Management
5 Market Size & Growth Forecasts (Value, USD Bn)
- 5.1 By Waste Source
- 5.1.1 Pre-consumer (Manufacturing Scrap)
- 5.1.2 Post-consumer (Used Garments & Household Textiles)
- 5.2 By Waste Type
- 5.2.1 Natural Fibers
- 5.2.1.1 Cotton
- 5.2.1.2 Wool
- 5.2.1.3 Silk
- 5.2.1.4 Others(Jute, Animal Fibre, etc.)
- 5.2.2 Synthetic Fibers
- 5.2.2.1 Polyester
- 5.2.2.2 Nylon
- 5.2.2.3 Others (Acrylic, Rayon, etc.)
- 5.2.3 Cellulosic & Regenerated Fibers
- 5.2.3.1 Viscose / Rayon
- 5.2.3.2 Lyocell / Modal
- 5.2.4 Blended Fabrics
- 5.2.5 Hazardous / Contaminated Textiles
- 5.2.1 Natural Fibers
- 5.3 By Service
- 5.3.1 Collection & Logistics
- 5.3.2 Sorting & Grading
- 5.3.3 Recycling (Mechanical, Chemical/Enzymatic, Reuse)
- 5.3.4 Energy Recovery (Incineration & WtE)
- 5.3.5 Landfill / Open Dumping
- 5.4 By End-User
- 5.4.1 Residential / Household
- 5.4.2 Commercial & Institutional (Retail, Hospitality)
- 5.4.3 Industrial Manufacturing (Apparel & Footwear)
- 5.4.4 Others (Municipal Garbage, Medical Facilities, etc.)
- 5.5 By Geography
- 5.5.1 North America
- 5.5.1.1 United States
- 5.5.1.2 Canada
- 5.5.1.3 Mexico
- 5.5.2 South America
- 5.5.2.1 Brazil
- 5.5.2.2 Argentina
- 5.5.2.3 Rest of South America
- 5.5.3 Europe
- 5.5.3.1 Germany
- 5.5.3.2 France
- 5.5.3.3 United Kingdom
- 5.5.3.4 Italy
- 5.5.3.5 Spain
- 5.5.3.6 BENELUX (Belgium, Netherlands, and Luxembourg)
- 5.5.3.7 NORDICS (Denmark, Finland, Iceland, Norway, and Sweden)
- 5.5.3.8 Rest of Europe
- 5.5.4 Asia-Pacific
- 5.5.4.1 China
- 5.5.4.2 Japan
- 5.5.4.3 India
- 5.5.4.4 Bangladesh
- 5.5.4.5 South Korea
- 5.5.4.6 ASEAN (Indonesia, Thailand, Philippines, Malaysia, Vietnam)
- 5.5.4.7 Rest of Asia-Pacific
- 5.5.5 Middle East and Africa
- 5.5.5.1 Saudi Arabia
- 5.5.5.2 United Arab Emirates
- 5.5.5.3 Turkey
- 5.5.5.4 Egypt
- 5.5.5.5 South Africa
- 5.5.5.6 Rest of Middle East and Africa
- 5.5.1 North America
6 Competitive Landscape
- 6.1 Market Concentration Overview
- 6.2 Strategic Moves by Key Players in the Industry
- 6.3 Market Share Analysis (Key Players)
- 6.4 Company Profiles (includes Global-level Overview, Market-level Overview, Core Segments, Financials as available, Strategic Information, Products & Services, Recent Developments)
- 6.4.1 Worn Again Technologies
- 6.4.2 Veolia Environnement S.A.
- 6.4.3 Boer Group
- 6.4.4 Renewcell AB
- 6.4.5 Pistoni S.r.l.
- 6.4.6 Lenzing AG
- 6.4.7 Textile Recycling International
- 6.4.8 RETEXTIL Deutschland GmbH
- 6.4.9 Hyosung TNC Corporation
- 6.4.10 Infinited Fiber Company
- 6.4.11 Aquafil S.p.A.
- 6.4.12 Indorama Ventures PLC
- 6.4.13 SOEX Group
- 6.4.14 Suez SA
- 6.4.15 Le Relais Group
- 6.4.16 Fabscrap Inc.
- 6.4.17 Patagonia Inc. (Textile Circularity)
- 6.4.18 Gr3n SA
- 6.4.19 Recover Textile Systems
- 6.4.20 Waste Management Inc.
7 Market Opportunities & Future Outlook

 2026-2030年全球廢棄物管理市場
 PFAS廢棄物管理、修復和分解:市場佔有率分析、行業趨勢和統計數據以及成長預測(2026-2031年)
 2026-2030年全球建築廢棄物管理市場中國廢棄物管理:市場佔有率分析、產業趨勢與統計、成長預測(2026-2031)印度廢棄物管理:市場佔有率分析、產業趨勢與統計及成長預測(2026-2031)新加坡廢棄物管理:市場佔有率分析、產業趨勢與統計及成長預測(2026-2031)東協廢棄物管理:市場佔有率分析、產業趨勢與統計及成長預測(2026-2031)越南廢棄物管理:市場佔有率分析、產業趨勢與統計、成長預測(2026-2031)非洲廢棄物管理:市場佔有率分析、產業趨勢與統計、成長預測(2026-2031 年)
 多氟烷基物質 (PFAS)廢棄物管理市場:全球產業分析、市場規模、市場佔有率及 2026 年至 2033 年預測(按 PFAS 類型、服務領域、處理方法、廢棄物來源、國家和地區分類)