


 |
市場調查報告書
商品編碼
2123104
中國廢棄物管理:市場佔有率分析、產業趨勢與統計、成長預測(2026-2031)China Waste Management - Market Share Analysis, Industry Trends & Statistics, Growth Forecasts (2026 - 2031) |
||||||

※ 本網頁內容可能與最新版本有所差異。詳細情況請與我們聯繫。
據 Mordor Intelligence 稱,2025 年中國廢棄物管理市場價值 1,770 億美元,預計到 2031 年將達到 2,465.6 億美元,而 2026 年為 1,870.5 億美元,預測期(2026-2031 年)複合年成長率為 5.68%。
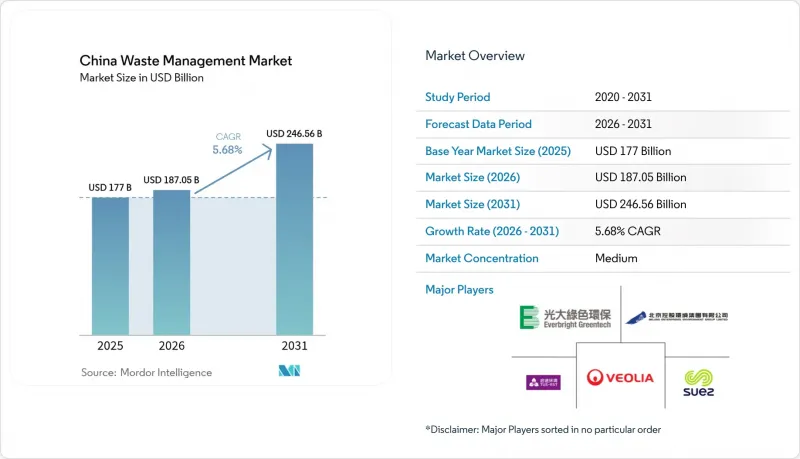
本報告按來源(住宅、商業等)、服務類型(廢棄物處理等)、廢棄物類型(城市固態廢棄物、工業危險廢棄物等)和地區(東部、北部等)進行細分。報告提供了上述所有細分市場的規模和預測(以美元計)。
中國廢棄物管理市場趨勢及洞察
在上網電價補貼機制的支持下,擴大垃圾焚化發電能。
儘管全球1,010多家焚化廠的處理能力幾乎佔全球總處理能力的一半,但由於原料供應不穩定,許多焚化廠的運作負荷低於設計負荷。 2025年的改革將把運作電價補貼機制轉變為市場定價,同時引入綠色電力的再生能源憑證。對於熱效率達70.9%的設施,投資回收期約為4.8年,即使補貼有限也能確保獲利能力。在這種供應過剩的情況下,中國企業正在越南和海灣國家投資,輸出承包工程以及營運和維護(O&M)方面的專業技術。
由於都市化。
人口快速流動導致都市固態廢棄物產生速度超過基礎建設速度。國家發展和改革委員會2024年報告指出,儘管農村地區的垃圾收集率已達90%,但都市化程度不斷提高的地區仍面臨處理能力不足的問題。因此,市場對擴充性、低資產負擔的智慧垃圾桶和模組化中轉站相結合的系統需求日益成長。在中南部城市,為實現2030年所有都市區100%安全處置廢棄物的國家目標,垃圾焚化發電作為一種兼顧廢棄物和能源問題的雙重解決方案正在推廣。技術供應商受益於包含設備和數位化運維服務的捆綁式契約,這加快了引進週期並降低了初始資本風險。
地方政府的財政限制制約了PPP計畫的資金支付。
預算限制使得中型城市難以保障公私合營計畫(PPP)的退休金支付,導致計畫延期和交易對手風險增加。為因應此問題,開發商提案低資產負擔的服務模式和收益分成協議,以在維持服務水準的同時減少市政現金支出。此外,結合綠色債券和碳權額度的混合資金籌措方式也正在興起,以彌補資金缺口。
細分市場分析
預計到2025年,生活垃圾將佔中國廢棄物管理市場的40.12%,鞏固其作為垃圾收集網路規劃基礎的地位。都市區家庭數量的持續成長和個人消費的增加,推動了垃圾從垃圾桶轉移到垃圾收集車的數量不斷增加,迫使市政當局引入物聯網智慧垃圾桶。這些智慧垃圾桶僅在達到80%的容量時才會要求收集,從而將收集路線的效率提高了30%。受電子商務包裝和外送服務趨勢的推動,商業廢棄物預計到2031年將以10.95%的複合年成長率成長,成為所有廢棄物來源中成長最快的。廣東和江蘇省的零售履約中心已經與專門從事紙板壓縮包裝和塑膠破碎的第三方營運商簽訂了契約,這表明隨著垃圾流的集中化,服務專業化程度也在不斷提高。
更嚴格的家庭垃圾分類規定要求居民在入戶處將垃圾分為四類:可回收垃圾、廚餘垃圾、危險廢棄物和一般垃圾。這項監管措施推動了對顏色編碼的垃圾收集容器和人工智慧視覺系統的需求,以便在垃圾轉運站驗證分類的準確性。在都市區地區,官民合作關係(PPP)將垃圾收集、宣傳活動和數據報告整合到一份合約中,為私人公司提供多年的穩定收入來源。同時,產業叢集正將危險廢棄物管理範圍從家庭垃圾擴展到其他領域,透過外包給獲得認證的公司,確保從產生到處置的整個流程的可追溯性。
其他好處:
- Excel格式的市場預測(ME)表
- 3個月的分析師支持
目錄
第1章:引言
- 市場分析與定義的前提條件
- 分析範圍
第2章 分析方法
第3章執行摘要
第4章 市場狀況
- 市場概覽
- 市場促進因素
- 由於都市化進程,二、三線城市需要處理的一般廢棄物量迅速增加。
- 「零廢棄城市」試驗計畫正在全國推廣。
- 在上網電價補貼機制的支持下,擴大垃圾焚化發電能。
- 企業ESG政策正在推動工業廢棄物。
- 加強對電子商務中包裝廢棄物和一次性塑膠製品的禁令執行。
- 資本市場對環境領域官民合作關係(PPP)模式的偏好,導致資本成本降低。
- 市場限制因素
- 地方政府面臨的財政限制會影響PPP付款。
- 當地社區反對在人口稠密的州位置焚化廠。
- 中小企業不遵守危險廢棄物申報制度
- 回收物流的碎片化推高了收整合本。
- 價值鍊和供應鏈分析
- 監理展望
- 技術展望
- 產業吸引力:五力分析
- 買方的議價能力
- 供應商的議價能力
- 新進入者的威脅
- 替代品的威脅
- 競爭公司之間的競爭
- 中國廢棄物管理領域的物流支援與發展
- 中國廢棄物管理產業新興創業公司的策略
- 有效廢棄物管理中的技術創新
第5章:預測市場規模與成長率
- 來源
- 家
- 商業(零售、辦公等)
- 產業
- 醫療(保健和製藥)
- 建設與拆除
- 其他(公共機構、農業等)
- 按服務類型
- 收集、運輸、分類和分離
- 處置/處理
- 掩埋處置
- 回收和資源回收
- 焚燒和垃圾焚化發電
- 其他(化學處理、堆肥等)
- 其他服務(諮詢、審計、訓練等)
- 按廢棄物類型分類
- 都市固態廢棄物(一般廢棄物)
- 危險工業廢棄物
- 電子廢棄物
- 塑膠廢棄物
- 醫療廢棄物
- 建築和拆除廢棄物
- 農業廢棄物
- 其他特殊廢棄物(例如放射性廢棄物)
- 按地區
- 東
- 北方
- 中部
- 南部
- 其他
第6章 競爭情勢
- 市場集中度
- 策略趨勢
- 市佔率分析
- 公司簡介
- Veolia Environment SA(Veolia China)
- China Everbright Environment Group Ltd.
- Suez SA(SUEZ NWS)
- Beijing Enterprises Environment Group Ltd.
- Tus-Sound Environmental Resources Co., Ltd.
- Capital Environment Holdings Ltd.
- Canvest Environmental Protection Group Co., Ltd.
- Grandblue Environment Co., Ltd.
- Dynagreen Environmental Protection Group Co., Ltd.
- Shanghai Environment Group Co., Ltd.
- Shenzhen Energy Environmental Co., Ltd.
- China Jinjiang Environment Holding Co., Ltd.
- Weiming Environmental Protection Co., Ltd.
- CITIC Envirotech Ltd.
- Sound Global Ltd.
- Guangxi Bossco Environmental Protection Co., Ltd.
- Hangzhou Jinjiang Group Co., Ltd.
- Anhui Shengyun Environment-Protection Group Co., Ltd.
- C&G Environmental Protection Holdings Ltd.
- Resou Resources Recovery Co., Ltd.
第7章 市場機會與未來展望
According to Mordor Intelligence, the China waste management market size was valued at USD 177 billion in 2025 and estimated to grow from USD 187.05 billion in 2026 to reach USD 246.56 billion by 2031, at a CAGR of 5.68% during the forecast period (2026-2031).
This report is Segmented by Source (Residential, Commercial, and More), by Service Type (Disposal/Treatment and More), by Waste Type (Municipal Solid Waste, Industrial Hazardous Waste, and More), and by Region (Eastern China, Northern China, and More). The Report Offers Market Size and Forecasts in Value (USD) for all the Above Segments.
China Waste Management Market Trends and Insights
Expansion of Waste-to-Energy Capacity Backed by Feed-in Tariffs
More than 1,010 incineration plants form almost half of global capacity, yet many run below design load because of uneven feedstock supply. The 2025 reform moves feed-in tariffs toward market-based pricing while integrating green electricity certificates. Facilities achieving 70.9% thermal efficiency show payback periods near 4.8 years, enabling profitability with limited subsidies. Overcapacity is driving Chinese firms to invest in Vietnam and the Gulf states, exporting turnkey plants and O&M expertise.
Urbanization-driven MSW Volume Surge in Tier-2 and Tier-3 Cities
Rapid migration is lifting municipal solid waste output faster than infrastructure can keep pace. The 2024 National Development and Reform Commission report confirms 90% rural collection coverage, yet urbanizing districts still face capacity shortfalls. Demand is rising for scalable, asset-light systems that combine smart bins with modular transfer stations. Central and Southern cities are adopting waste-to-energy as a dual solution for waste and electricity, supported by a national goal of 100% safe disposal in all urban areas by 2030. Technology suppliers benefit from contracts that bundle equipment with digital O&M services, accelerating deployment cycles and reducing upfront capital risks.
Local-Government Fiscal Constraints Limiting PPP Payments
Budget pressures restrict the ability of mid-sized cities to guarantee PPP annuities, delaying project execution and raising counterparty risk. Developers respond with asset-light service models and revenue-sharing arrangements that reduce municipal cash outlay yet preserve service standards. Blended-finance vehicles incorporating green bonds and carbon credits are emerging to close funding gaps.
Other drivers and restraints analyzed in the detailed report include:
- Corporate ESG Mandates Driving Industrial Waste Outsourcing
- Zero-Waste City Program Scaling Nationwide
- Community Opposition to Incinerator Siting in Dense Provinces
For complete list of drivers and restraints, kindly check the Table Of Contents.
Segment Analysis
Residential waste contributed 40.12% of the Chinese waste management market in 2025, cementing its role as the backbone for collection network planning. Continuous urban household formation and rising consumer spending push bin-to-truck volumes upward, compelling municipalities to deploy IoT-enabled smart bins that trigger pickups only when 80% full, lifting route efficiency by 30%. Commercial waste, propelled by e-commerce packaging and food delivery trends, is forecast to register an 10.95% CAGR to 2031, the fastest among all sources. Retail fulfillment centers in Guangdong and Jiangsu have already contracted third-party operators for dedicated cardboard baling and plastics shredding, illustrating how service specialization follows waste-stream concentration.
Enhanced residential segregation rules require four-stream sorting that separates recyclables, food, hazardous, and residual waste at the doorstep. This regulatory push spurs demand for color-coded container fleets and AI vision systems that verify sorting accuracy at transfer stations. Urban neighborhood PPPs bundle collection, outreach, and data reporting under single contracts, creating multi-year revenue visibility for private firms. In parallel, industrial clusters outsource hazardous waste management to certified handlers offering cradle-to-grave manifest traceability, expanding service scope beyond household waste.
Complete Report Scope:
- By Source
- Residential
- Commercial (Retail, Office, etc.)
- Industrial
- Medical (Health and Pharmaceutical)
- Construction & Demolition
- Others (Institutional, Agricultural, etc.)
- By Service Type
- Collection, Trasportation, Sorting & Seggregation
- Disposal / Treatment
- Landfill
- Recycling & Resource Recovery
- Incineration & Waste-to-Energy
- Others (Chemical Treatment, Composting, etc.)
- Others (Consulting, Audit & Training, etc.)
- By Waste Type
- Municipal Solid Waste
- Industrial Hazardous Waste
- E-waste
- Plastic Waste
- Biomedical Waste
- Construction & Demolition Waste
- Agricultural Waste
- Other Specialized Waste (Radio Active, etc.)
- By Region
- Eastern China
- Northern China
- Central China
- Southern China
- Others
List of Companies Covered in this Report:
- Veolia Environment SA (Veolia China)
- China Everbright Environment Group Ltd.
- Suez SA (SUEZ NWS)
- Beijing Enterprises Environment Group Ltd.
- Tus-Sound Environmental Resources Co., Ltd.
- Capital Environment Holdings Ltd.
- Canvest Environmental Protection Group Co., Ltd.
- Grandblue Environment Co., Ltd.
- Dynagreen Environmental Protection Group Co., Ltd.
- Shanghai Environment Group Co., Ltd.
- Shenzhen Energy Environmental Co., Ltd.
- China Jinjiang Environment Holding Co., Ltd.
- Weiming Environmental Protection Co., Ltd.
- CITIC Envirotech Ltd.
- Sound Global Ltd.
- Guangxi Bossco Environmental Protection Co., Ltd.
- Hangzhou Jinjiang Group Co., Ltd.
- Anhui Shengyun Environment-Protection Group Co., Ltd.
- C&G Environmental Protection Holdings Ltd.
- Resou Resources Recovery Co., Ltd.
Additional Benefits:
- The market estimate (ME) sheet in Excel format
- 3 months of analyst support
TABLE OF CONTENTS
1 Introduction
- 1.1 Study Assumptions & Market Definition
- 1.2 Scope of the Study
2 Research Methodology
3 Executive Summary
4 Market Landscape
- 4.1 Market Overview
- 4.2 Market Drivers
- 4.2.1 Urbanization-Driven MSW Volume Surge in Tier-2 & Tier-3 Cities
- 4.2.2 Zero-Waste City Pilot Program Scaling Nationwide
- 4.2.3 Expansion of Waste-to-Energy Capacity Backed by Feed-in Tariffs
- 4.2.4 Corporate ESG Mandates Driving Industrial Waste Outsourcing
- 4.2.5 E-commerce Packaging Waste & Single-Use Plastic Ban Enforcement
- 4.2.6 Capital-Market Preference for Environmental PPPs Lowering Cost of Capital
- 4.3 Market Restraints
- 4.3.1 Local-Government Fiscal Constraints Limiting PPP Payments
- 4.3.2 Community Opposition to Incinerator Siting in Dense Provinces
- 4.3.3 SME Non-Compliance with Hazardous-Waste Manifest System
- 4.3.4 Fragmented Recycling Logistics Inflating Reverse-Haul Costs
- 4.4 Value / Supply-Chain Analysis
- 4.5 Regulatory Outlook
- 4.6 Technological Outlook
- 4.7 Industry Attractiveness - Porter's Five Forces
- 4.7.1 Bargaining Power of Buyers
- 4.7.2 Bargaining Power of Suppliers
- 4.7.3 Threat of New Entrants
- 4.7.4 Threat of Substitutes
- 4.7.5 Competitive Rivalry
- 4.8 Logistics Support & Development in Chinese Waste Management
- 4.9 Strategies of Rising Start-ups in Chinese Waste Management
- 4.10 Technological Innovation in Effective Waste Management
5 Market Size & Growth Forecasts (Value, In USD Billion)
- 5.1 By Source
- 5.1.1 Residential
- 5.1.2 Commercial (Retail, Office, etc.)
- 5.1.3 Industrial
- 5.1.4 Medical (Health and Pharmaceutical)
- 5.1.5 Construction & Demolition
- 5.1.6 Others (Institutional, Agricultural, etc.)
- 5.2 By Service Type
- 5.2.1 Collection, Trasportation, Sorting & Seggregation
- 5.2.2 Disposal / Treatment
- 5.2.2.1 Landfill
- 5.2.2.2 Recycling & Resource Recovery
- 5.2.2.3 Incineration & Waste-to-Energy
- 5.2.2.4 Others (Chemical Treatment, Composting, etc.)
- 5.2.3 Others (Consulting, Audit & Training, etc.)
- 5.3 By Waste Type
- 5.3.1 Municipal Solid Waste
- 5.3.2 Industrial Hazardous Waste
- 5.3.3 E-waste
- 5.3.4 Plastic Waste
- 5.3.5 Biomedical Waste
- 5.3.6 Construction & Demolition Waste
- 5.3.7 Agricultural Waste
- 5.3.8 Other Specialized Waste (Radio Active, etc.)
- 5.4 By Region
- 5.4.1 Eastern China
- 5.4.2 Northern China
- 5.4.3 Central China
- 5.4.4 Southern China
- 5.4.5 Others
6 Competitive Landscape
- 6.1 Market Concentration
- 6.2 Strategic Moves
- 6.3 Market Share Analysis
- 6.4 Company Profiles {(includes Global-level Overview, Market-level Overview, Core Segments, Financials as available, Strategic Information, Products & Services, and Recent Developments)}
- 6.4.1 Veolia Environment SA (Veolia China)
- 6.4.2 China Everbright Environment Group Ltd.
- 6.4.3 Suez SA (SUEZ NWS)
- 6.4.4 Beijing Enterprises Environment Group Ltd.
- 6.4.5 Tus-Sound Environmental Resources Co., Ltd.
- 6.4.6 Capital Environment Holdings Ltd.
- 6.4.7 Canvest Environmental Protection Group Co., Ltd.
- 6.4.8 Grandblue Environment Co., Ltd.
- 6.4.9 Dynagreen Environmental Protection Group Co., Ltd.
- 6.4.10 Shanghai Environment Group Co., Ltd.
- 6.4.11 Shenzhen Energy Environmental Co., Ltd.
- 6.4.12 China Jinjiang Environment Holding Co., Ltd.
- 6.4.13 Weiming Environmental Protection Co., Ltd.
- 6.4.14 CITIC Envirotech Ltd.
- 6.4.15 Sound Global Ltd.
- 6.4.16 Guangxi Bossco Environmental Protection Co., Ltd.
- 6.4.17 Hangzhou Jinjiang Group Co., Ltd.
- 6.4.18 Anhui Shengyun Environment-Protection Group Co., Ltd.
- 6.4.19 C&G Environmental Protection Holdings Ltd.
- 6.4.20 Resou Resources Recovery Co., Ltd.
7 Market Opportunities & Future Outlook
- 7.1 White-Space & Unmet-Need Assessment

 2026-2030年全球廢棄物管理市場
 PFAS廢棄物管理、修復和分解:市場佔有率分析、行業趨勢和統計數據以及成長預測(2026-2031年)紡織廢棄物管理:市場佔有率分析、產業趨勢與統計、成長預測(2026-2031)
 2026-2030年全球建築廢棄物管理市場印度廢棄物管理:市場佔有率分析、產業趨勢與統計及成長預測(2026-2031)新加坡廢棄物管理:市場佔有率分析、產業趨勢與統計及成長預測(2026-2031)東協廢棄物管理:市場佔有率分析、產業趨勢與統計及成長預測(2026-2031)越南廢棄物管理:市場佔有率分析、產業趨勢與統計、成長預測(2026-2031)非洲廢棄物管理:市場佔有率分析、產業趨勢與統計、成長預測(2026-2031 年)
 多氟烷基物質 (PFAS)廢棄物管理市場:全球產業分析、市場規模、市場佔有率及 2026 年至 2033 年預測(按 PFAS 類型、服務領域、處理方法、廢棄物來源、國家和地區分類)