


 |
市場調查報告書
商品編碼
2119378
PFAS廢棄物管理、修復和分解:市場佔有率分析、行業趨勢和統計數據以及成長預測(2026-2031年)PFAS Waste Management, Remediation, and Destruction - Market Share Analysis, Industry Trends & Statistics, Growth Forecasts (2026 - 2031) |
||||||

※ 本網頁內容可能與最新版本有所差異。詳細情況請與我們聯繫。
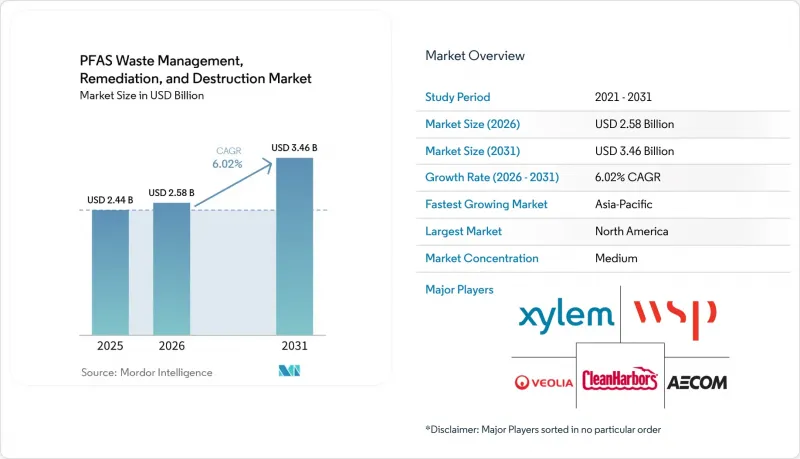
據 Mordor Intelligence 稱,PFAS廢棄物管理、清理和分解市場預計在 2025 年價值 24.4 億美元,預計在預測期(2026-2031 年)內將以 6.02% 的複合年成長率成長,從 2026 年的 26 億美元成長到 2031 億美元的 34.6 億美元。
本報告按污染介質(例如地下水)、淨化技術(例如離子交換樹脂)、破壞性處理技術(例如高溫焚燒)、終端用戶產業(例如供水事業)和地區(例如亞太地區、北美地區、歐洲地區)進行細分。市場預測以美元計價。
全球 PFAS廢棄物管理、修復及分解市場趨勢及洞察
超低濃度 PFAS 飲用水標準有助於採購以符合規定。
美國環保署 (EPA) 根據《國家飲用水主要法規》規定,全氟辛酸 (PFOA) 和全氟辛烷磺酸 (PFOS) 污染物的最高限值為 4 ng/L。 2026 年 5 月發布的法規草案維持了 PFOA 和 PFOS 的基準值,同時為某些系統提供設備改進的寬限期,並將這些系統的合規期限延長至 2031 年。水處理仍然是一項持續的營運要求,因為水處理操作員必須透過更換過濾、監測和殘留物管理來維持其性能。在德國,PFAS-20 總負載標準已於 2026 年 1 月 12 日生效。同時,在日本,PFOS 和 PFOA 自 2026 年 4 月起成為《供水法》規定的強制檢測項目。這些要求將促使主要經濟體在 PFAS廢棄物管理、修復和分解市場方面形成更統一的採購計畫。
政府為因應新興污染物而提供的基礎建設資金可降低採購風險。
《無黨派基礎設施法案》包含50億美元的「小規模或弱勢地區新興污染物」津貼計劃,用於2022至2026財政年度。這項資金將降低需要處理全氟烷基和多氟烷基物質(PFAS)且地方政府收入有限的地區的財政障礙。非競爭性津貼可能更有利於成熟的顆粒活性碳(GAC)和離子交換系統,因為受益者面臨的採購障礙較少,而且通常需要經過商業性驗證的設備。這一趨勢正在為經驗豐富的環境服務供應商在PFAS廢棄物管理、修復和分解市場帶來短期商機。 2026年5月,日本選定了六項技術,用於一項由補充預算資助的示範項目,旨在降低供水事業中全氟辛烷磺酸(PFOS)和全氟辛酸(PFOA)的濃度。加拿大也已授予Arcadis一份PFAS評估和管理契約,有效期至2028年3月,這表明公共房地產組合可以成為一個持續的採購管道。
高昂的加工和能源成本限制了其在成本敏感型市場的應用。
PFAS 處理的營業成本為每立方米 0.03 美元至 28 美元,資本成本為每立方米 0.01 美元至 0.51 美元,具體金額取決於進水基質和所選技術。高溫焚燒需要將二次燃燒室的溫度維持在 1100 度C以上,以確保穩定的礦化作用。此外,還需要進行第二階段的運輸和銷毀處理,因為活性碳 (GAC) 和離子交換系統會將 PFAS 吸附在廢介質中,而不是將其銷毀。這種殘渣處理流程會增加需要全面廢棄物管理的專案的物流和能源成本。開發中國家的小規模地方供水事業和社區即使確認有污染,也面臨成本限制。這種情況限制了對成本敏感的產業在 PFAS廢棄物管理、修復和分解市場中的應用。
細分市場分析
截至2025年,地表水和飲用水佔PFAS廢棄物管理、淨化及分解市場的46.18%。具有法律約束力的飲用水標準要求供水事業在安裝後維持處理性能,因此需要持續進行監測、介質更換、殘留物回收和最終銷毀等工作。工業污水和排放物是成長最快的污染物類別,預計2026年至2031年的複合年成長率將達到7.12%。這主要是由於美國環保署(EPA)的法規和各州的預處理計劃,導致化學品製造商、紡織廠和掩埋營運商的排放義務不斷增加。因此,該市場結合了穩定的市政處理基礎和工業領域不斷擴大的源頭治理項目。
天然有機物會與 PFAS 競爭地表水中顆粒活性碳 (GAC) 的吸附位點,從而降低處理介質的效率並增加更換頻率。因此,當僅使用活性碳處理效果不佳時,可能需要採用離子交換樹脂或高級氧化混合處理方法。地下水仍然是長期聯邦計畫(尤其是軍事和航空設施)的核心問題。北萊茵-威斯特法倫州 2025 年的一項調查發現,在 193 項已記錄的 PFAS 評估中,68% 的項目存在地下水影響。土壤、沉積物、掩埋滲濾液和固態廢棄物也開始受到市場上的單獨監管,美國環保署 (EPA) 2026 年發布的指南針對垃圾掩埋業者的管理技術提出了相關要求。
由於廣泛的法規核准和在全氟辛酸(PFOA)和全氟辛烷磺酸(PFOS)去除方面的豐富應用經驗,到2025年,顆粒活性碳(GAC)在全球市政和工業應用領域的銷售額佔比將達到40.24%。隨著監管機構對短鏈全氟烷基物質(PFAS)的關注度不斷提高,以及GAC吸附此類物質的難度增加,預計2026年至2031年間,離子交換樹脂的複合年成長率將達到7.30%。朗盛公司報告稱,其位於荷蘭科慕的工廠在2025年和2026年對Lewatit MDS TP 108檢驗,實現了對包括超短鏈化合物在內的氟化有機化合物99%以上的去除率。這表明,專用樹脂系統在要求苛刻的工業污水處理應用中具有顯著的有效性。
透過系統化的製程建模揭示水基質的特性,顆粒活性碳(GAC)和離子交換技術能夠更清楚地定義成本參數,為供水事業選擇合適的製程提供可靠的依據。逆滲透和奈米過濾技術在多級工業處理製程中作為濃縮步驟,減少下游需要進行破壞性處理的含全氟烷基和多氟烷基物質(PFAS)的含量。其他技術,例如泡沫分餾和原位修復,則適用於地面處理不切實際的特殊應用,例如受水膜形成泡沫(AFF)影響的含水層羽流。
區域分析
2025年,北美地區佔全球整體營收的37.24%。這得歸功於聯邦指令、基礎設施建設資金以及訴訟和解協議,這些因素共同促成了計畫資金來源的重疊。總額小規模億美元的「小型或弱勢社區新興污染物」計畫為2026會計年度期間的水系統投資提供了支持。大型城市公共產業可以利用州循環基金貸款來部署集中式顆粒活性碳(GAC)和離子交換系統,而農村和小規模供水系統通常依賴非競爭性津貼來獲得入口點解決方案。每種資金籌措途徑都需要不同的產品、交付模式和採購方式。
2025年7月在加拿大簽署的多年期「阿卡迪」(Arcadi)協議表明,聯邦政府的房地產資產組合能夠支持美國境內除單一污染場地之外的系統性PFAS清理工作。在2025年的PFAS廢棄物管理、清理和分解市場中,歐洲佔據第二大區域佔有率,其中德國、北歐國家和英國發揮主導作用。隨著德國PFAS-20總量限制於2026年1月12日生效,為遵守法規而進行的投資已成為供水事業的短期優先事項。針對半導體、交通運輸和能源應用產業的特定條件豁免預計將促使企業分階段投入工業處理,而不是即時全面禁止。
亞太地區預計將成為成長最快的地區,2026年至2031年的複合年成長率將達到7.83%。在日本,自2026年4月起,《供水法》將強制規定PFOS和PFOA作為檢測項目,要求每季進行檢測,以確保總合基準值不超過50 ng/L,這將刺激對處理系統的投資。中國的大規模氟化學品製造地是工業污染的主要來源。同時,巴西和沙烏地阿拉伯正在推動該地區其他地區工業和國防領域對修復措施的初步需求。隨著各國環境法規的逐步落實,多邊水質計畫正在建立採購體系,這使得亞太地區成為PFAS廢棄物管理、修復和分解市場的重要擴張區域。
其他好處:
- Excel格式的市場預測(ME)表
- 3個月的分析師支持
目錄
第1章:引言
- 研究假設和市場定義
- 調查範圍
第2章:調查方法
第3章執行摘要
第4章 市場狀況
- 市場概覽
- 市場促進因素
- 超低 PFAS 飲用水基準值及合規採購
- 政府撥款用於基礎建設,以應對新興污染物
- 擴大工業PFAS的源頭控制和排放處理。
- 基於「污染者付費」原則的企業法律責任、訴訟和成本分擔。
- 對濃縮物和廢舊介質的「回收處置」服務的需求。
- PFAS 指紋分析、即時監測和突破預測。
- 市場限制因素
- 高昂的加工成本、能源成本和殘渣處理成本
- 對破壞性技術的實際規模檢驗有限
- 短鏈 PFAS、基質干擾以及二次廢棄物的複雜性
- 監管機構對廢棄物處置方法(如廢棄物處置、掩埋和地下注入)的接受程度不一。
- 價值鏈分析
- 波特五力分析
第5章 市場規模與成長預測
- 透過污染介質
- 地下水
- 地表水及飲用水
- 土壤和沈積物
- 工業污水和污水
- 其他(掩埋滲濾液、含 PFAS 的固態廢棄物)
- 透過淨化技術
- 顆粒活性碳(GAC)
- 離子交換樹脂
- 逆滲透和奈米過濾
- 其他(發泡分餾法、吸附介質、原位修復及其他技術)
- 透過破壞性技術
- 高溫焚燒
- 超臨界水氧化(SCWO)
- 電化學氧化
- 其他技術(等離子體處理、紫外線高級氧化處理、機械化學分解及其他新興技術)
- 按最終用戶行業分類
- 地方政府供水事業
- 工業製造
- 國防/軍事
- 其他(化學品/石油化工、半導體/電子、機場/航空、石油/天然氣、廢棄物處理公司、掩埋)
- 按地區
- 亞太地區
- 中國
- 印度
- 日本
- 韓國
- 東南亞國協
- 其他亞太國家
- 北美洲
- 美國
- 加拿大
- 墨西哥
- 歐洲
- 德國
- 英國
- 法國
- 義大利
- 北歐國家
- 其他歐洲國家
- 南美洲
- 巴西
- 阿根廷
- 其他南美國家
- 中東和非洲
- 沙烏地阿拉伯
- 南非
- 其他中東和非洲國家
- 亞太地區
第6章 競爭情勢
- 市場集中度
- 策略趨勢
- 市佔率和排名分析
- 公司簡介
- Aclarity, Inc.
- AECOM
- Arcadis
- Battelle Memorial Institute
- Calgon Carbon Corporation
- CDM Smith
- Clean Earth
- CLEAN HARBORS, INC.
- Jacobs
- KURARAY CO., LTD.
- LANXESS AG
- Ovivo Inc.
- Pentair
- Tetra Tech, Inc.
- TRC COMPANIES, INC
- Veolia
- WSP
- Xylem
第7章 市場機會與未來展望
According to Mordor Intelligence, the PFAS waste management, remediation, and destruction market size is estimated at USD 2.44 billion in 2025 and is estimated to grow from USD 2.6 billion in 2026 to USD 3.46 billion by 2031, at a CAGR of 6.02% during the forecast period (2026-2031).
This report is Segmented by Contaminated Media (Groundwater and More), Remediation Technology (Ion Exchange Resins and More), Destruction Technology (High-Temperature Incineration and More), End-User Industry (Municipal Water Utilities and More), and Geography (Asia-Pacific, North America, Europe and More). The Market Forecasts are Provided in Terms of Value (USD).
Global PFAS Waste Management, Remediation, and Destruction Market Trends and Insights
Ultra-Low PFAS Drinking-Water Limits Drive Compliance Procurement
The U.S. Environmental Protection Agency set maximum contaminant levels of 4 ng/L for PFOA and PFOS under its National Primary Drinking Water Regulations. The proposed rule issued in May 2026 retains the PFOA and PFOS limits and gives certain systems more time for capital improvements, with compliance extending to 2031 in those cases. Treatment remains an ongoing operating requirement, as utilities must sustain performance through media replacement, monitoring, and residuals management. Germany made its PFAS-20 aggregate limit legally binding as of January 12, 2026, while Japan made PFOS and PFOA mandatory inspection parameters under the Waterworks Act as of April 2026. These requirements give the PFAS waste management, remediation, and destruction market a more synchronized procurement calendar across major economies.
Government Funding for Emerging-Contaminant Infrastructure Reduces Procurement Risk
The Bipartisan Infrastructure Law includes USD 5 billion for the Emerging Contaminants in Small or Disadvantaged Communities grant program across fiscal years 2022 through 2026. The funding reduces the financial barrier for communities that need PFAS treatment but have limited local revenue. Noncompetitive grants can favor established Granular Activated Carbon (GAC) and ion-exchange systems because recipients face fewer procurement hurdles and often require commercially proven equipment. This pattern supports near-term positions for experienced environmental service providers in the PFAS waste management, remediation, and destruction market. Japan selected 6 technologies in May 2026 for a supplementary-budget demonstration program aimed at reducing PFOS and PFOA concentrations at water utilities. Canada also awarded Arcadis a PFAS assessment and management contract through March 2028, indicating that public real estate portfolios can become recurring procurement channels.
High Treatment and Energy Costs Limit Uptake in Cost-Sensitive Markets
PFAS treatment incurs operating costs ranging from USD 0.03/m3 to USD 28/m3 and capital costs from USD 0.01/m3 to USD 0.51/m3, depending on the influent matrix and the selected technology. High-temperature incineration requires secondary-combustion chamber temperatures above 1,100°C to ensure consistent mineralization. GAC and ion-exchange systems capture PFAS in spent media rather than destroying it, adding a second stage for transport and destructive treatment. This residual cascade raises logistics and energy costs for projects that require full waste management. Smaller rural utilities and communities in developing economies face affordability constraints even when contamination is documented. These conditions limit adoption in cost-sensitive parts of the PFAS waste management, remediation, and destruction market.
Other drivers and restraints analyzed in the detailed report include:
- Industrial PFAS Source-Control Expands Demand Beyond Drinking Water
- Corporate Liability and Litigation Create Ring-Fenced Remediation Budgets
- Limited Full-Scale Validation Delays Adoption of Advanced Destruction Technologies
For complete list of drivers and restraints, kindly check the Table Of Contents.
Segment Analysis
Surface and drinking water accounted for 46.18% of the PFAS waste management, remediation, and destruction market share in 2025. Enforceable drinking-water limits require utilities to maintain treatment performance after installation, creating recurring work in monitoring, media replacement, residuals collection, and final destruction. Industrial wastewater and effluent are the fastest-growing category of contaminated media, with a CAGR of 7.12% from 2026 to 2031, as EPA rulemaking and state pretreatment programs extend discharge obligations to chemical manufacturers, textile mills, and landfill operators. The market, therefore, combines a stable municipal treatment base with an expanding industrial source-control pipeline.
Natural organic matter can compete with PFAS for adsorption sites on granular activated carbon (GAC) in surface water, reducing media efficiency and increasing replacement frequency. This can favor ion-exchange resins and advanced oxidation hybrids where carbon-only treatment is less effective. Groundwater remains central to long-duration federal projects, particularly at military and aviation sites. North Rhine-Westphalia's 2025 inventory found groundwater impact in 68% of 193 documented PFAS assessments. Soil, sediment, landfill leachate, and solid waste are also becoming discrete regulatory targets within the market, and the EPA's 2026 guidance addresses management pathways for landfill operators.
Granular activated carbon (GAC) held a 40.24% share of global revenue in 2025 across municipal and industrial applications, driven by broad regulatory acceptance and extensive deployment experience with PFOA and PFOS. Ion exchange resins are forecast to grow at a CAGR of 7.30% from 2026 to 2031, as short-chain PFAS attract greater regulatory attention and are more difficult for GAC to absorb. LANXESS validated Lewatit MDS TP 108 at a Chemours Netherlands facility in 2025 and 2026, reporting more than 99% removal of fluorinated organic compounds, including ultrashort-chain species. This supports the use of specialized resin systems for demanding industrial wastewater streams.
GAC and ion exchange have better-defined cost parameters when water matrices are characterized through systematic process modeling, providing utilities with a defensible basis for technology selection. Reverse osmosis and nanofiltration serve as concentration stages in multi-step industrial treatment trains, reducing the quantity of PFAS-laden material that requires downstream destruction. Other approaches, including foam fractionation and in situ remediation, address specialized applications such as aqueous film-forming foam-affected aquifer plumes, where above-ground treatment can be impractical.
Complete Report Scope:
- By Contaminated Media
- Groundwater
- Surface and Drinking Water
- Soil and Sediment
- Industrial Wastewater and Effluent
- Others (Landfill Leachate, PFAS-Containing Solid Waste)
- By Remediation Technology
- Granular Activated Carbon (GAC)
- Ion Exchange Resins
- Reverse Osmosis and Nanofiltration
- Others (Foam Fractionation, Adsorptive Media, In-Situ Remediation, Other Technologies)
- By Destruction Technology
- High-Temperature Incineration
- Supercritical Water Oxidation (SCWO)
- Electrochemical Oxidation
- Others (Plasma Treatment, UV-Based Advanced Oxidation, Mechanochemical Destruction, Other Emerging Technologies)
- By End-User Industry
- Municipal Water Utilities
- Industrial Manufacturing
- Defense and Military
- Others (Chemical and Petrochemical, Semiconductor and Electronics, Airports and Aviation, Oil and Gas, Waste Management Companies, Landfills)
- By Geography
- Asia-Pacific
- China
- India
- Japan
- South Korea
- ASEAN Countries
- Rest of Asia-Pacific
- North America
- United States
- Canada
- Mexico
- Europe
- Germany
- United Kingdom
- France
- Italy
- NORDIC Countries
- Rest of Europe
- South America
- Brazil
- Argentina
- Rest of South America
- Middle-East and Africa
- Saudi Arabia
- South Africa
- Rest of Middle-East and Africa
- Asia-Pacific
Geography Analysis
North America accounted for 37.24% of global revenue in 2025, supported by federal mandates, infrastructure funding, and litigation settlements that create overlapping project-funding streams. The USD 5 billion Emerging Contaminants in Small or Disadvantaged Communities program supported water-system investments through fiscal year 2026. Large urban utilities can use State Revolving Fund loans for centralized Granular Activated Carbon (GAC) and ion-exchange systems, while rural and small systems often rely on noncompetitive grants for point-of-entry solutions. These funding routes require different products, delivery models, and procurement approaches.
Canada's July 2025 multi-year Arcadi contract indicates that federal real-estate portfolios can support systematic PFAS remediation beyond individual US sites. Europe held the second-largest regional share in the PFAS waste management, remediation, and destruction market in 2025, with Germany, the Nordic countries, and the United Kingdom leading. Germany's PFAS-20 aggregate limit took effect on January 12, 2026, making compliance investment a near-term water-utility priority. Sector-specific conditional exemptions for semiconductor, transport, and energy uses are expected to create phased industrial treatment spending rather than an immediate prohibition.
Asia-Pacific is projected to be the fastest-growing region at a CAGR of 7.83% from 2026 to 2031. Japan made PFOS and PFOA mandatory Waterworks Act inspection parameters from April 2026, requiring quarterly testing and supporting treatment-system investment for the 50 ng/L combined standard. China's large fluorochemical manufacturing base is a major source of industrial contamination, while Brazil and Saudi Arabia anchor early-stage demand for industrial and defense remediation in other regions. Multilateral water-quality programs are beginning to establish procurement structures as domestic environmental enforcement develops, making Asia-Pacific a significant expansion area for the PFAS waste management, remediation, and destruction market.
- Aclarity, Inc.
- AECOM
- Arcadis
- Battelle Memorial Institute
- Calgon Carbon Corporation
- CDM Smith
- Clean Earth
- CLEAN HARBORS, INC.
- Jacobs
- KURARAY CO., LTD.
- LANXESS AG
- Ovivo Inc.
- Pentair
- Tetra Tech, Inc.
- TRC COMPANIES, INC
- Veolia
- WSP
- Xylem
Additional Benefits:
- The market estimate (ME) sheet in Excel format
- 3 months of analyst support
TABLE OF CONTENTS
1 Introduction
- 1.1 Study Assumptions and Market Definition
- 1.2 Scope of the Study
2 Research Methodology
3 Executive Summary
4 Market Landscape
- 4.1 Market Overview
- 4.2 Market Drivers
- 4.2.1 Ultra-Low PFAS Drinking-Water Limits and Compliance Procurement
- 4.2.2 Government Funding for Emerging-Contaminant Infrastructure
- 4.2.3 Expansion of Industrial PFAS Source-Control and Discharge Treatment
- 4.2.4 Corporate Liability, Litigation, and Polluter-Pays Cost Allocation
- 4.2.5 Capture-to-Destruction Demand for Concentrates and Spent Media
- 4.2.6 PFAS Fingerprinting, Real-Time Monitoring, and Breakthrough Prediction
- 4.3 Market Restraints
- 4.3.1 High Treatment, Energy, and Residuals-Handling Costs
- 4.3.2 Limited Full-Scale Validation of Destruction Technologies
- 4.3.3 Short-Chain PFAS, Matrix Interference, and Secondary Waste Complexity
- 4.3.4 Uneven Regulatory Acceptance of Destruction, Landfilling, and Injection Pathways
- 4.4 Value Chain Analysis
- 4.5 Porter's Five Forces Analysis
- 4.5.1 Bargaining Power of Suppliers
- 4.5.2 Bargaining Power of Buyers
- 4.5.3 Threat of New Entrants
- 4.5.4 Threat of Substitutes
- 4.5.5 Competitive Rivalry
5 Market Size and Growth Forecasts (Value)
- 5.1 By Contaminated Media
- 5.1.1 Groundwater
- 5.1.2 Surface and Drinking Water
- 5.1.3 Soil and Sediment
- 5.1.4 Industrial Wastewater and Effluent
- 5.1.5 Others (Landfill Leachate, PFAS-Containing Solid Waste)
- 5.2 By Remediation Technology
- 5.2.1 Granular Activated Carbon (GAC)
- 5.2.2 Ion Exchange Resins
- 5.2.3 Reverse Osmosis and Nanofiltration
- 5.2.4 Others (Foam Fractionation, Adsorptive Media, In-Situ Remediation, Other Technologies)
- 5.3 By Destruction Technology
- 5.3.1 High-Temperature Incineration
- 5.3.2 Supercritical Water Oxidation (SCWO)
- 5.3.3 Electrochemical Oxidation
- 5.3.4 Others (Plasma Treatment, UV-Based Advanced Oxidation, Mechanochemical Destruction, Other Emerging Technologies)
- 5.4 By End-User Industry
- 5.4.1 Municipal Water Utilities
- 5.4.2 Industrial Manufacturing
- 5.4.3 Defense and Military
- 5.4.4 Others (Chemical and Petrochemical, Semiconductor and Electronics, Airports and Aviation, Oil and Gas, Waste Management Companies, Landfills)
- 5.5 By Geography
- 5.5.1 Asia-Pacific
- 5.5.1.1 China
- 5.5.1.2 India
- 5.5.1.3 Japan
- 5.5.1.4 South Korea
- 5.5.1.5 ASEAN Countries
- 5.5.1.6 Rest of Asia-Pacific
- 5.5.2 North America
- 5.5.2.1 United States
- 5.5.2.2 Canada
- 5.5.2.3 Mexico
- 5.5.3 Europe
- 5.5.3.1 Germany
- 5.5.3.2 United Kingdom
- 5.5.3.3 France
- 5.5.3.4 Italy
- 5.5.3.5 NORDIC Countries
- 5.5.3.6 Rest of Europe
- 5.5.4 South America
- 5.5.4.1 Brazil
- 5.5.4.2 Argentina
- 5.5.4.3 Rest of South America
- 5.5.5 Middle-East and Africa
- 5.5.5.1 Saudi Arabia
- 5.5.5.2 South Africa
- 5.5.5.3 Rest of Middle-East and Africa
- 5.5.1 Asia-Pacific
6 Competitive Landscape
- 6.1 Market Concentration
- 6.2 Strategic Moves
- 6.3 Market Share (%)/Ranking Analysis
- 6.4 Company Profiles (includes Global Overview, Market Overview, Core Segments, Financials as available, Strategic Information, Products and Services, and Recent Developments)
- 6.4.1 Aclarity, Inc.
- 6.4.2 AECOM
- 6.4.3 Arcadis
- 6.4.4 Battelle Memorial Institute
- 6.4.5 Calgon Carbon Corporation
- 6.4.6 CDM Smith
- 6.4.7 Clean Earth
- 6.4.8 CLEAN HARBORS, INC.
- 6.4.9 Jacobs
- 6.4.10 KURARAY CO., LTD.
- 6.4.11 LANXESS AG
- 6.4.12 Ovivo Inc.
- 6.4.13 Pentair
- 6.4.14 Tetra Tech, Inc.
- 6.4.15 TRC COMPANIES, INC
- 6.4.16 Veolia
- 6.4.17 WSP
- 6.4.18 Xylem
7 Market Opportunities and Future Outlook
- 7.1 White-Space and Unmet-Need Assessment

 2026-2030年全球廢棄物管理市場
 紡織廢棄物管理:市場佔有率分析、產業趨勢與統計、成長預測(2026-2031)
 2026-2030年全球建築廢棄物管理市場中國廢棄物管理:市場佔有率分析、產業趨勢與統計、成長預測(2026-2031)印度廢棄物管理:市場佔有率分析、產業趨勢與統計及成長預測(2026-2031)新加坡廢棄物管理:市場佔有率分析、產業趨勢與統計及成長預測(2026-2031)東協廢棄物管理:市場佔有率分析、產業趨勢與統計及成長預測(2026-2031)越南廢棄物管理:市場佔有率分析、產業趨勢與統計、成長預測(2026-2031)非洲廢棄物管理:市場佔有率分析、產業趨勢與統計、成長預測(2026-2031 年)
 多氟烷基物質 (PFAS)廢棄物管理市場:全球產業分析、市場規模、市場佔有率及 2026 年至 2033 年預測(按 PFAS 類型、服務領域、處理方法、廢棄物來源、國家和地區分類)