


 |
市場調查報告書
商品編碼
2114422
東協廢棄物管理:市場佔有率分析、產業趨勢與統計及成長預測(2026-2031)ASEAN Waste Management - Market Share Analysis, Industry Trends & Statistics, Growth Forecasts (2026 - 2031) |
||||||

※ 本網頁內容可能與最新版本有所差異。詳細情況請與我們聯繫。
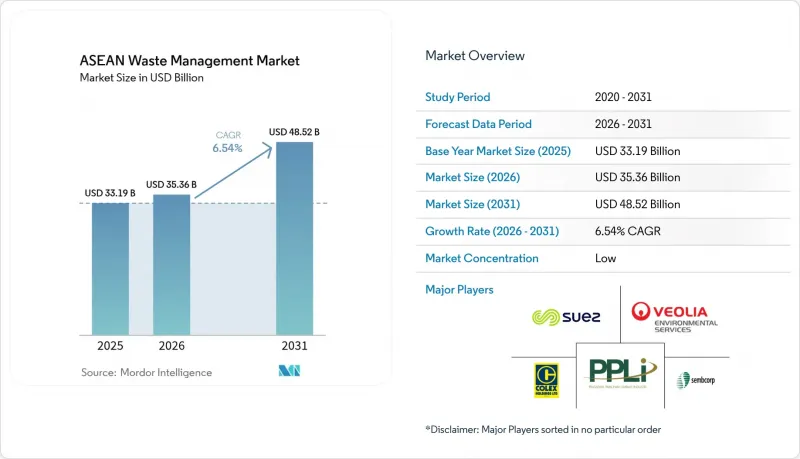
據 Mordor Intelligence 稱,東協廢棄物管理市場預計到 2026 年價值將達到 353.6 億美元,高於 2025 年的 331.9 億美元,預計到 2031 年將達到 485.2 億美元。
預計 2026 年至 2031 年的複合年成長率為 6.54%。
本報告按供應來源(住宅、商業、工業及其他)、服務類型(收集、運輸、分類及其他)、廢棄物類型(生活廢棄物、工業危險廢棄物、電子廢棄物、塑膠及其他)和地區(印尼、泰國、越南、菲律賓、馬來西亞、新加坡及其他東協國家)進行細分。市場預測以美元計價。
東協廢棄物管理市場趨勢及洞察。
循環經濟相關法規將加速公共和私人投資。
全部區域循環經濟目標正調動前所未有的資金用於廢棄物基礎建設。印尼2021年頒布的第98號總統令建立了排碳權市場,預計2030年可減少12.83億噸二氧化碳當量排放,為私人企業帶來長期投資回報。新加坡的《資源永續性法》規定,自2024年起對食物廢棄物進行分類收集,並要求大型包裝製造商在2025年前實施3R(減量化、再利用、再循環)計劃,從而促進上游製程的設計改進。 2021年通過的《東協循環經濟框架》協調了政策藍圖,降低了跨國項目的投資者風險。馬來西亞的目標是到2040年建成18座垃圾焚化發電發電廠,並設定了40%的回收率目標,這顯示監管的確定性如何促進工程儲備的形成。多邊金融機構估計,低塑膠回收率的年度經濟損失高達89億美元,這進一步證明了加快投資的必要性。
將歐盟式的生產者延伸責任制(EPR)推廣到整個東協地區。
統一的生產者延伸責任制(EPR)政策正在改變整個包裝價值鏈的成本結構。越南修訂後的第05/2025/ND-CP號法令將基於收入的豁免額度提高至87萬美元(200億越南盾)和130萬美元(300億越南盾),同時也設定了更明確的回收配額。新加坡於2021年實施的電子產品EPR模式,透過生產者繳款為其回收網路提供資金。印尼的目標是到2025年將塑膠廢棄物減少70%,其方法是利用塑膠信用計劃,允許品牌抵消回收成本。在馬來西亞,2021年引進EPR後,全國回收率從2015年的15.7%提高到2023年的35.38%。可預測的遵循成本將廢棄物轉化為可追溯的原料,幫助東協廢棄物管理市場的持牌業者獲得新建資源回收設施的資金籌措。
高度分散的非正規部門阻礙了原料的可追溯性。
在東協地區,數百萬非正式回收者主導塑膠和紙張的回收工作,但他們缺乏數位化審計追蹤,這使得生產者責任延伸制度(EPR)的檢驗和排碳權的發放變得複雜。在印度尼西亞,被稱為「pemruns」的回收者處理著雅加達每日產生的塑膠垃圾的一半以上,但他們很少提交物料流轉的相關文件,這削弱了循環經濟的指標。聯合國毒品和犯罪問題辦公室(UNODC)指出,在馬來西亞、越南和泰國,廢棄物走私與有組織犯罪之間存在關聯,這進一步阻礙了可追溯性的實現。在柬埔寨農村地區,由於仍嚴重依賴臨時搭建的社區垃圾場,資料收集幾乎是不可能的。缺乏可靠的原料來源訊息,許多回收者失去了進入高階出口市場的機會,而這些市場需要提供監管鏈證明。彌合這一數位落差對於將東協的廢棄物管理市場發展成為一個更正規的體系至關重要。
細分市場分析
預計到2025年,住宅廢棄物將佔總收入的49.23%,凸顯了東協各大特大城市住宅廢棄物產生規模之大。同時,商業廢棄物預計將以8.35%的複合年成長率成長,超過其他所有來源,這主要得益於購物中心和辦公園區遵守更嚴格的垃圾分類要求。隨著大型零售商承擔與包裝相關的生產者責任延伸(EPR)成本,東協商業領域的廢棄物管理市場規模預計將顯著擴大。新加坡的美食廣場和飯店已經開始將有機物分類,以便送至現場消化池處理,越南和馬來西亞也正在製定類似的法規。隨著採購部門對涵蓋垃圾桶供應、審核和報告的單一合約服務的需求日益成長,綜合服務提供者將迎來交叉銷售的機會。
隨著企業垃圾產生者付費購買高級可追溯服務,東協廢棄物管理市場中住宅來源的佔有率可能會下降。提供廢棄物收集預約功能的超級應用程式正在推出積分獎勵捆綁服務,引導更多商業租戶使用正規系統。工業園區持續產生穩定的垃圾量,但如今取得污染防治證書需要強制性的第三方審核,這促使工廠使用持有許可證的垃圾處理商。由於基礎設施建設獎勵策略,建築垃圾量不斷增加,水泥生產商和廢棄物商正在進行合資項目,共同處理建築垃圾和木材廢料。
其他好處
- Excel格式的市場預測(ME)表
- 3個月的分析師支持
目錄
第1章:引言
- 研究假設和市場定義
- 調查範圍
第2章:調查方法
第3章執行摘要
第4章 市場狀況
- 市場概覽
- 市場促進因素
- 透過循環經濟法規加速公共和私人投資
- 將歐盟式的生產者延伸責任制(EPR)推廣到整個東協地區。
- 電子商務導致包裝廢棄物激增
- 印尼、越南和泰國的垃圾焚化發電上網電價政策
- 企業為實現零塑膠足跡所做的努力(消費品製造商和零售商)
- 利用人工智慧最佳化路線以降低收款營運成本(OPEX)(報告不足)
- 市場限制因素
- 由於非正規部門高度分散,原料可追溯性受到限制。
- 成員國之間掩埋處理費的差異
- 關於垃圾焚化發電發電廠碳權額處理政策的不確定性。
- 混合一般廢棄物中氯化物濃度過高導致RDF品質下降(報告不足)
- 價值供應鏈分析
- 監理情勢
- 技術展望
- 產業吸引力—五力分析
- 新進入者的威脅
- 供應商的議價能力
- 買方的議價能力
- 替代品的威脅
- 競爭公司之間的競爭
第5章 市場規模與成長預測
- 按供應來源
- 住宅
- 商業(零售、辦公、其他)
- 產業
- 醫療保健(健康和藥品)
- 建設與拆除
- 其他(組織、農業等)
- 按服務類型
- 收集、運輸、分類和分離
- 處置和處理
- 掩埋處置
- 回收和資源回收
- 焚燒和垃圾焚化發電
- 其他(化學處理、堆肥等)
- 其他(諮詢、審計、訓練等)
- 廢棄物類型
- 一般廢棄物
- 工業用危險廢棄物
- 電子廢棄物
- 塑膠廢棄物
- 醫療廢棄物
- 建築和拆除廢棄物
- 農業廢棄物
- 其他特殊廢棄物(放射性廢棄物等)
- 按地區
- 印尼
- 泰國
- 越南
- 菲律賓
- 馬來西亞
- 新加坡
- 其他東協國家
第6章 競爭情勢
- 市場集中度
- 策略趨勢
- 市佔率分析
- 公司簡介
- Sembcorp Environmental Management
- Veolia Environment SA
- SUEZ
- PT Prasadha Pamunah Limbah Industri(PPLI)
- Colex Holdings
- Remondis
- ALBA Group Asia
- Indorama Ventures(PET Recycling)
- Blue Planet Environmental Solutions
- Greenway Environmental
- Starpal
- Boon Poh Refuse Disposal
- Binh Duong Water-Environment(BIWASE)
- Metro Waste Philippines
- Dangote Waste Management Myanmar
- Waste4Change Indonesia
- Khun Recycle Thailand
- Saigon Green Technology
- Siam Cement Group(SCG)-Circular Economy Unit
- Republic Services Singapore JV
第7章 市場機會與未來展望
According to Mordor Intelligence, ASEAN waste management market size in 2026 is estimated at USD 35.36 billion, growing from 2025 value of USD 33.19 billion with 2031 projections showing USD 48.52 billion, growing at 6.54% CAGR over 2026-2031.
This report is Segmented by Source (Residential, Commercial, Industrial, and More), by Service Type (Collection/Transportation/Sorting, and More), by Waste Type (Municipal Solid, Industrial Hazardous, E-Waste, Plastic, and More), and by Geography (Indonesia, Thailand, Vietnam, Philippines, Malaysia, Singapore, Rest of ASEAN). The Market Forecasts are Provided in Terms of Value (USD).
ASEAN Waste Management Market Trends and Insights
Circular-Economy Regulations Accelerating Public-Private Investment
Region-wide circular-economy targets are unlocking unprecedented capital for waste infrastructure. Indonesia's Presidential Regulation 98/2021 anchors a carbon-credit market that could abate 1,283 million tCO2e by 2030, giving private operators long-term revenue clarity. Singapore's Resource Sustainability Act mandates segregated food waste collection from 2024 and compulsory 3R plans for large packaging producers by 2025, spurring upstream design changes. The ASEAN Framework for Circular Economy, adopted in 2021, harmonizes policy roadmaps and reduces investor risk for cross-border projects. Malaysia's target of 18 WtE plants by 2040, backed by a 40% recycling-rate goal, illustrates how regulatory certainty drives pipeline formation. Multilateral financiers estimate USD 8.9 billion in annual economic losses from poor plastic recovery, strengthening the case for accelerated investment.
EU-Style Extended Producer Responsibility Schemes Spreading Across ASEAN
Harmonized EPR policies are rewriting cost structures across packaging value chains. Vietnam's updated Decree 05/2025/ND-CP raises revenue-based exemptions to USD 0.87 million (VND 20 billion) and USD 1.30 million (VND 30 billion) while setting clearer recycling quotas. Singapore's electronics EPR model, operational since 2021, finances take-back networks through producer fees. Indonesia targets a 70% plastic waste reduction by 2025 using plastic-credit schemes that let brands offset recycling costs. Malaysia's 2021 EPR rollout helped lift the national recycling rate from 15.7% in 2015 to 35.38% in 2023. Predictable compliance fees transform waste into a traceable feedstock, helping formal operators in the ASEAN waste management market secure financing for new materials-recovery facilities.
Highly Fragmented Informal Sector Limiting Feedstock Traceability
Millions of informal pickers dominate plastic and paper recovery across ASEAN, yet operate outside digital audit trails, complicating EPR verification and carbon-credit issuance. Indonesian pemulung collectors manage over half of Jakarta's daily plastic, but rarely provide material-flow documentation, undermining circularity metrics. The United Nations Office on Drugs and Crime links waste trafficking to organized crime in Malaysia, Vietnam, and Thailand, further muddying traceability. Cambodia's rural districts still rely on ad-hoc community dumps, making data capture almost impossible. Without reliable feedstock provenance, many recyclers lose access to premium export markets that demand chain-of-custody proof. Closing this digital divide is crucial for a more formalized ASEAN waste management market.
Other drivers and restraints analyzed in the detailed report include:
- Rapid Rise of E-Commerce Packaging Waste
- AI-Enabled Route Optimization Cutting Collection OPEX
- High Chloride Content in Mixed Municipal Waste Hinders RDF Quality
For complete list of drivers and restraints, kindly check the Table Of Contents.
Segment Analysis
Residential streams delivered 49.23% of 2025 revenue, underscoring the sheer scale of household generation across ASEAN megacities. Commercial waste, however, is set to expand at an 8.35% CAGR, outpacing every other source as malls and office parks comply with stricter segregation mandates. The ASEAN waste management market size for commercial sources is projected to widen notably once large retailers internalize full EPR charges linked to packaging. Food courts and hotels in Singapore already segregate organics for on-site digesters, and similar regulations are being drafted in Vietnam and Malaysia. As procurement teams seek single-contract service bundles covering bins, audit, and reporting, integrated providers will gain cross-selling opportunities.
The ASEAN waste management market share commanded by residential sources may slip because corporate generators purchase premium traceability services that attract higher tariffs. Super-apps offering waste pickup scheduling are bundling reward points, drawing more commercial tenants into formal systems. Industrial parks continue to deliver steady tonnage, yet pollution-control certificates now require third-party audits, nudging factories toward licensed handlers. Construction debris volumes are swelling on the back of infrastructure stimuli, incentivizing joint ventures between cement producers and waste contractors to co-process rubble and wood off-cuts.
Complete Report Scope:
- By Source
- Residential
- Commercial (retail, office, etc.)
- Industrial
- Medical (Health and Pharmaceutical)
- Construction & Demolition
- Others (institutional, agricultural, etc)
- By Service Type
- Collection, Transportation, Sorting & Segregation
- Disposal / Treatment
- Landfill
- Recycling & Resource Recovery
- Incineration & Waste-to-Energy
- Others (Chemical Treatment, Composting, etc.)
- Others (Consulting, Audit & Training, etc.)
- By Waste Type
- Municipal Solid Waste
- Industrial Hazardous Waste
- E-waste
- Plastic Waste
- Biomedical Waste
- Construction & Demolition Waste
- Agricultural Waste
- Other Specialized Waste (radio active, etc)
- By Geography
- Indonesia
- Thailand
- Vietnam
- Philippines
- Malaysia
- Singapore
- Rest of ASEAN Countries
List of Companies Covered in this Report:
- Sembcorp Environmental Management
- Veolia Environment SA
- SUEZ
- PT Prasadha Pamunah Limbah Industri (PPLI)
- Colex Holdings
- Remondis
- ALBA Group Asia
- Indorama Ventures (PET Recycling)
- Blue Planet Environmental Solutions
- Greenway Environmental
- Starpal
- Boon Poh Refuse Disposal
- Binh Duong Water-Environment (BIWASE)
- Metro Waste Philippines
- Dangote Waste Management Myanmar
- Waste4Change Indonesia
- Khun Recycle Thailand
- Saigon Green Technology
- Siam Cement Group (SCG) - Circular Economy Unit
- Republic Services Singapore JV
Additional Benefits:
- The market estimate (ME) sheet in Excel format
- 3 months of analyst support
TABLE OF CONTENTS
1 Introduction
- 1.1 Study Assumptions & Market Definition
- 1.2 Scope of the Study
2 Research Methodology
3 Executive Summary
4 Market Landscape
- 4.1 Market Overview
- 4.2 Market Drivers
- 4.2.1 Circular-economy regulations accelerating public-private investment
- 4.2.2 EU-style Extended Producer Responsibility (EPR) schemes spreading across ASEAN
- 4.2.3 Rapid rise of e-commerce packaging waste
- 4.2.4 Waste-to-Energy (WtE) feed-in tariffs in Indonesia, Vietnam & Thailand
- 4.2.5 Corporate zero-plastic footprints commitments (CPG & retail)
- 4.2.6 AI-enabled route-optimisation cutting collection OPEX (under-reported)
- 4.3 Market Restraints
- 4.3.1 Highly fragmented informal sector limiting feedstock traceability
- 4.3.2 Landfill tipping-fee divergence across member states
- 4.3.3 Policy uncertainty around carbon credit treatment for WtE plants
- 4.3.4 High chloride content in mixed municipal waste hindering RDF quality (under-reported)
- 4.4 Value / Supply-Chain Analysis
- 4.5 Regulatory Landscape
- 4.6 Technological Outlook
- 4.7 Industry Attractiveness - Porter's Five Force Analysis
- 4.7.1 Threat of New Entrants
- 4.7.2 Bargaining Power of Suppliers
- 4.7.3 Bargaining Power of Buyers
- 4.7.4 Threat of Substitutes
- 4.7.5 Intensity of Competitive Rivalry
5 Market Size & Growth Forecasts (Value, In USD Billion)
- 5.1 By Source
- 5.1.1 Residential
- 5.1.2 Commercial (retail, office, etc.)
- 5.1.3 Industrial
- 5.1.4 Medical (Health and Pharmaceutical)
- 5.1.5 Construction & Demolition
- 5.1.6 Others (institutional, agricultural, etc)
- 5.2 By Service Type
- 5.2.1 Collection, Transportation, Sorting & Segregation
- 5.2.2 Disposal / Treatment
- 5.2.2.1 Landfill
- 5.2.2.2 Recycling & Resource Recovery
- 5.2.2.3 Incineration & Waste-to-Energy
- 5.2.2.4 Others (Chemical Treatment, Composting, etc.)
- 5.2.3 Others (Consulting, Audit & Training, etc.)
- 5.3 By Waste Type
- 5.3.1 Municipal Solid Waste
- 5.3.2 Industrial Hazardous Waste
- 5.3.3 E-waste
- 5.3.4 Plastic Waste
- 5.3.5 Biomedical Waste
- 5.3.6 Construction & Demolition Waste
- 5.3.7 Agricultural Waste
- 5.3.8 Other Specialized Waste (radio active, etc)
- 5.4 By Geography
- 5.4.1 Indonesia
- 5.4.2 Thailand
- 5.4.3 Vietnam
- 5.4.4 Philippines
- 5.4.5 Malaysia
- 5.4.6 Singapore
- 5.4.7 Rest of ASEAN Countries
6 Competitive Landscape
- 6.1 Market Concentration
- 6.2 Strategic Moves
- 6.3 Market Share Analysis
- 6.4 Company Profiles (includes Global level Overview, Market level overview, Core Segments, Financials as available, Strategic Information, Products & Services, Recent Developments)
- 6.4.1 Sembcorp Environmental Management
- 6.4.2 Veolia Environment SA
- 6.4.3 SUEZ
- 6.4.4 PT Prasadha Pamunah Limbah Industri (PPLI)
- 6.4.5 Colex Holdings
- 6.4.6 Remondis
- 6.4.7 ALBA Group Asia
- 6.4.8 Indorama Ventures (PET Recycling)
- 6.4.9 Blue Planet Environmental Solutions
- 6.4.10 Greenway Environmental
- 6.4.11 Starpal
- 6.4.12 Boon Poh Refuse Disposal
- 6.4.13 Binh Duong Water-Environment (BIWASE)
- 6.4.14 Metro Waste Philippines
- 6.4.15 Dangote Waste Management Myanmar
- 6.4.16 Waste4Change Indonesia
- 6.4.17 Khun Recycle Thailand
- 6.4.18 Saigon Green Technology
- 6.4.19 Siam Cement Group (SCG) - Circular Economy Unit
- 6.4.20 Republic Services Singapore JV
7 Market Opportunities & Future Outlook
- 7.1 White-space & Unmet-need Assessment

 2026-2030年全球廢棄物管理市場
 PFAS廢棄物管理、修復和分解:市場佔有率分析、行業趨勢和統計數據以及成長預測(2026-2031年)紡織廢棄物管理:市場佔有率分析、產業趨勢與統計、成長預測(2026-2031)
 2026-2030年全球建築廢棄物管理市場中國廢棄物管理:市場佔有率分析、產業趨勢與統計、成長預測(2026-2031)印度廢棄物管理:市場佔有率分析、產業趨勢與統計及成長預測(2026-2031)新加坡廢棄物管理:市場佔有率分析、產業趨勢與統計及成長預測(2026-2031)越南廢棄物管理:市場佔有率分析、產業趨勢與統計、成長預測(2026-2031)非洲廢棄物管理:市場佔有率分析、產業趨勢與統計、成長預測(2026-2031 年)
 多氟烷基物質 (PFAS)廢棄物管理市場:全球產業分析、市場規模、市場佔有率及 2026 年至 2033 年預測(按 PFAS 類型、服務領域、處理方法、廢棄物來源、國家和地區分類)