


 |
市場調查報告書
商品編碼
2123014
資料中心機櫃電源分配單元(PDU):市場佔有率分析、行業趨勢和統計數據以及成長預測(2026-2031 年)Data Center Rack Power Distribution Unit (PDU) - Market Share Analysis, Industry Trends & Statistics, Growth Forecasts (2026 - 2031) |
||||||

※ 本網頁內容可能與最新版本有所差異。詳細情況請與我們聯繫。
根據 Mordor Intelligence 預測,資料中心機櫃電源分配單元 (PDU) 市場預計將從 2025 年的 27.8 億美元成長到 2026 年的 30.1 億美元,到 2031 年達到 46.2 億美元,2026 年至 2031 年的複合年成長率為 8.96%。
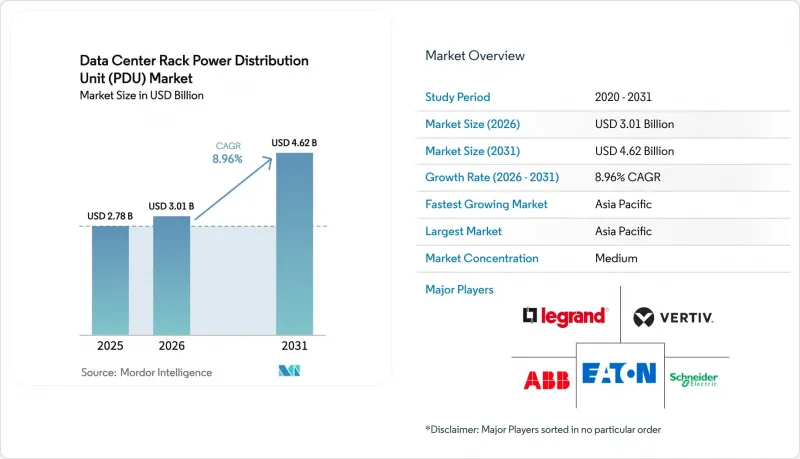
本報告依結構(智慧PDU、基本PDU)、相數(單相、三相)、等級(Tier 1 & 2、Tier 3、Tier 4)、資料中心規模(小規模、中型、大型、超大規模)、資料中心類型(託管、其他)、機架密度(低於10kW、10-20kW、高於20kW)和地區分類地區進行分類。市場預測以美元(USD)計價。
全球資料中心機櫃電源分配單元 (PDU) 市場趨勢與洞察
對超大規模資料中心的投資持續推動對智慧PDU部署的需求。
超大規模營運商正在加速推進其資本計劃,單一園區的建設規模現已超過 1 吉瓦。每個站點都部署了數千個智慧配電單元 (PDU),將高解析度遙測資料傳送到雲端分析平台。這使得營運商能夠平衡各相負載、調度綠色能源,並以計量收費模式將電力數據貨幣化。雖然三相插座級開關硬體的價格平均比基礎型號高出 40% 至 60%,但由於遠端韌體更新無需現場技術人員訪問,因此整體擁有成本得以降低。這種部署方式正在維吉尼亞、東京和法蘭克福的現有叢集中推廣,並正在擴展到阿布達比和吉隆坡,這兩個城市的主權雲端法規要求使用本土基礎設施。
機架級配電中的人工智慧能源管理整合
下一代配電單元 (PDU) 中嵌入的邊緣 AI 晶片可本地處理電壓、諧波和溫度測量數據,並在微秒級內發出指令,以抑制非關鍵負載或確保為運行狀況良好的相供電。這實現了計算編配和電力分配之間的閉迴路,使容器平台能夠將能源作為即時調度約束條件。託管服務供應商利用精度高達 ±1% 的子架級測量數據,為租戶提供透明的收費,並支援更環保的投資組合融資。
機架功率密度的增加已經超過了傳統資料中心的樓層額定功率。
2020 年前建造的設施設計功率容差為 5–8 kW,每平方英尺樓層荷載低於 200 W,但如今卻面臨著 20–30 kW 的需求,需要進行結構加固、更換母線槽和升級公用變壓器。維修預算通常高達每平方英尺 500–800 美元,工期為 6–12 個月,嚴重影響了創收營運。在新加坡和倫敦等土地資源有限的大都會圈,營運商正在權衡升級成本與在邊緣資料中心和待開發區部署的成本,導致 PDU 現代化進程放緩,整體銷售下降。
細分市場分析
至2025年,智慧電源單元(PDU)的市佔率將達到61.42%,其較高的平均售價正推動資料中心機櫃電源分配單元(PDU)市場這一細分領域的持續成長。智慧電源條可實現精細的千瓦時追蹤、插座級切換和預測性維護,為基於使用量的託管收費系統和混合雲端編配奠定了基礎。服務供應商在實施機架收費後,每個機櫃的收入增加了12%至18%。預計到2031年,基礎型PDU的複合年成長率將達到9.43%,在低密度、成本敏感型場所仍具有市場價值,但隨著雲端託管管理入口網站降低智慧產品的總擁有成本(TCO),其市場佔有率正在下降。在整個預測期內,智慧電源單元的市場佔有率預計將逐年穩步成長,因為韌體訂閱模式使其成為即使對小規模企業也具有經濟吸引力的選擇。
電源分配單元 (PDU) 現已與 VMware vRealize 和 Red Hat Ansible 等編配工具整合,在 IT 工作負載和電力容量之間形成反饋迴路。透過基於即時電力數據控制伺服器啟動,負責人可以減少閒置容量並推遲變壓器升級,這在電力公司需要 18 至 24 個月的提前期的情況下尤其重要。隨著人工智慧分析、安全連接以及監管機構對 PUE 透明度的推動,智慧轉型之路正變得更加穩固,資料中心機櫃電源分配單元 (PDU) 市場預計將繼續保持其領先地位。
到 2025 年,三相設備將佔據資料中心機櫃電源分配單元 (PDU) 市場 58.32% 的佔有率,預計到 2031 年將以 9.26% 的複合年成長率 (CAGR) 成長。三相架構透過將負載分配到多根導線上並將供電電壓提高到 415V 或 480V,滿足了現代機架的供電需求。與單相 208V 相比,這可將電阻損耗降低一半。超大規模雲端已在 2025 年前將這種拓撲結構標準化,以實現超過 15kW 的密度,並為未來的液冷 AI 伺服器預留空間。加州、紐約州和德國的獎勵計劃透過獎勵 PUE閾值低於 1.2 的設施,進一步加速了這一轉型。達到此閾值通常需要三相配電。因此,三相配電仍然是容量擴展和新建設的基礎,鞏固了其在資料中心機櫃電源分配單元 (PDU) 市場的主導地位。
另一方面,單相電源在邊緣環境和小規模企業伺服器機房中仍然發揮著重要作用,因為這些場所的電工可能缺乏三相電源方面的專業知識,或者當地法規可能限制高壓饋線的使用。目前,廠商的產品藍圖包含單相和三相電源,並採用通用的韌體和管理框架,這有助於營運商管理混合環境。然而,隨著人工智慧的普及,即使是分公司的每機架功率也超過 10kW 的情況日益增多,預計市場需求將繼續向三相電源轉移,單相電源在總出貨量中的佔有率將不可避免地下降。
區域分析
預計到2025年,亞太地區將佔據40.13%的市場。這主要得益於各國雲端計畫和可再生能源戰略的推動,這些計畫和策略正在加速內陸地區(土地資源豐富且清潔能源資源充足)超大規模資料中心的建設。僅中國的「東方數據,西方計算」計畫就已推動PDU出貨量達到兩位數吉瓦級項目,而印度1000兆瓦的在建項目則為國內SaaS公司和跨國公司的專屬式資料中心提供支持。在日本,PDU出貨量也逐漸成長,尤其是在愛知縣和神奈川縣周邊的汽車測試場地和智慧製造邊緣節點,汽車製造商將感測器資料傳輸到即時分析叢集。這些趨勢推動該地區以10.14%的複合年成長率成長,鞏固了其在資料中心機櫃電源分配單元(PDU)市場的主導地位。
北美也緊追在後,計畫在2024-2025年間投入超過1,000億美元的超大規模資料中心建設資金。維吉尼亞州勞登縣正在進行創紀錄的建設,而奧勒岡州高比例可再生能源電網也吸引了許多GPU集群前來獲取綠色雲端積分。由於當地電力公司的供貨週期超過兩年,超大規模超大規模資料中心業者正在預購變壓器並批量訂購配電單元(PDU),以確保供應到2027年。儘管北美地區的成長速度低於亞太地區,但其龐大的市場規模保證了資料中心機櫃配電單元(PDU)的供應充足。
在歐洲,能源成本不斷上漲,加上歐盟能源效率指令(EU Energy EFE Directive)的嚴格能源效率要求(該指令強制運營商實現1.3或更低的PUE值並按季度報告能耗),投資正從擴容轉向提升現有設施的能效,具備精細遙測功能的智慧PDU更受青睞,但整體出貨量成長受到抑制。同時,中東和非洲正在崛起為洲際互聯中心。阿拉伯聯合大公國和沙烏地阿拉伯的「主權雲端」計畫正在推動該地區超大規模資料中心的建設,而像NEOM這樣的待開發區智慧城市計畫則包含由100%可再生能源運作的5GW資料中心,這為高容量三相單元創造了新的需求支柱。在南美洲,巴西實施的國內數據本地化政策鼓勵了雲端服務提供者進入該地區,並促進了區域性資料中心的建設,儘管宏觀經濟波動,但仍推動了對PDU的需求。
其他好處
- Excel格式的市場預測(ME)表
- 3個月的分析師支持
目錄
第1章:引言
- 研究假設和市場定義
- 調查範圍
第2章:調查方法
第3章執行摘要
第4章 市場狀況
- 市場概覽
- 市場促進因素
- 對超大規模資料中心的投資持續推動對智慧PDU部署的需求。
- 軟體定義資料中心的電力供應和需求產業要求
- 擴大邊緣資料中心的應用
- 機架級配電中的人工智慧能源管理整合
- 高密度運算加速器的日益普及對先進的電源分配單元 (PDU) 提出了更高的要求。
- 由於向液冷過渡,需要重新設計用於混合電源和冷卻供應系統的 PDU。
- 市場限制因素
- 資料中心的更新周期短於其預期獲利壽命。
- 智慧PDU所用半導體元件的供應鏈波動性
- 機架功率密度的增加已經超過了傳統資料中心的樓層額定功率。
- 網路連線式PDU的網路安全問題
- 產業價值鏈分析
- 監理情勢
- 技術展望
- 宏觀經濟因素的影響
- 波特五力分析
第5章 市場規模與成長預測
- 按結構
- 智慧型PDU
- 基本 PDU
- 愛別
- 單相
- 三相
- 層級類型
- 一級和二級
- 三級
- 第四級
- 按資料中心規模
- 小規模資料中心
- 中型資料中心
- 大型資料中心
- 超大規模資料中心
- 依資料中心類型
- 託管資料中心
- 超大規模資料中心業者/CSP資料中心
- 企業邊緣資料中心
- 按機架密度(每機架千瓦數)
- 10千瓦或以下
- 10~20kW
- 超過20千瓦
- 按地區
- 北美洲
- 美國
- 加拿大
- 墨西哥
- 南美洲
- 巴西
- 阿根廷
- 其他南美國家
- 歐洲
- 德國
- 英國
- 法國
- 義大利
- 西班牙
- 其他歐洲國家
- 亞太地區
- 中國
- 印度
- 日本
- 韓國
- 澳洲和紐西蘭
- 其他亞太國家
- 中東
- 沙烏地阿拉伯
- 阿拉伯聯合大公國
- 土耳其
- 其他中東國家
- 非洲
- 南非
- 奈及利亞
- 埃及
- 其他非洲地區
- 北美洲
第6章 競爭情勢
- 市場集中度
- 策略趨勢
- 市佔率分析
- 公司簡介
- ABB Ltd.
- Schneider Electric SE
- Vertiv Group Corp.
- Eaton Corporation plc
- Legrand SA
- nVent Electric plc(Enlogic)
- Rittal GmbH & Co. KG
- Cyber Power Systems Inc.
- Aten International Co. Ltd.
- Conteg spol. s ro
- Server Technology Inc.
- Geist Global
- Tripp Lite
- Huawei Technologies Co., Ltd.
- Panduit Corp.
- PDU eXpert
- The Siemon Company
- Starline
- Leviton Manufacturing Co., Inc.
第7章 市場機會與未來展望
According to Mordor Intelligence, the data center rack power distribution unit (PDU) market size is expected to increase from USD 2.78 billion in 2025 to USD 3.01 billion in 2026 and reach USD 4.62 billion by 2031, growing at a CAGR of 8.96% over 2026-2031.
This report is Segmented by Construction (Smart PDU, and Basic PDU), Phase (Single-Phase, and Three-Phase), Tier Type (Tier 1 and 2, Tier 3, and Tier 4), Data Center Size (Small, Medium, Large, and Hyperscale), Data Center Type (Colocation, and More), Rack Density (Up To 10 KW, 10-20 KW, and Above 20 KW), and Geography. The Market Forecasts are Provided in Terms of Value (USD).
Global Data Center Rack Power Distribution Unit (PDU) Market Trends and Insights
Investments in Hyperscale Data Centers Continuing to Spur Demand for Smart PDU Installations
Hyperscale operators have accelerated capital plans, with single-campus builds now topping 1 GW. Each site deploys thousands of intelligent PDUs that stream high-resolution telemetry into cloud analytics platforms, letting operators balance phase load, enforce green-energy scheduling, and monetize power data within usage-based billing models. Price premiums on three-phase outlet-level switching hardware average 40-60% over basic units, yet total cost of ownership falls as remote firmware updates eliminate technician truck rolls. Adoption permeates established clusters in Virginia, Tokyo, and Frankfurt, and is spreading to Abu Dhabi and Kuala Lumpur, where sovereign-cloud rules require in-country infrastructure.
Integration of AI-Driven Energy Management for Rack-Level Distribution
Edge AI chips embedded inside next-generation PDUs process voltage, harmonic, and thermal readings locally, issuing commands in microseconds to curtail non-critical loads or route power to healthier phases. This closes the loop between compute orchestration and electrical distribution, allowing container platforms to incorporate energy as a real-time scheduling constraint. Colocation providers capitalize on sub-rack metering within +-1% accuracy, enabling transparent tenant billing and supporting greener portfolio financing.
Rising Rack Power Densities Exceeding Legacy Data Center Floor Ratings
Facilities built before 2020 feature 5-8 kW design envelopes and floor loading below 200 W per square foot; they now confront 20-30 kW demands that require structural reinforcement, busway replacement, and utility transformer upgrades. Retrofit budgets often reach USD 500-800 per square foot, extend over 6-12 months, and interrupt revenue-generating operations. Operators in land-constrained metros such as Singapore and London weigh the cost of upgrades against edge or greenfield deployment, delaying PDU revamps and suppressing overall unit volume.
Other drivers and restraints analyzed in the detailed report include:
- Increasing Adoption of High-Density Compute Accelerators Demanding Advanced PDUs
- Shift to Liquid Cooling Requiring PDU Redesign for Hybrid Power and Cooling Delivery
- Cybersecurity Concerns Around Networked PDUs
For complete list of drivers and restraints, kindly check the Table Of Contents.
Segment Analysis
Smart units already command with 61.42% market share in 2025, and their higher average selling price continues to lift the data center rack power distribution unit market size for this segment. Intelligent strips enable granular kilowatt-hour tracking, outlet-level switching, and predictive maintenance, capabilities that underpin usage-based colocation pricing and hybrid-cloud orchestration. Service providers report revenue-per-cabinet gains of 12-18% after enabling sub-rack billing. Basic PDUs forecast to advance at a 9.43% CAGR to 2031, viable in low-density and cost-sensitive sites, yet their share erodes as cloud-hosted management portals reduce the total cost of ownership for smart options. Over the forecast horizon, smart units accrue incremental share each year as firmware subscription models make them financially attractive even for small enterprises.
PDUs now integrate with orchestration tools such as VMware vRealize and Red Hat Ansible, creating a feedback loop between IT workloads and electrical capacity. By controlling server spin-up based on real-time power data, operators lower stranded capacity and defer transformer upgrades, a major incentive when utility lead times stretch to 18-24 months. The convergence of AI analytics, secure connectivity, and regulatory push toward PUE transparency further locks in the smart trajectory, ensuring that the data center rack power distribution unit (PDU) market retains this premium profile.
In 2025, three-phase equipment held a 58.32% share of the data center rack power distribution unit market and is set to achieve a 9.26% CAGR through 2031. Three-phase architectures satisfy modern rack power needs by distributing load across multiple conductors and elevating the supply voltage to 415 V or 480 V, which halves resistive losses relative to single-phase 208 V. Hyperscale clouds standardized on this topology in 2025 to achieve densities beyond 15 kW and maintain headroom for future liquid-cooled AI servers. Incentive programs in California, New York, and Germany further accelerate transition by rewarding sites that meet sub-1.2 PUE thresholds, which typically require three-phase distribution. Consequently, three-phase remains the cornerstone of capacity expansions and greenfield builds, solidifying its majority position in the data center rack power distribution unit (PDU) market.
Single-phase remains relevant at the edge and in small enterprise rooms because electricians may lack three-phase expertise, and local codes sometimes restrict high-voltage feeders. Vendor roadmaps now include single- and three-phase variants within common firmware and management frameworks, helping operators manage mixed estates. Yet as AI adoption pushes even branch offices beyond 10 kW per rack, demand will continue to tilt toward three-phase, inevitably shrinking single-phase share in total shipment terms.
Complete Report Scope:
- By Construction
- Smart PDU
- Basic PDU
- By Phase
- Single-Phase
- Three-Phase
- By Tier Type
- Tier 1 and 2
- Tier 3
- Tier 4
- By Data Center Size
- Small Data Center
- Medium Data Center
- Large Data Center
- Hyperscale Data Center
- By Data Center Type
- Colocation Data Center
- Hyperscalers Data Center/CSPs
- Enterprise and Edge Data Center
- By Rack Density (kW per Rack)
- Up to 10 kW
- 10-20 kW
- Above 20 kW
- By Geography
- North America
- United States
- Canada
- Mexico
- South America
- Brazil
- Argentina
- Rest of South America
- Europe
- Germany
- United Kingdom
- France
- Italy
- Spain
- Rest of Europe
- Asia-Pacific
- China
- India
- Japan
- South Korea
- Australia and New Zealand
- Rest of Asia-Pacific
- Middle East
- Saudi Arabia
- United Arab Emirates
- Turkey
- Rest of Middle East
- Africa
- South Africa
- Nigeria
- Egypt
- Rest of Africa
- North America
Geography Analysis
Asia-Pacific accounted for 40.13% of the market share in 2025, helped by national cloud programs and renewable-energy strategies that funnel hyperscale builds to inland provinces where land and clean power are abundant. China's Eastern Data Western Computing policy alone drives PDU shipments into double-digit gigawatt projects, while India's 1,000 MW pipeline supports domestic SaaS and multinational captives. Japan adds incremental volume through automotive test tracks and smart-manufacturing edge nodes, particularly around Aichi and Kanagawa prefectures, where automakers feed sensor data into real-time analytics clusters. These dynamics underpin the region's 10.14% CAGR and reinforce its lead in the data center rack power distribution unit market size.
North America follows, supported by USD 100 billion-plus hyperscale capex commitments in 2024-2025. Virginia's Loudoun County continues to absorb record-setting builds, and Oregon's renewable-heavy grid attracts GPU farms that target green cloud credits. Because local utility lead times stretch beyond two years, hyperscalers pre-purchase transformers and contract PDUs in bulk, securing unit allocations through 2027. While growth moderates relative to Asia-Pacific, sheer scale keeps volume robust in the data center rack power distribution unit (PDU) market.
Europe lags on account of energy-cost inflation and strict efficiency mandates under the EU Energy Efficiency Directive, which press operators to demonstrate sub-1.3 PUE performance and quarterly consumption reporting. Investment shifts toward retrofit efficiency rather than capacity addition, favoring intelligent PDUs with granular telemetry but tempering overall shipment growth. Middle East and Africa, meanwhile, emerge as intercontinental connectivity hubs. Sovereign-cloud policies in the United Arab Emirates and Saudi Arabia spur local hyperscale builds, and greenfield smart-city initiatives such as NEOM incorporate fully renewable 5 GW data centers, adding a fresh vector of demand for high-capacity three-phase units. South America rounds out the picture as Brazil enforces in-country data localization, motivating cloud entrants to establish regional facilities that push PDU demand upward despite macro volatility.
- ABB Ltd.
- Schneider Electric SE
- Vertiv Group Corp.
- Eaton Corporation plc
- Legrand SA
- nVent Electric plc (Enlogic)
- Rittal GmbH & Co. KG
- Cyber Power Systems Inc.
- Aten International Co. Ltd.
- Conteg spol. s r.o.
- Server Technology Inc.
- Geist Global
- Tripp Lite
- Huawei Technologies Co., Ltd.
- Panduit Corp.
- PDU eXpert
- The Siemon Company
- Starline
- Leviton Manufacturing Co., Inc.
Additional Benefits:
- The market estimate (ME) sheet in Excel format
- 3 months of analyst support
TABLE OF CONTENTS
1 INTRODUCTION
- 1.1 Study Assumptions and Market Definition
- 1.2 Scope of the Study
2 RESEARCH METHODOLOGY
3 EXECUTIVE SUMMARY
4 MARKET LANDSCAPE
- 4.1 Market Overview
- 4.2 Market Drivers
- 4.2.1 Investments in Hyperscale Data Centers Continuing to Spur Demand for Smart PDU Installations
- 4.2.2 Industry Mandates for Power Availability and Demand for Software-Defined Data Centers
- 4.2.3 Rising Deployment of Edge Data Centers
- 4.2.4 Integration of AI-Driven Energy Management for Rack-Level Distribution
- 4.2.5 Increasing Adoption of High-Density Compute Accelerators Demanding Advanced PDUs
- 4.2.6 Shift to Liquid Cooling Requiring PDU Redesign for Hybrid Power and Cooling Delivery
- 4.3 Market Restraints
- 4.3.1 Faster Refresh Life Cycle than Data Center Profitable Life Expectancy
- 4.3.2 Supply Chain Volatility for Semiconductor Components in Intelligent PDUs
- 4.3.3 Rising Rack Power Densities Exceeding Legacy Data Center Floor Ratings
- 4.3.4 Cybersecurity Concerns Around Networked PDUs
- 4.4 Industry Value Chain Analysis
- 4.5 Regulatory Landscape
- 4.6 Technological Outlook
- 4.7 Impact of Macroeconomic Factors
- 4.8 Porter's Five Forces Analysis
- 4.8.1 Threat of New Entrants
- 4.8.2 Bargaining Power of Suppliers
- 4.8.3 Bargaining Power of Buyers
- 4.8.4 Threat of Substitutes
- 4.8.5 Competitive Rivalry
5 MARKET SIZE AND GROWTH FORECASTS (VALUE)
- 5.1 By Construction
- 5.1.1 Smart PDU
- 5.1.2 Basic PDU
- 5.2 By Phase
- 5.2.1 Single-Phase
- 5.2.2 Three-Phase
- 5.3 By Tier Type
- 5.3.1 Tier 1 and 2
- 5.3.2 Tier 3
- 5.3.3 Tier 4
- 5.4 By Data Center Size
- 5.4.1 Small Data Center
- 5.4.2 Medium Data Center
- 5.4.3 Large Data Center
- 5.4.4 Hyperscale Data Center
- 5.5 By Data Center Type
- 5.5.1 Colocation Data Center
- 5.5.2 Hyperscalers Data Center/CSPs
- 5.5.3 Enterprise and Edge Data Center
- 5.6 By Rack Density (kW per Rack)
- 5.6.1 Up to 10 kW
- 5.6.2 10-20 kW
- 5.6.3 Above 20 kW
- 5.7 By Geography
- 5.7.1 North America
- 5.7.1.1 United States
- 5.7.1.2 Canada
- 5.7.1.3 Mexico
- 5.7.2 South America
- 5.7.2.1 Brazil
- 5.7.2.2 Argentina
- 5.7.2.3 Rest of South America
- 5.7.3 Europe
- 5.7.3.1 Germany
- 5.7.3.2 United Kingdom
- 5.7.3.3 France
- 5.7.3.4 Italy
- 5.7.3.5 Spain
- 5.7.3.6 Rest of Europe
- 5.7.4 Asia-Pacific
- 5.7.4.1 China
- 5.7.4.2 India
- 5.7.4.3 Japan
- 5.7.4.4 South Korea
- 5.7.4.5 Australia and New Zealand
- 5.7.4.6 Rest of Asia-Pacific
- 5.7.5 Middle East
- 5.7.5.1 Saudi Arabia
- 5.7.5.2 United Arab Emirates
- 5.7.5.3 Turkey
- 5.7.5.4 Rest of Middle East
- 5.7.6 Africa
- 5.7.6.1 South Africa
- 5.7.6.2 Nigeria
- 5.7.6.3 Egypt
- 5.7.6.4 Rest of Africa
- 5.7.1 North America
6 COMPETITIVE LANDSCAPE
- 6.1 Market Concentration
- 6.2 Strategic Moves
- 6.3 Market Share Analysis
- 6.4 Company Profiles (Includes Global Level Overview, Market Level Overview, Core Segments, Financials as Available, Strategic Information, Market Rank/Share, Products and Services, and Recent Developments)
- 6.4.1 ABB Ltd.
- 6.4.2 Schneider Electric SE
- 6.4.3 Vertiv Group Corp.
- 6.4.4 Eaton Corporation plc
- 6.4.5 Legrand SA
- 6.4.6 nVent Electric plc (Enlogic)
- 6.4.7 Rittal GmbH & Co. KG
- 6.4.8 Cyber Power Systems Inc.
- 6.4.9 Aten International Co. Ltd.
- 6.4.10 Conteg spol. s r.o.
- 6.4.11 Server Technology Inc.
- 6.4.12 Geist Global
- 6.4.13 Tripp Lite
- 6.4.14 Huawei Technologies Co., Ltd.
- 6.4.15 Panduit Corp.
- 6.4.16 PDU eXpert
- 6.4.17 The Siemon Company
- 6.4.18 Starline
- 6.4.19 Leviton Manufacturing Co., Inc.
7 MARKET OPPORTUNITIES AND FUTURE OUTLOOK
- 7.1 White-Space and Unmet-Need Assessment

 OCP機架市場規模、佔有率和趨勢分析報告:按組件、機架類型、冷卻技術、最終用途和細分市場預測(2026-2033年)
 中東資料中心機櫃:市場佔有率分析、產業趨勢與統計及成長預測(2026-2031)印度資料中心機櫃:市場佔有率分析、產業趨勢與統計及成長預測(2026-2032 年)德國資料中心機櫃:市場佔有率分析、產業趨勢與統計及成長預測(2026-2031 年)歐洲資料中心機櫃:市場佔有率分析、產業趨勢與統計及成長預測(2026-2031 年)法國資料中心機櫃:市場佔有率分析、產業趨勢與統計及成長預測(2026-2031 年)英國資料中心機櫃:市場佔有率分析、產業趨勢與統計及成長預測(2026-2031 年)西班牙資料中心機櫃:市場佔有率分析、產業趨勢與統計及成長預測(2026-2031 年)馬來西亞資料中心機櫃:市場佔有率分析、產業趨勢與統計及成長預測(2026-2031)
 資料中心機架市場-2026-2032年全球市場預測