


 |
市場調查報告書
商品編碼
2122760
物流自動化:市場佔有率分析、產業趨勢與統計、成長預測(2026-2031)Logistics Automation - Market Share Analysis, Industry Trends & Statistics, Growth Forecasts (2026 - 2031) |
||||||

※ 本網頁內容可能與最新版本有所差異。詳細情況請與我們聯繫。
根據 Mordor Intelligence 預測,物流自動化市場預計將從 2025 年的 816.5 億美元成長到 2026 年的 907.2 億美元,到 2031 年達到 1,327.4 億美元,2026 年至 2031 年的複合年預計成長率為 7.91%。
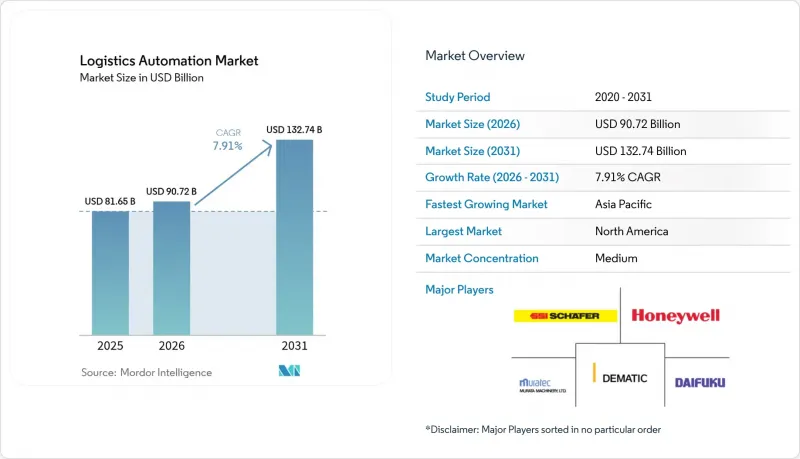
本報告按功能(倉儲自動化、運輸自動化)、自動化程度(全自動系統、半自動化系統)、組件(硬體、軟體、服務)、最終用戶行業(電子商務/小包裹、食品飲料、雜貨零售、服裝/時尚、製造業及其他)和地區進行細分。市場預測以美元計價。
全球物流自動化市場趨勢與洞察
電子商務小包裹量快速成長
小包裹量年增10%至1,210億件,消費者對當日送達的期望已根深蒂固。因此,零售商正在現有門市內設立1萬至2萬平方英尺的微型倉配中心,將最後一公里配送距離縮短高達60%。 Instacart與Fabric合作,在10萬個零售點部署自動化微型倉配中心,這表明食品零售商正在充分利用現有房地產,避免獨立「暗店」的高昂資本投入。設計重點正從“每小時托盤數”轉向“每平方英尺小包裹”,迫使供應商開發更高密度的存儲網格、更輕的機器人以及能夠最佳化垂直空間利用率的軟體。這正在形成一個良性循環:訂單密度的提升促使企業進一步投資自動化,進而縮短配送時間,提升競爭力。
勞動力短缺和薪資通膨日益加劇
儘管薪資上漲,製造業和物流業的勞動力短缺問題仍在加劇,預計2030年,美國將面臨高達380萬的勞動力缺口。即使亞馬遜在2024年將起薪提高到每小時22美元,季節性勞動力的供應仍無法滿足需求,這加速了機器人的應用。在日本,勞動年齡人口的下降導致每1萬名工人擁有399台機器人,迫使企業要麼加快自動化進程,要麼面臨產能極限。勞動力帶來的投資報酬率(ROI)提升顯著。自動化倉庫系統的投資回收期已從2020年的5年縮短至2025年的不到3年。自動化正從單純的成本削減手段轉變為在勞動力短缺市場維持產能的先決條件。
高初始資本投入
大規模自動化倉庫需要500萬至2500萬美元的初始資本投資,這項門檻迫使大多數中小型物流業者推遲採用全自動化系統。財務委員會經常要求三年或更短的投資回收期,尤其是在線上交易量趨於平穩以及多家食品零售商暫時中止大型專案的情況下。雖然「機器人即服務 (RaaS)」模式將資本支出 (CAPEX) 轉化為營運支出 (OPEX),但它會使生命週期成本增加20%至30%,從而限制了其在需求波動較大的地區的部署。因此,市場擴張傾向於一級第三方物流(3PL) 供應商,他們可以透過多個客戶合約攤提投資,這進一步擴大了大中小型企業之間的數位化差距。
細分市場分析
預計到2025年,倉儲自動化將佔全球物流自動化市場收入的56.82%,反映出該技術的成熟度和廣泛的部署經驗。在周轉率率高的情況下,立方體儲存系統、機械手臂揀選和高速分類機仍將是資本投資計畫的核心。同時,包括車隊管理平台和自動駕駛場內卡車在內的運輸自動化預計將以7.96%的複合年成長率實現最高成長,這反映出減少車輛閒置時間和實現排放氣體目標的緊迫性日益增強。在物流自動化市場,能夠提供跨倉庫和道路網路即時資產可視性的供應商仍然備受青睞,模糊了功能邊界,實現了端到端的最佳化。
隨著2026年軟體主導的貨物匹配技術的引入,承運商將能夠大幅降低空駛里程,這將進一步提升擁有高度自動化物流中心的托運人對運輸自動化的重視程度。隨著承運商投資於人工智慧驅動的路線重新設計,運輸編配領域的物流自動化市場預計將穩定成長。同時,倉庫業者正將預算從固定式輸送機轉向能夠根據需求靈活調整位置的自主移動機器人,這反映出他們越來越重視靈活的資本配置,而非僅僅提高尖峰時段處理能力。
至2025年,半自動化配置佔總支出的61.48%。這主要得益於人工仍參與部分流程的設施,例如處理異常情況和揀選易碎物品。然而,受組件成本下降和安全認證的人工智慧推理晶片的推動,預計到2031年,全自動系統的複合年成長率將達到7.99%。目前,全自動微型倉配中心每天僅需不到50名員工即可處理多達18,000份訂單,這充分證明了其在高訂單密度環境下的經濟效益。
營運商認知到,全自動佈局需要獨特的架構選擇,例如冗餘電源、預測分析和關鍵任務網路。雖然這會使資本支出 (CAPEX) 增加約 15-20%,但可以將意外停機時間限制在運作的 1% 以下。隨著認證瓶頸的逐步解除,預計全自動化系統在物流自動化市場中的佔有率將穩定成長。在製藥和電子等行業,這一趨勢尤其明顯,因為這些行業的高額投資是基於庫存價值和監管控制要求而進行的。
區域分析
北美地區人事費用高、電子商務滲透率高,且擁有成熟的第三方物流(3PL) 生態系統,允許將資本投資分散到多個合約中,預計到 2025 年,北美地區的銷售額將佔全球的 34.84%。美國營運商經常考察並實施新的自動化技術,儘管其人口規模小於亞太地區,但對供應商的產品藍圖有著顯著的影響。強大的創業投資進一步加速了產品改進,強化了該地區物流自動化市場創新的良性循環。
亞太地區是成長最快的區域,預計到2031年複合年成長率將達到8.11%。這主要得益於中國,中國計劃在2030年投資256億美元用於倉儲自動化。日本高密度的機器人部署、工業5G的積極推廣以及印度製造業走廊的大規模待開發區項目,都在推動這一持續成長。政府的物流現代化計劃將財政獎勵與私人投資相結合,擴大了主要城市和區域中心物流自動化市場的潛在規模。
歐洲佔了相當大的市場佔有率,在嚴格的勞動法和碳減排義務的雙重壓力下不斷發展。德國的「工業4.0」舉措正在將數位孿生和預測分析技術應用於倉庫設計,而英國的城市規劃改革則加速了微型倉配中心的建設。南美洲、中東和非洲雖然目前市場規模較小,但受惠於近岸外包、能源多元化和醫藥冷鏈發展等利多因素,隨著基礎建設差距的縮小,物流自動化市場擁有長期成長潛力。
其他好處
- Excel格式的市場預測(ME)表
- 3個月的分析師支持
目錄
第1章:引言
- 研究假設和市場定義
- 調查範圍
第2章:調查方法
第3章執行摘要
第4章 市場狀況
- 市場概覽
- 市場促進因素
- 電子商務小包裹量快速成長
- 勞動力短缺和薪資通膨日益加劇
- 企業關於淨零物流的舉措
- 關於免稅微型倉配區的法案
- 倉庫內5G和專用LTE的整合
- 開放原始碼機器人作業系統(ROS-2)的成熟
- 市場限制因素
- 高初始資本投入
- 與現有系統整合的複雜性
- 功能安全認證的人工智慧晶片供不應求
- OT網路網路安全保險費上漲
- 價值鏈分析
- 監理情勢
- 宏觀經濟因素對市場的影響
- 波特五力分析
第5章 市場規模與成長預測
- 按功能
- 倉庫自動化
- 按組件
- 硬體
- 移動機器人
- 自動化倉庫系統
- 自動分類系統
- 輸送機系統
- 自動識別資料收集(AIDC)
- 揀貨
- 軟體
- 服務
- 硬體
- 按組件
- 交通自動化
- 按組件
- 硬體
- 軟體
- 服務
- 按組件
- 倉庫自動化
- 按自動化級別
- 全自動系統
- 半自動系統
- 按組件
- 硬體
- 軟體
- 服務
- 按最終用戶行業分類
- 電子商務與小包裹
- 飲食
- 食品零售
- 服裝與時尚
- 製造業
- 其他
- 按地區
- 北美洲
- 美國
- 加拿大
- 墨西哥
- 南美洲
- 巴西
- 阿根廷
- 其他南美國家
- 歐洲
- 德國
- 英國
- 法國
- 義大利
- 西班牙
- 其他歐洲國家
- 亞太地區
- 中國
- 日本
- 印度
- 韓國
- ASEAN
- 其他亞太國家
- 中東
- 沙烏地阿拉伯
- 阿拉伯聯合大公國
- 其他中東國家
- 非洲
- 南非
- 奈及利亞
- 埃及
- 其他非洲地區
- 北美洲
第6章 競爭情勢
- 市場集中度
- 策略趨勢
- 市佔率分析
- 公司簡介
- Dematic Corp.(KION Group AG)
- Daifuku Co., Ltd.
- Honeywell International Inc.
- Jungheinrich AG
- Murata Machinery, Ltd.
- KNAPP AG
- TGW Logistics Group GmbH
- Kardex Holding AG
- Mecalux, SA
- BEUMER Group GmbH & Co. KG
- SSI SCHAFER AG
- Vanderlande Industries BV
- WITRON Logistik+Informatik GmbH
- Interroll Holding AG
- GreyOrange Pte Ltd.
- Locus Robotics Corp.
- Geek+Technology Co., Ltd.
- Ocado Group plc(Ocado Intelligent Automation)
- AutoStore Holdings Ltd.
- Exotec SAS
- Fetch Robotics Inc.(Zebra Technologies)
- Korber Supply Chain GmbH
- Cimcorp Oy
- Manhattan Associates Inc.
- Swisslog Holding AG
- Siemens Logistics GmbH
- Bastian Solutions LLC
- Fives Group
- Hai Robotics Co., Ltd.
第7章 市場機會與未來展望
According to Mordor Intelligence, the logistics automation market size is expected to increase from USD 81.65 billion in 2025 to USD 90.72 billion in 2026 and reach USD 132.74 billion by 2031, growing at a CAGR of 7.91% over 2026-2031.
This report is Segmented by Function (Warehouse Automation and Transportation Automation), Automation Level (Fully-Automated Systems and Semi-Automated Systems), Component (Hardware, Software, and Services), End-User Industry (E-Commerce and Parcel, Food and Beverage, Grocery Retail, Apparel and Fashion, Manufacturing, and More), and Geography. The Market Forecasts are Provided in Terms of Value (USD).
Global Logistics Automation Market Trends and Insights
Rapid E-commerce Parcel Volumes
Parcel flows climbed 10% year over year to 121 billion shipments in 2025, locking in consumer expectations for same-day fulfillment. Retailers are therefore embedding 10,000-20,000 square-foot micro-fulfillment nodes inside existing stores, cutting last-mile distances by as much as 60%. Instacart's partnership with Fabric to deploy automated micro-fulfillment nodes across 100,000 retail locations illustrates how grocers are leveraging existing real estate to bypass the capital intensity of standalone dark stores. Design focus is shifting from pallets per hour to parcels per square foot, forcing vendors to engineer denser storage grids, lighter robots, and software that optimizes vertical cube utilization. The result is a virtuous cycle, higher order density justifies incremental automation spend, which further compresses delivery windows and raises the competitive bar.
Rising Labor Shortages and Wage Inflation
Manufacturing and logistics vacancies are widening despite wage gains, with U.S. shortfalls projected to reach up to 3.8 million workers by 2030. Even after Amazon lifted entry wages to USD 22 per hour in 2024, seasonal hiring lagged demand, driving accelerated robot rollouts. In Japan, a declining working-age population pushes robot density to 399 units per 10,000 workers, compelling operators to automate or face throughput caps. Labor-driven ROI improvements are material: payback on automated storage and retrieval systems tightened from five years in 2020 to fewer than three years in 2025. Automation has moved from a cost-reduction lever to a precondition for sustaining throughput in tight labor markets.
High Up-Front CAPEX
Large automated warehouses require USD 5 million to USD 25 million in upfront capital expenditure, a threshold that excludes most small and mid-sized logistics operators from deploying fully automated systems. Finance committees frequently insist on sub-three-year payback, especially after several grocery retailers paused large projects when online volumes plateaued. Robotics-as-a-service models convert capex to opex but add 20-30% to lifetime cost, limiting uptake to sites with volatile demand. Consequently, market expansion skews toward tier-one 3PLs that can amortize investments across multiple client contracts, exacerbating a digital divide between large and small operators.
Other drivers and restraints analyzed in the detailed report include:
- Corporate Net-Zero Logistics Commitments
- Convergence of 5G and Private-LTE Inside Warehouses
- Integration Complexity with Brown-Field IT
For complete list of drivers and restraints, kindly check the Table Of Contents.
Segment Analysis
Warehouse automation anchored 56.82% of global Logistics automation market revenue in 2025, underscoring its maturity and deep installed base. Cube-based storage, robotic picking arms, and high-speed sorters continue to dominate capex plans in high-SKU-velocity environments. Yet transportation automation, including fleet-management platforms and autonomous yard trucks, records the fastest forecast CAGR at 7.96%, reflecting heightened urgency to shrink empty-mile ratios and hit emission targets. The Logistics automation market continues to reward vendors that deliver real-time asset visibility across warehouse and road networks, blurring functional boundaries and enabling end-to-end optimization.
Software-driven load-matching launched in 2026 allows carriers to slash empty miles by double-digit percentages, pushing transportation automation up the priority list even among shippers with highly automated distribution centers. The Logistics automation market for transportation orchestration is set to grow steadily as carriers invest in AI-enabled route redesign. In parallel, warehouse operators are reallocating budgets from fixed conveyors to autonomous mobile robots that can shift with demand, reflecting growing preference for flexible capital deployment over peak-capacity builds.
Semi-automated configurations accounted for 61.48% of 2025 spending, driven by facilities that keep humans in the loop for exception handling and fragile picks. However, fully automated systems are projected to post a 7.99% CAGR through 2031, driven by shrinking component costs and the arrival of safety-certified AI inference chips. Fully robotized micro-fulfillment centers already process up to 18,000 daily orders with fewer than 50 staff, proving the economic case where order density is high.
Operators recognize that fully-automated layouts require distinct architectural choices-redundant power, predictive analytics, and mission-critical networking-that raise capex by roughly 15-20% yet cut unplanned downtime below 1% of operating hours. As certification bottlenecks ease, the Logistics automation market share of fully-automated systems is expected to climb steadily, particularly in pharmaceuticals and electronics, where inventory value and regulatory controls justify premium investments.
Complete Report Scope:
- By Function
- Warehouse Automation
- By Component
- Hardware
- Mobile Robots
- Automated Storage and Retrieval Systems
- Automated Sorting Systems
- Conveyor Systems
- Automatic Identification and Data Collection (AIDC)
- Order Picking
- Software
- Services
- Hardware
- By Component
- Transportation Automation
- By Component
- Hardware
- Software
- Services
- By Component
- Warehouse Automation
- By Automation Level
- Fully-Automated Systems
- Semi-Automated Systems
- By Component
- Hardware
- Software
- Services
- By End-User Industry
- E-commerce and Parcel
- Food and Beverage
- Grocery Retail
- Apparel and Fashion
- Manufacturing
- Other End-User Industries
- By Geography
- North America
- United States
- Canada
- Mexico
- South America
- Brazil
- Argentina
- Rest of South America
- Europe
- Germany
- United Kingdom
- France
- Italy
- Spain
- Rest of Europe
- Asia-Pacific
- China
- Japan
- India
- South Korea
- ASEAN
- Rest of Asia-Pacific
- Middle East
- Saudi Arabia
- United Arab Emirates
- Rest of Middle East
- Africa
- South Africa
- Nigeria
- Egypt
- Rest of Africa
- North America
Geography Analysis
North America retained 34.84% of 2025 revenue, supported by high labor costs, deep e-commerce penetration, and a mature third-party logistics ecosystem that enables capex to be spread across multiple contracts. U.S. operators frequently pilot new automation technologies, giving the region an outsized influence on vendor roadmaps despite its smaller population than the Asia-Pacific. Strong venture-capital funding further accelerates product iteration, reinforcing the Logistics automation market's innovation flywheel in the region.
Asia-Pacific is the fastest-growing territory, posting an 8.11% CAGR through 2031 as China alone targets USD 25.6 billion in warehouse automation spend by 2030. High robot density in Japan, aggressive rollout of industrial 5G, and large-scale greenfield projects in India's manufacturing corridors collectively drive sustained growth. Government logistics modernization programs align fiscal incentives with private investment, multiplying the addressable Logistics automation market across tier-one and tier-two cities.
Europe, with a considerable market share, advances under the twin pressures of strict labor laws and carbon-reduction mandates. Germany's Industry 4.0 initiative mainstreams digital twins and predictive analytics in warehouse design, while the United Kingdom's urban zoning reforms encourage micro-fulfillment buildouts. South America, the Middle East and Africa are smaller today but enjoy tailwinds from near-shoring, energy diversification, and pharmaceutical cold-chain development, creating long-run upside for the Logistics automation market as infrastructure gaps close.
- Dematic Corp. (KION Group AG)
- Daifuku Co., Ltd.
- Honeywell International Inc.
- Jungheinrich AG
- Murata Machinery, Ltd.
- KNAPP AG
- TGW Logistics Group GmbH
- Kardex Holding AG
- Mecalux, S.A.
- BEUMER Group GmbH & Co. KG
- SSI SCHAFER AG
- Vanderlande Industries B.V.
- WITRON Logistik + Informatik GmbH
- Interroll Holding AG
- GreyOrange Pte Ltd.
- Locus Robotics Corp.
- Geek+ Technology Co., Ltd.
- Ocado Group plc (Ocado Intelligent Automation)
- AutoStore Holdings Ltd.
- Exotec SAS
- Fetch Robotics Inc. (Zebra Technologies)
- Korber Supply Chain GmbH
- Cimcorp Oy
- Manhattan Associates Inc.
- Swisslog Holding AG
- Siemens Logistics GmbH
- Bastian Solutions LLC
- Fives Group
- Hai Robotics Co., Ltd.
Additional Benefits:
- The market estimate (ME) sheet in Excel format
- 3 months of analyst support
TABLE OF CONTENTS
1 INTRODUCTION
- 1.1 Study Assumptions and Market Definition
- 1.2 Scope of the Study
2 RESEARCH METHODOLOGY
3 EXECUTIVE SUMMARY
4 MARKET LANDSCAPE
- 4.1 Market Overview
- 4.2 Market Drivers
- 4.2.1 Rapid E-commerce Parcel Volumes
- 4.2.2 Rising Labor Shortages and Wage Inflation
- 4.2.3 Corporate Net-Zero Logistics Commitments
- 4.2.4 Customs-Free Micro-Fulfilment Zoning Laws
- 4.2.5 Convergence of 5G and Private-LTE Inside Warehouses
- 4.2.6 Open-Source Robotics Operating Systems (ROS-2) Maturation
- 4.3 Market Restraints
- 4.3.1 High Up-Front CAPEX
- 4.3.2 Integration Complexity with Brown-Field IT
- 4.3.3 Scarcity of Functional-Safety-Certified AI Chips
- 4.3.4 Rising Cyber-Insurance Premiums for OT Networks
- 4.4 Value Chain Analysis
- 4.5 Regulatory Landscape
- 4.6 Impact of Macroeconomic Factors on the Market
- 4.7 Porter's Five Forces Analysis
- 4.7.1 Bargaining Power of Suppliers
- 4.7.2 Bargaining Power of Buyers
- 4.7.3 Threat of New Entrants
- 4.7.4 Threat of Substitutes
- 4.7.5 Competitive Rivalry
5 MARKET SIZE AND GROWTH FORECASTS (VALUE)
- 5.1 By Function
- 5.1.1 Warehouse Automation
- 5.1.1.1 By Component
- 5.1.1.1.1 Hardware
- 5.1.1.1.1.1 Mobile Robots
- 5.1.1.1.1.2 Automated Storage and Retrieval Systems
- 5.1.1.1.1.3 Automated Sorting Systems
- 5.1.1.1.1.4 Conveyor Systems
- 5.1.1.1.1.5 Automatic Identification and Data Collection (AIDC)
- 5.1.1.1.1.6 Order Picking
- 5.1.1.1.2 Software
- 5.1.1.1.3 Services
- 5.1.1.1.1 Hardware
- 5.1.1.1 By Component
- 5.1.2 Transportation Automation
- 5.1.2.1 By Component
- 5.1.2.1.1 Hardware
- 5.1.2.1.2 Software
- 5.1.2.1.3 Services
- 5.1.2.1 By Component
- 5.1.1 Warehouse Automation
- 5.2 By Automation Level
- 5.2.1 Fully-Automated Systems
- 5.2.2 Semi-Automated Systems
- 5.3 By Component
- 5.3.1 Hardware
- 5.3.2 Software
- 5.3.3 Services
- 5.4 By End-User Industry
- 5.4.1 E-commerce and Parcel
- 5.4.2 Food and Beverage
- 5.4.3 Grocery Retail
- 5.4.4 Apparel and Fashion
- 5.4.5 Manufacturing
- 5.4.6 Other End-User Industries
- 5.5 By Geography
- 5.5.1 North America
- 5.5.1.1 United States
- 5.5.1.2 Canada
- 5.5.1.3 Mexico
- 5.5.2 South America
- 5.5.2.1 Brazil
- 5.5.2.2 Argentina
- 5.5.2.3 Rest of South America
- 5.5.3 Europe
- 5.5.3.1 Germany
- 5.5.3.2 United Kingdom
- 5.5.3.3 France
- 5.5.3.4 Italy
- 5.5.3.5 Spain
- 5.5.3.6 Rest of Europe
- 5.5.4 Asia-Pacific
- 5.5.4.1 China
- 5.5.4.2 Japan
- 5.5.4.3 India
- 5.5.4.4 South Korea
- 5.5.4.5 ASEAN
- 5.5.4.6 Rest of Asia-Pacific
- 5.5.5 Middle East
- 5.5.5.1 Saudi Arabia
- 5.5.5.2 United Arab Emirates
- 5.5.5.3 Rest of Middle East
- 5.5.6 Africa
- 5.5.6.1 South Africa
- 5.5.6.2 Nigeria
- 5.5.6.3 Egypt
- 5.5.6.4 Rest of Africa
- 5.5.1 North America
6 COMPETITIVE LANDSCAPE
- 6.1 Market Concentration
- 6.2 Strategic Moves
- 6.3 Market Share Analysis
- 6.4 Company Profiles (includes Global Level Overview, Market Level Overview, Core Segments, Financials as available, Strategic Information, Market Rank/Share, Products and Services, Recent Developments)
- 6.4.1 Dematic Corp. (KION Group AG)
- 6.4.2 Daifuku Co., Ltd.
- 6.4.3 Honeywell International Inc.
- 6.4.4 Jungheinrich AG
- 6.4.5 Murata Machinery, Ltd.
- 6.4.6 KNAPP AG
- 6.4.7 TGW Logistics Group GmbH
- 6.4.8 Kardex Holding AG
- 6.4.9 Mecalux, S.A.
- 6.4.10 BEUMER Group GmbH & Co. KG
- 6.4.11 SSI SCHAFER AG
- 6.4.12 Vanderlande Industries B.V.
- 6.4.13 WITRON Logistik + Informatik GmbH
- 6.4.14 Interroll Holding AG
- 6.4.15 GreyOrange Pte Ltd.
- 6.4.16 Locus Robotics Corp.
- 6.4.17 Geek+ Technology Co., Ltd.
- 6.4.18 Ocado Group plc (Ocado Intelligent Automation)
- 6.4.19 AutoStore Holdings Ltd.
- 6.4.20 Exotec SAS
- 6.4.21 Fetch Robotics Inc. (Zebra Technologies)
- 6.4.22 Korber Supply Chain GmbH
- 6.4.23 Cimcorp Oy
- 6.4.24 Manhattan Associates Inc.
- 6.4.25 Swisslog Holding AG
- 6.4.26 Siemens Logistics GmbH
- 6.4.27 Bastian Solutions LLC
- 6.4.28 Fives Group
- 6.4.29 Hai Robotics Co., Ltd.
7 MARKET OPPORTUNITIES AND FUTURE OUTLOOK
- 7.1 White-Space and Unmet-Need Assessment

 2026年全球物流自動化人工智慧(AI)市場報告
 歐洲物流自動化:市場佔有率分析、產業趨勢與統計及成長預測(2026-2031 年)貨櫃堆場物流:市場佔有率分析、產業趨勢與統計、成長預測(2026-2031)亞太地區貨櫃堆場物流:市場佔有率分析、產業趨勢與統計及成長預測(2026-2031)歐洲貨櫃堆場物流:市場佔有率分析、產業趨勢與統計及成長預測(2026-2031)美國貨櫃堆場物流:市場佔有率分析、產業趨勢與統計及成長預測(2026-2031 年)
 物流自動化市場預測至2034年-按組件、功能、技術、應用、最終用戶和地區分類的全球分析
 物流自動化市場:按組件、物流類型、技術、運作模式、部署類型、應用和最終用戶產業分類-2026-2032年全球市場預測北美物流自動化:市場佔有率分析、產業趨勢與統計及成長預測(2026-2031 年)
 物流自動化市場機會、成長要素、產業趨勢分析及2026-2035年預測