


 |
市場調查報告書
商品編碼
2120687
海運貨櫃:市場佔有率分析、產業趨勢與統計、成長預測(2026-2031)Shipping Containers - Market Share Analysis, Industry Trends & Statistics, Growth Forecasts (2026 - 2031) |
||||||

※ 本網頁內容可能與最新版本有所差異。詳細情況請與我們聯繫。
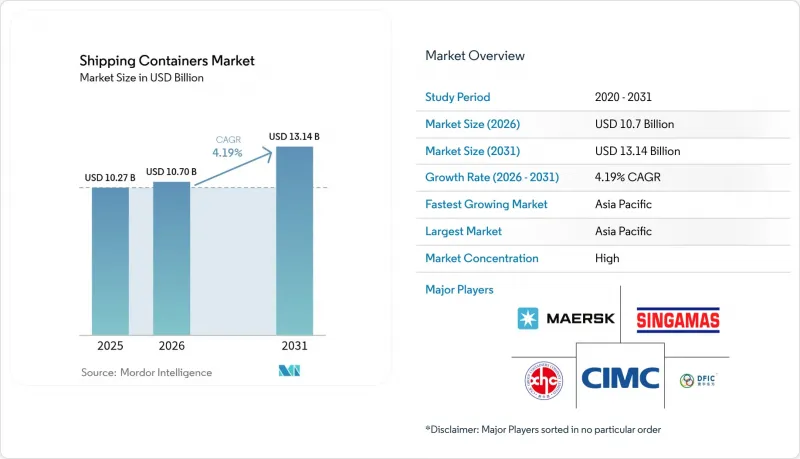
據估計,到 2026 年,海運貨櫃市場規模將達到 107 億美元,高於 2025 年的 102.7 億美元,預計到 2031 年將達到 131.4 億美元。
預計從 2026 年到 2031 年,其複合年成長率將達到 4.19%。
本報告按尺寸(20英尺標準箱 (TEU)、40英尺大箱 (FEU) 等)、貨櫃類型(乾貨集裝箱(標準)、冷藏貨櫃等)、材質(耐候鋼、不銹鋼等)、最終用途行業(消費品、零售等)、運輸方式(遠洋運輸等)和地區(北美、南美等)進行分類。市場預測以美元 (USD) 為單位。
全球海運貨櫃市場趨勢及洞察
跨境電商的爆炸性成長使得消費者期望24小時內送達。
電子商務的蓬勃發展帶動了小批量、高頻次貨運的成長,使得焦點從船舶裝載能力轉向港口處理速度。航運公司在高頻環線航線上增派船舶,而港口則投資建造自動化起重機,以便在一個班次內完成船舶的裝卸作業。智慧追蹤系統使托運人能夠在貨物抵達前完成清關並預訂鐵路運輸時段。這些營運效率的提升縮短了庫存週期,提高了標準乾貨貨櫃的受歡迎程度,即使在貿易量波動的情況下也能保持較高的運轉率。隨著線上市場滲透到新興經濟體,貨櫃市場在各種貿易路線上都展現出持續的潛在需求。
全球冷鏈的擴張正在加速對先進冷藏貨櫃的訂單。
製藥公司正將長途運輸從空運轉向海運,以降低成本和排放,同時確保溫度控制。現代冷藏貨櫃的溫度精度可達±0.5°C,並整合遙測功能,可提供即時偏差通知,從而在運輸過程中採取糾正措施。生鮮食品出口商也採用類似技術,在最大限度減少食品變質的同時,將貨物運送至遠距離消費者手中。提供雙燃料冷卻裝置的製造商透過降低能耗並滿足低全球暖化潛勢(GWP)法規的要求,從而提高了每個貨櫃的價格。隨著食品電子商務拓展至新市場,對先進冷藏貨櫃的需求持續成長,超過了普通貨物的成長速度。
疫情後貨櫃供應過剩,降低了運轉率。
2021年至2023年間,新貨櫃的建造數量創下歷史新高,導致暫時的供應過剩,租賃價格走低,迫使業者推遲新訂單。隨著貿易放緩,閒置庫存積壓在門戶港口,迫使堆場降低倉儲費以確保重新部署業務。製造商正透過減少生產班次並將產能轉移到需求穩定的專業產品上來應對這一局面。隨著老舊貨櫃船隊的退役和貿易的正常化,預計這一調整階段將得到解決。
細分市場分析
由於高立方貨櫃的餘量比普通貨櫃高出13%,因此需求日益成長,這最大限度地提高了電商小包裹和輕型家用電器等大件貨物的負載容量。預計到2025年,40英尺貨櫃的銷量將佔總銷量的52.21%,這表明其在海運領域持續受到歡迎;而40英尺高立方貨櫃預計到2031年將以5.43%的複合年成長率成長。高立方貨櫃的市場規模反映了托運人尋求更大裝載能力但又不超出重量限制的趨勢。
港口基礎設施的改善使得貨櫃堆疊高度得以提升,碼頭營運商正在部署提升高度更高的正面吊運機,以高效處理這些貨櫃。物流整合商正在推廣40英尺貨櫃的標準化,以簡化鐵路貨運分配和堆場間的轉運。 Triton Containers公司透過提供高立方貨櫃租賃服務和靈活的提貨選擇,減少貨櫃的重新部署,從而促進了高立方貨櫃的普及。總體而言,托運人對容積效率和包裝整合的關注,正在推動高立方貨櫃在主要貿易走廊的持續普及。
至2025年,乾貨貨櫃將佔總貨運量的72.32%,凸顯其作為全球商品分銷基石的地位。相較之下,隨著生鮮食品出口商和製藥企業拓展海運航線,預計到2031年,冷藏貨櫃的複合年成長率將達到6.18%。目前,冷藏貨櫃佔據貨櫃市場的高階領域,其租金是乾貨貨櫃的兩到三倍。
技術改進包括採用變速壓縮機和太陽能輔助模組,以降低待機時的能耗。藥品托運商要求溫度探頭和門感測器具備冗餘功能,並且能夠在溫度偏差發生時立即發出警報,這促使製造商之間形成差異化競爭。此外,冷藏貨櫃也受益於脫碳化,因為將對溫度敏感的貨物從空運轉移到海運可以減少高達 80% 的相關排放。
區域分析
亞太地區是貨櫃市場的主要驅動力,預計2025年將佔全球銷售量的59.88%,並有望在2031年之前以5.46%的複合年成長率持續成長。儘管中國保持著製造業的主導,但隨著企業採購多元化,東南亞地區的貨運量也不斷成長。馬來西亞和印度的巨型港口計畫每年新增超過2500萬個標準箱的吞吐能力,不僅支撐了區域貨運量,也刺激了支線網路的貨櫃需求。在貨幣穩定和貿易協定的支持下,區域租賃公司正在擴大其船隊規模。
北美正受益於近岸外包,這種模式將電子產品和汽車的組裝轉移到更靠近消費市場的地方。美國港口當局已批准數十億美元的疏浚和泊位電氣化項目,提高了相對於墨西哥和加拿大港口的競爭力。中西部地區多式聯運鐵路網路的建設,在不到八天的時間內,打造了連接大西洋和太平洋流域的經濟高效的陸路運輸路線,從而促進了與集裝箱堆垛列車兼容的集裝箱設計的應用。
由於地緣政治緊張局勢導致亞歐航線繞道非洲,運輸時間延長,歐洲貨櫃市場成長不平衡;同時,地中海樞紐港口的停靠量增加也加劇了這一局面。倫敦門戶港和鹿特丹馬斯弗拉克特港的自動化投資提高了每小時起重機的作業能力,緩解了貨櫃成本指標的惡化。嚴格的環保法規加速了老舊重型貨櫃的淘汰,並推動了再生鋼貨櫃的普及,儘管貿易量成長放緩,但仍支撐了更換需求。
其他好處:
- Excel格式的市場預測(ME)表
- 3個月的分析師支持
目錄
第1章:引言
- 研究假設和市場定義
- 調查範圍
第2章:調查方法
第3章執行摘要
第4章 市場狀況
- 市場概覽
- 市場促進因素
- 跨境電子商務的爆炸性成長導致人們對標準乾貨貨櫃的交付時間期望在 24 小時內完成。
- 冷鏈在全球生鮮食品和食材自煮包配送的應用日益廣泛,加速了對先進冷藏貨櫃的訂單。
- 直接面對消費者 (D2C) 的品牌對客製化的、帶有品牌標識的容器的需求不斷成長,這些容器還可以用作行動快閃店和履約中心。
- 由於該公司的 ESG 政策,托運人正面臨壓力,需要從一次性托盤包裝膜轉向可重複使用的多模態貨櫃,這推動了對貨櫃更換的需求增加。
- 物聯網賦能的「智慧箱」的推出,能夠提供即時位置和狀態數據,提高了托運人購買高階貨櫃的意願。
- 訂閱式和模組化住宅理念正在加速舊貨櫃的再利用,賦予其第二次生命。
- 市場限制因素
- 疫情後貨櫃供應過剩,導致運轉率下降,新建設投資減少。
- 熱軋鋼捲價格的波動使得貨櫃買家的預算預測變得不確定。
- 涵蓋從製造到處置整個產品生命週期的更嚴格的法規,以及擴大生產者責任(EPR)規則,正在推高整個產品生命週期的擁有成本。
- 折疊式和可擴展的替代容器正在迅速湧現,蠶食著人們對傳統硬包裝盒的需求。
- 價值供應鏈分析
- 監管和技術展望
- 波特五力模型
- 價格分析-標準容器與特殊容器的比較
- 註:多式聯運和鐵路運輸的使用增加
- 全球貨櫃租賃市場概覽
- 地緣政治事件對市場的影響
第5章 市場規模與成長預測
- 尺寸
- 20英尺(標準貨櫃)
- 40 英尺(FEU)
- 40英尺高的立方體
- 其他(超過 45 英尺等)
- 按容器類型
- 乾式儲存(標準)
- 冷藏貨櫃(冷藏箱)
- 儲罐(ISO儲罐,用於低溫環境)
- 平板架和開放式頂部
- 特殊應用(側門、隧道式、保溫式、折疊式式)
- 材料
- 耐候鋼
- 不銹鋼
- 鋁合金
- FRP和複合材料
- 其他
- 按最終用途行業分類
- 消費品和零售
- 食品/飲料
- 工業機械和汽車
- 化工/石油
- 藥品和醫療保健
- 其他
- 透過運輸方式
- 在海上(公海)
- 近海/沿海運輸
- 鐵路和多式聯運
- 內陸陸路運輸和異地存儲
- 按地區
- 北美洲
- 美國
- 加拿大
- 墨西哥
- 南美洲
- 巴西
- 秘魯
- 智利
- 阿根廷
- 其他南美國家
- 亞太地區
- 中國
- 印度
- 日本
- 澳洲
- 韓國
- 東南亞(新加坡、馬來西亞、泰國、印尼、越南、菲律賓)
- 其他亞太國家
- 歐洲
- 英國
- 德國
- 法國
- 西班牙
- 義大利
- 比荷盧經濟聯盟(比利時、荷蘭、盧森堡)
- 北歐國家(丹麥、芬蘭、冰島、挪威、瑞典)
- 其他歐洲國家
- 中東和非洲
- 阿拉伯聯合大公國
- 沙烏地阿拉伯
- 南非
- 奈及利亞
- 其他中東和非洲國家
- 北美洲
第6章 競爭情勢
- 市場集中度
- 策略性措施(併購、擴大產能、租賃協議)
- 市佔率分析
- 公司簡介
- China International Marine Containers(CIMC)
- Dong Fang International Containers
- CXIC Group(CSSC)
- Maersk Container Industry A/S
- Singamas Container Holdings
- W&K Container
- Sea Box Inc.
- TLS Offshore Containers
- Storstac Inc.
- CARU Containers BV
- China Eastern Containers
- Valisons & Co.
- YMC Container Solutions
- American Intermodal Container Manufacturing
- Triton International
- Textainer Group Holdings
- Florens Container Services
- CAI International
- Touax Group
- UES International
第7章 市場機會與未來展望
According to Mordor Intelligence, shipping containers market size in 2026 is estimated at USD 10.7 billion, growing from 2025 value of USD 10.27 billion with 2031 projections showing USD 13.14 billion, growing at 4.19% CAGR over 2026-2031.
This report is Segmented by Size (20-Ft (TEU), 40-Ft (FEU) and More), by Container Type (Dry Storage (Standard), Refrigerated, and More), by Material (Corten Steel, Stainless Steel and More), End-Use Industry (Consumer Goods & Retail and More), by Mode of Transport (Maritime Deep-Sea and More), by Geography (North America, South America, and More). The Market Forecasts are Provided in Terms of Value (USD).
Global Shipping Containers Market Trends and Insights
Explosive Growth of Cross-Border E-Commerce Creating 24-Hour Turnaround Expectations
E-commerce expansion drives more frequent, smaller shipments, shifting focus from vessel capacity toward port velocity. Carriers commit additional equipment to high-frequency loops, while ports invest in automated cranes that clear vessels inside one shift. Smart tracking allows shippers to pre-clear customs and book rail slots before docking. These operational gains shorten inventory cycles and reinforce preference for standard dry boxes, keeping utilization high even when trade volumes fluctuate. As online marketplaces penetrate emerging economies, the shipping container market sees sustained baseline demand across diverse trade lanes.
Worldwide Cold-Chain Penetration Accelerates Advanced Reefer Orders
Pharmaceutical producers are migrating long-haul shipments from air to ocean to cut costs and emissions without compromising temperature control. Modern reefers maintain +-0.5 °C accuracy and integrate telemetry that flags deviations in real time, allowing corrective actions mid-voyage. Fresh grocery exporters adopt similar technology to reach distant consumers with minimal spoilage. Manufacturers offering dual-fuel refrigeration units reduce energy consumption and meet low-GWP regulations, enabling higher price realisation per box. As grocery e-commerce extends to new markets, advanced reefer demand continues to outpace general cargo growth.
Post-Pandemic Oversupply of Boxes Eroding Utilization Rates
Record new builds made during 2021-2023 create a temporary surplus, pushing lease rates down and prompting operators to delay fresh orders. Idle inventories accumulate in gateway ports when trade softens, forcing depots to lower storage fees to attract repositioning business. Manufacturers adapt by trimming production shifts and redirecting capacity toward specialized designs with steadier demand. The correction is expected to resolve once scrappage catches up with ageing fleets and trade normalizes.
Other drivers and restraints analyzed in the detailed report include:
- Direct-to-Consumer Brands Demanding Bespoke, Logo-Printed Containers
- Corporate ESG Mandates Pushing Reusable Container Adoption
- Volatility in Hot-Rolled Coil Steel Prices Creating Budget Uncertainty
For complete list of drivers and restraints, kindly check the Table Of Contents.
Segment Analysis
High-cube offerings are capturing incremental demand because their 13% extra headroom maximizes volumetric loads such as e-commerce parcels and lightweight consumer electronics. 40-ft formats generated 52.21% revenue in 2025, demonstrating entrenched popularity for ocean freight, whereas 40-ft high-cube units are forecast to grow at 5.43% CAGR to 2031. The shipping container market size for high-cube units reflects shipper preference for greater capacity without breaching weight restrictions.
Port infrastructure upgrades accommodate taller stacks, and terminal operators add reach-stackers with extended lifting heights to handle these units efficiently. Logistics integrators promote standardization on the 40-ft profile to streamline rail wagon allocation and depot interchange. Triton Containers markets high-cube leases with flexible pick-up options to reduce repositioning, reinforcing adoption. Overall, shipper focus on cubic efficiency and consolidation of packaging drives continued high-cube traction across primary trade corridors.
Dry storage boxes accounted for 72.32% of 2025 shipments, underscoring their status as the backbone of global commodity flows. In contrast, reefer units record a 6.18% CAGR to 2031 as fresh produce exporters and drug makers scale ocean routes. Refrigerated boxes currently represent the premium slice of the shipping container market, commanding rental rates two to three times higher than dry units.
Technology upgrades include variable-speed compressors and solar-assisted power modules that cut energy draw during idle periods. Pharmaceutical shippers require redundant temperature probes and door sensors that trigger alerts within seconds of deviation, driving differentiation among manufacturers. Reefers also benefit from decarbonization, as shifting temperature-sensitive goods from air to sea avoids up to 80% of related emissions.
Complete Report Scope:
- By Size
- 20-ft (TEU)
- 40-ft (FEU)
- 40-ft High-Cube,
- Others ( >45-ft, etc)
- By Container Type
- Dry Storage (Standard)
- Refrigerated (Reefer)
- Tank (ISO Tank, Cryogenic)
- Flat-Rack & Open-Top
- Special Purpose (Side-Door, Tunnel, Insulated, Collapsible)
- By Material
- Corten Steel
- Stainless Steel
- Aluminium Alloy
- FRP & Composite
- Others
- By End-Use Industry
- Consumer Goods & Retail
- Food & Beverage
- Industrial Machinery & Automotive
- Chemicals & Petroleum
- Pharmaceuticals & Healthcare
- Others
- By Mode of Transport
- Maritime Deep-Sea
- Short-Sea & Coastal
- Rail Intermodal
- Road Inland Haulage & Off-Site Storage
- By Geography
- North America
- United States
- Canada
- Mexico
- South America
- Brazil
- Peru
- Chile
- Argentina
- Rest of South America
- Asia-Pacific
- China
- India
- Japan
- Australia
- South Korea
- South East Asia (Singapore, Malaysia, Thailand, Indonesia, Vietnam, and Philippines)
- Rest of Asia-Pacific
- Europe
- United Kingdom
- Germany
- France
- Spain
- Italy
- BENELUX (Belgium, Netherlands, and Luxembourg)
- NORDICS (Denmark, Finland, Iceland, Norway, and Sweden)
- Rest of Europe
- Middle East And Africa
- United Arab Emirates
- Saudi Arabia
- South Africa
- Nigeria
- Rest of Middle East And Africa
- North America
Geography Analysis
Asia-Pacific dominated the shipping containers market with 59.88% revenue in 2025 and is set to grow at a 5.46% CAGR to 2031. China retains manufacturing leadership, yet Southeast Asia captures incremental volumes as firms diversify sourcing. Malaysian and Indian mega-port projects add more than 25 million TEU of annual capacity, anchoring regional throughput and stimulating container demand across feeder networks. Currency stability and supportive trade agreements also encourage regional leasing pools to expand their fleets.
North America benefits from nearshoring that shifts electronics and automotive assembly closer to consumption markets. United States port authorities approve multi-billion-dollar dredging and berth electrification programs, enhancing competitiveness against Mexican and Canadian gateways. The rail intermodal build-out across the Midwest unlocks cost-effective land bridges that connect Atlantic and Pacific basins in under eight days, driving uptake of stack-train compatible container designs.
Europe records mixed growth shipping container market as geopolitical tensions divert Asia-Europe sailings around Africa, extending transit times but also directing additional calls to Mediterranean hubs. Investments in automation at London Gateway and Rotterdam Maasvlakte raise throughput per crane hour, cushioning cost-per-box metrics. Stringent environmental regulations accelerate the retirement of older, heavier boxes in favor of recycled-content steel units, supporting replacement demand despite subdued trade volume growth.
- China International Marine Containers (CIMC)
- Dong Fang International Containers
- CXIC Group (CSSC)
- Maersk Container Industry A/S
- Singamas Container Holdings
- W&K Container
- Sea Box Inc.
- TLS Offshore Containers
- Storstac Inc.
- CARU Containers B.V.
- China Eastern Containers
- Valisons & Co.
- YMC Container Solutions
- American Intermodal Container Manufacturing
- Triton International
- Textainer Group Holdings
- Florens Container Services
- CAI International
- Touax Group
- UES International
Additional Benefits:
- The market estimate (ME) sheet in Excel format
- 3 months of analyst support
TABLE OF CONTENTS
1 Introduction
- 1.1 Study Assumptions & Market Definition
- 1.2 Scope of the Study
2 Research Methodology
3 Executive Summary
4 Market Landscape
- 4.1 Market Overview
- 4.2 Market Drivers
- 4.2.1 Explosive growth of cross-border e-commerce creating 24-hour turnaround expectations for standard dry containers.
- 4.2.2 Worldwide cold-chain penetration of fresh grocery and meal-kit delivery accelerating orders for advanced reefer boxes.
- 4.2.3 Direct-to-consumer (D2C) brands demanding bespoke, logo-printed containers to double as mobile pop-up stores and fulfilment hubs.
- 4.2.4 Corporate ESG mandates pushing shippers toward reusable, multimodal containers over single-use pallet wrap, lifting replacement demand.
- 4.2.5 Adoption of IoT-enabled -smart- boxes providing real-time location & condition data, raising shipper's willingness to pay for premium units.
- 4.2.6 Subscription-based and modular housing concepts spurring second-life conversions of retired shipping containers.
- 4.3 Market Restraints
- 4.3.1 Post-pandemic oversupply of boxes eroding utilisation rates and discouraging new-build investment.
- 4.3.2 Volatility in hot-rolled coil steel prices creating budget uncertainty for container purchasers.
- 4.3.3 Stricter cradle-to-grave regulations and extended-producer-responsibility (EPR) rules inflating lifetime ownership costs.
- 4.3.4 Rapid emergence of foldable and collapsible container alternatives cannibalising demand for conventional rigid boxes.
- 4.4 Value / Supply-Chain Analysis
- 4.5 Regulatory & Technological Outlook
- 4.6 Porter's Five Forces
- 4.6.1 Threat of New Entrants
- 4.6.2 Bargaining Power of Buyers
- 4.6.3 Bargaining Power of Suppliers
- 4.6.4 Threat of Substitutes
- 4.6.5 Intensity of Competitive Rivalry
- 4.7 Pricing Analysis - Standard vs. Special Containers
- 4.8 Spotlight: Intermodal & Rail Uptake
- 4.9 Global Container Leasing Landscape
- 4.10 Impact of Geopolitical Events on the Market
5 Market Size & Growth Forecasts (Value, Volume)
- 5.1 By Size
- 5.1.1 20-ft (TEU)
- 5.1.2 40-ft (FEU)
- 5.1.3 40-ft High-Cube,
- 5.1.4 Others ( >45-ft, etc)
- 5.2 By Container Type
- 5.2.1 Dry Storage (Standard)
- 5.2.2 Refrigerated (Reefer)
- 5.2.3 Tank (ISO Tank, Cryogenic)
- 5.2.4 Flat-Rack & Open-Top
- 5.2.5 Special Purpose (Side-Door, Tunnel, Insulated, Collapsible)
- 5.3 By Material
- 5.3.1 Corten Steel
- 5.3.2 Stainless Steel
- 5.3.3 Aluminium Alloy
- 5.3.4 FRP & Composite
- 5.3.5 Others
- 5.4 By End-Use Industry
- 5.4.1 Consumer Goods & Retail
- 5.4.2 Food & Beverage
- 5.4.3 Industrial Machinery & Automotive
- 5.4.4 Chemicals & Petroleum
- 5.4.5 Pharmaceuticals & Healthcare
- 5.4.6 Others
- 5.5 By Mode of Transport
- 5.5.1 Maritime Deep-Sea
- 5.5.2 Short-Sea & Coastal
- 5.5.3 Rail Intermodal
- 5.5.4 Road Inland Haulage & Off-Site Storage
- 5.6 By Geography
- 5.6.1 North America
- 5.6.1.1 United States
- 5.6.1.2 Canada
- 5.6.1.3 Mexico
- 5.6.2 South America
- 5.6.2.1 Brazil
- 5.6.2.2 Peru
- 5.6.2.3 Chile
- 5.6.2.4 Argentina
- 5.6.2.5 Rest of South America
- 5.6.3 Asia-Pacific
- 5.6.3.1 China
- 5.6.3.2 India
- 5.6.3.3 Japan
- 5.6.3.4 Australia
- 5.6.3.5 South Korea
- 5.6.3.6 South East Asia (Singapore, Malaysia, Thailand, Indonesia, Vietnam, and Philippines)
- 5.6.3.7 Rest of Asia-Pacific
- 5.6.4 Europe
- 5.6.4.1 United Kingdom
- 5.6.4.2 Germany
- 5.6.4.3 France
- 5.6.4.4 Spain
- 5.6.4.5 Italy
- 5.6.4.6 BENELUX (Belgium, Netherlands, and Luxembourg)
- 5.6.4.7 NORDICS (Denmark, Finland, Iceland, Norway, and Sweden)
- 5.6.4.8 Rest of Europe
- 5.6.5 Middle East And Africa
- 5.6.5.1 United Arab Emirates
- 5.6.5.2 Saudi Arabia
- 5.6.5.3 South Africa
- 5.6.5.4 Nigeria
- 5.6.5.5 Rest of Middle East And Africa
- 5.6.1 North America
6 Competitive Landscape
- 6.1 Market Concentration
- 6.2 Strategic Moves (M&A, Capacity Expansion, Leasing Deals)
- 6.3 Market Share Analysis
- 6.4 Company Profiles (includes Global-level Overview, Market-level Overview, Core Segments, Financials, Strategic Information, Market Rank/Share, Products & Services, Recent Developments)
- 6.4.1 China International Marine Containers (CIMC)
- 6.4.2 Dong Fang International Containers
- 6.4.3 CXIC Group (CSSC)
- 6.4.4 Maersk Container Industry A/S
- 6.4.5 Singamas Container Holdings
- 6.4.6 W&K Container
- 6.4.7 Sea Box Inc.
- 6.4.8 TLS Offshore Containers
- 6.4.9 Storstac Inc.
- 6.4.10 CARU Containers B.V.
- 6.4.11 China Eastern Containers
- 6.4.12 Valisons & Co.
- 6.4.13 YMC Container Solutions
- 6.4.14 American Intermodal Container Manufacturing
- 6.4.15 Triton International
- 6.4.16 Textainer Group Holdings
- 6.4.17 Florens Container Services
- 6.4.18 CAI International
- 6.4.19 Touax Group
- 6.4.20 UES International
7 Market Opportunities & Future Outlook
- 7.1 White-Space & Unmet-Need Assessment

 亞太地區拼箱貨運 (LCL):市場佔有率分析、產業趨勢和統計數據以及成長預測 (2026-2031)北美保溫運輸貨櫃:市場佔有率分析、產業趨勢與統計及成長預測(2026-2031 年)貨櫃航運:市場佔有率分析、產業趨勢與統計、成長預測(2026-2031)
 貨櫃短期租賃市場分析及預測(至2035年):按類型、產品、服務、技術、組件、應用、部署、最終用戶及解決方案分類
 ISO標準貨櫃市場:預測(至2034年)-按貨櫃類型、貨櫃尺寸、材料、所有權、應用、最終用戶和地區分類的全球分析歐洲沿海滾裝海運:市場佔有率分析、產業趨勢與統計及成長預測(2026-2031 年)
 貨櫃市場:2026-2032年全球市場預測(按類型、材質、尺寸、所有權、運輸方式、應用和銷售管道)中國貨櫃航運業:市場佔有率分析、產業趨勢與統計及成長預測(2026-2031年)美國貨櫃航運:市場佔有率分析、產業趨勢與統計及成長預測(2026-2031)印度貨櫃航運:市場佔有率分析、產業趨勢與統計及成長預測(2026-2031)