


 |
市場調查報告書
商品編碼
2119851
亞太地區拼箱貨運 (LCL):市場佔有率分析、產業趨勢和統計數據以及成長預測 (2026-2031)Asia-Pacific Less-than-Container-Load (LCL) - Market Share Analysis, Industry Trends & Statistics, Growth Forecasts (2026 - 2031) |
||||||

※ 本網頁內容可能與最新版本有所差異。詳細情況請與我們聯繫。
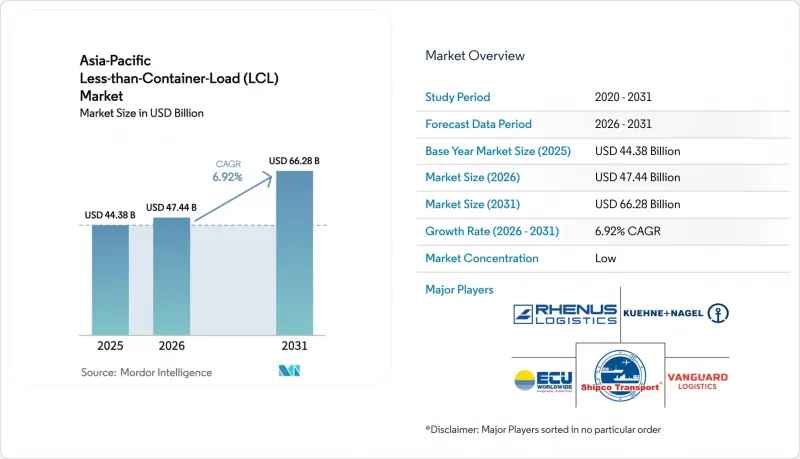
據 Mordor Intelligence 稱,2025 年亞太地區拼箱貨運 (LCL) 市場價值為 443.8 億美元,預計到 2031 年將達到 662.8 億美元,而 2026 年為 474.4 億美元,預測期(2026-2031 年)的複合年成長率為 292%。
本報告按服務類型(拼箱服務、拆箱和配送)、目的地(國內、國際)、商業模式(貨運代理、無船承運人)、最終用戶(製造/汽車、零售/電子商務、其他)和國家/地區(中國、印度、印尼、馬來西亞、其他國家)進行細分。市場預測以美元計價。
亞太地區零擔貨運 (LCL) 市場的趨勢與見解。
電子商務和跨境小包裹貿易的快速成長
預計2028年,東南亞零售電商銷售額將達1,930億美元,佔零售總額的17.4%。線上訂單的成長推動了對小規模、高頻率貨運的需求,而拼箱(LCL)運輸更符合這種經濟效益。在菲律賓和越南,線上零售的複合年成長率預計將超過20%,持續成長的需求已超出傳統整箱貨運合約的承載能力。區域全面經濟夥伴關係協定(RCEP)簡化了海關程序,降低了交易成本,加快了小批量貨物的清關速度,並引導企業將貨物運送到區域庫存中心。全通路模式的普及使得跨多個市場同步補貨成為必要,也讓拼箱運輸成為同步庫存流動的關鍵工具。隨著市場承諾“當週送達”,托運人更加重視靈活的運輸安排,而非單純追求最低運費。
亞太地區製造業供應鏈多元化
2024年,隨著企業實施「中國+1」策略,外國直接投資開始轉移到東南亞。分散在印度、越南和印尼的小規模生產基地需要從多個產地進行最終組裝和直接出口,從而增加了拼箱(LCL)貨運量。日本大型電子公司將輔助生產線遷至泰國和菲律賓,並與專業的物流整合商簽訂契約,以協調出口流程。為了因應這種分散的生產規模,該地區需要額外600億美元的物流資產,這進一步增加了對物流整合的需求。隨著地緣政治緊張局勢加劇,搬遷進程加快,高流動性的拼箱樞紐作為臨時解決方案,在跨國工廠擴大規模的過程中日益受到關注。隨著買家供應商多元化,集散中心在二線港口湧現,縮短了內陸運輸距離,並提高了周轉速度。
港口堵塞和容量限制
2025年初紅海航線的改道導致新加坡和科倫坡的船舶等待時間延長。泊位短缺也影響了支線船舶的班次,導致支援拼箱(LCL)貨物卸貨截止時間的貨櫃延誤。支線船舶業者正在徵收堵塞附加費,這直接推高了拼箱貨物的單位成本。人手不足和夜間閘口作業時間的限制進一步限制了貨物處理量,尤其是需要優先處理的溫控貨物。雖然自動化專案有望緩解處理能力不足的問題,但貨櫃到達量與堆場泊位不匹配的情況在可預見的未來仍可能繼續影響拼箱貨物的收集時間。相關人員呼籲採用更合理的泊位分配演算法和資料共用,以緩解尖峰時段的擁塞。
細分市場分析
到2025年,拼箱服務收入佔比將達到64.45%。這一主導地位源於亞太地區拼箱市場的經濟特性,在該市場中,將貨物拼裝到共享貨櫃中可以降低單位成本並提高發船頻率。馬士基上海門戶擁有200多條直飛航線,充分展現了維持每日拼箱所需的規模。儘管規模較小,但預計到2031年,非拼箱和配送業務的複合年成長率將達到4.21%,因為零售商需要將貨物批量運送到目的地以加快電商履約速度。綜合服務提供者透過將國內配送與上游拼箱結合,正在獲得門到門的運輸合約。
隨著亞洲各地越來越多的企業建立全通路庫存中心,對貨物整合服務的需求也日益成長。為此,亞太拼箱市場在檳城、宿霧和泗水等地紛紛開設了新的軸輻式中心。拆箱業務的成長也反映了自由貿易區保稅電商倉庫的出現,這些倉庫用於貨物分割、貼標和退貨。諸如配套組裝和簡易組裝等高價值物流服務,能夠幫助拼箱商提升服務水平,並獲得更高的利潤率。
到2025年,國際貨運將佔市場規模的60.40%,顯示許多亞洲生產基地以出口為導向。亞太地區拼箱貨運市場規模(與海外航線相關)仍依賴北美和歐洲的消費週期。隨著亞洲內部採購的擴張,預計國內拼箱貨運航線的複合年成長率將達到4.66%(2026-2031年)。 《通用經濟夥伴關係協定》(RCEP)預計將使區域內貿易額增加900億美元,並促進國內貨物收集和運輸。
隨著中產階級對本地組裝進口零件的需求不斷成長,國內拼箱市場正在擴張。這一趨勢支撐著電子和汽車產業的跨國生產鏈,並促進了半成品的往返運輸。拼箱公司正在發展卡車運輸合作夥伴關係,以實現首公里取貨,從而確保即使取貨點數量增加,也能按時完成貨櫃裝貨。貨運代理也在土地資源有限的大都會圈重新協商倉庫租賃協議,旨在縮短陸路運輸距離。
其他好處
- Excel格式的市場預測(ME)表
- 3個月的分析師支持
目錄
第1章:引言
- 研究假設和市場定義
- 調查範圍
第2章:調查方法
第3章執行摘要
第4章 市場狀況
- 市場概覽
- 市場促進因素
- 電子商務和跨境小包裹交易的蓬勃發展
- 亞太地區製造業供應鏈多元化
- 拼箱空運對中小企業的成本效益
- 港口基礎建設及自由貿易協定
- 提供拼箱即期貨運報價的數位化貨運平台。
- 綠色航運計劃旨在促進最佳化負載容量
- 市場限制因素
- 港口堵塞和容量限制
- 海運費率波動
- 冷鏈拼箱基礎設施有限
- ESG合規的新負擔
- 價值供應鏈分析
- 監理情勢
- 技術展望
- 波特五力分析
- 新冠疫情與地緣政治事件的影響
第5章 市場規模與成長預測
- 按服務類型
- 合併運輸服務
- 整合與交付
- 目的地
- 國內的
- 國際的
- 依業務類型
- 轉發
- NVOCC
- 最終用戶
- 製造業/汽車
- 零售與電子商務
- 醫療和藥品
- 農業和林業
- 其他最終用戶
- 國家
- 中國
- 印度
- 印尼
- 日本
- 馬來西亞
- 泰國
- 越南
- 澳洲
- 其他亞太地區
第6章 競爭情勢
- 市場集中度
- 策略趨勢
- 市佔率分析
- 公司簡介
- ECU Worldwide(All Cargo Logistics 的子公司)
- Shipco
- Vanguard Logistics
- Rhenus Logistics
- Kuehne+Nagel
- DHL Global Forwarding
- DSV
- CEVA Logistics
- Rohlig Logistics
- GEODIS
- Gulf Agency Company(GAC)
- Kerry Logistics Network
- Sinotrans
- Nippon Express
- CJ Logistics
- JAS Worldwide
- APL Logistics
- Dimerco Express Group
- 郵船物流(日本郵船株式會社的子公司)
- Toll Group
第7章 市場機會與未來展望
According to Mordor Intelligence, the Asia-Pacific less-than-Container-Load market size was valued at USD 44.38 billion in 2025 and estimated to grow from USD 47.44 billion in 2026 to reach USD 66.28 billion by 2031, at a CAGR of 6.92% during the forecast period (2026-2031).
This report is Segmented by Service Type (Consolidation Services and De-Consolidation & Distribution), Destination (Domestic and International), Nature of Business (Freight Forwarding and NVOCCs), End User (Manufacturing and Automotive, Retail & E-Commerce, and More), Country (China, India, Indonesia, Malaysia, and More). The Market Forecasts are Provided in Terms of Value (USD).
Asia-Pacific Less-than-Container-Load (LCL) Market Trends and Insights
E-commerce boom & cross-border parcel trade
Retail e-commerce sales in Southeast Asia are expected to hit USD 193 billion by 2028, equal to 17.4% of total retail spend. Rising online orders require smaller, more frequent shipments that suit LCL economics. The Philippines and Vietnam each anticipate online-retail CAGRs above 20%, creating constant demand spikes that traditional full-container contracts cannot match. RCEP customs simplification lowers transaction costs, speeding up small-batch clearances and pushing merchants toward regional inventory hubs. Omnichannel models mean inventory must be replenished across multiple markets simultaneously, reinforcing LCL's role in synchronized stock flows. As marketplaces promote same-week delivery promises, shippers prioritize flexible sailings over absolute rate minimization.
Supply-chain diversification of Asia-Pacific manufacturing
Foreign direct investment began shifting toward Southeast Asia during 2024 as firms executed "China + 1" strategies. Smaller production footprints scattered across India, Vietnam, and Indonesia require multi-origin pick-ups for final assembly or direct export, thereby elevating LCL volumes. Japanese electronics groups moved auxiliary lines to Thailand and the Philippines, contracting specialist consolidators to synchronize outbound flows. The region needs an additional USD 60 billion in logistics assets to handle this dispersed output, further magnifying consolidation demand. Heightened geopolitical tension accelerates relocation timelines, making agile LCL nodes attractive stopgaps while multi-country plants scale. As buyers diversify suppliers, consolidation centers emerge in secondary ports, shortening inland haulage and improving turnaround.
Port congestion & capacity constraints
Singapore and Colombo experienced extended vessel waits after Red Sea diversions in early 2025. Berth shortages ripple into feeder schedules, delaying container de-stuffing deadlines that underpin LCL cut-off times. Feeder operators imposed congestion surcharges that directly lift LCL unit costs. Labor shortages and limited night-gate hours further restrict throughput, especially for temperature-sensitive cargo needing priority handling. Automation projects promise capacity relief, but near-term mismatches between container arrivals and yard slots will continue disrupting LCL consolidation windows. Stakeholders advocate for better berth-allocation algorithms and data-sharing to smooth peaks.
Other drivers and restraints analyzed in the detailed report include:
- Cost-efficiency of LCL over air freight for SMEs
- Digital freight platforms offering LCL spot rates
- Volatility in ocean-freight rates
For complete list of drivers and restraints, kindly check the Table Of Contents.
Segment Analysis
Consolidation services commanded 64.45% of 2025 revenue. Their dominance stems from the Asia-Pacific Less-than-Container-Load market economics in which cargo aggregation into shared containers drives lower per-unit costs and faster sailing frequency. Maersk's Shanghai gateway with more than 200 direct lanes evidences the scale required to sustain daily consolidations. De-consolidation and distribution, though smaller, post a 4.21% CAGR to 2031 as retailers seek destination-side break-bulk for rapid e-commerce fulfillment. Integrated providers bundle in-country distribution with upstream consolidation to secure door-to-door contracts.
Demand for consolidation services rises with each additional omnichannel stock-point merchant set up across Asia. The Asia-Pacific Less-than-Container-Load market responds by opening new hub-and-spoke facilities in Penang, Cebu, and Surabaya. De-consolidation growth also mirrors the adoption of bonded e-commerce warehouses, where shipment splitting, labeling, and returns handling occur inside free-trade zones. Value-added distribution tasks, such as kitting or light assembly, allow consolidators to move up the service ladder, capturing higher margins.
International shipments generated 60.40% of the 2025 value, illustrating the export-oriented nature of many Asian production centers. The Asia-Pacific Less-than-Container-Load market size tied to overseas routes remains anchored by North American and European consumption cycles. Nevertheless, domestic LCL lanes are expected to post a faster 4.66% CAGR (2026-2031) as intra-Asia sourcing spreads. RCEP's common rule of origin is forecast to add USD 90 billion to regional trade and feed domestic consolidation flows.
Domestic LCL expansion pairs with rising middle-class demand for imported components assembled locally. This trend supports multi-country production chains in electronics and automotive, triggering back-and-forth movements of semi-finished goods. Consolidators refine trucking alliances for first-mile pick-ups to ensure container stuffing deadlines remain intact when origin points multiply. Forwarders also renegotiate depot leases in land-constrained metro areas to shorten drayage.
Complete Report Scope:
- By Service Type
- Consolidation Services
- De-consolidation & Distribution
- By Destination
- Domestic
- International
- By Nature of Business
- Freight Forwarding
- NVOCCs
- By End User
- Manufacturing and Automotive
- Retail & E-commerce
- Healthcare & Pharmaceuticals
- Agriculture & Forestry
- Other End Users
- By Country
- China
- India
- Indonesia
- Japan
- Malaysia
- Thailand
- Vietnam
- Australia
- Rest of Asia-Pacific
List of Companies Covered in this Report:
- ECU Worldwide (Part of All Cargo Logistics)
- Shipco
- Vanguard Logistics
- Rhenus Logistics
- Kuehne + Nagel
- DHL Global Forwarding
- DSV
- CEVA Logistics
- Rohlig Logistics
- GEODIS
- Gulf Agency Company (GAC)
- Kerry Logistics Network
- Sinotrans
- Nippon Express
- CJ Logistics
- JAS Worldwide
- APL Logistics
- Dimerco Express Group
- Yusen Logistics (Part of NYK Line)
- Toll Group
Additional Benefits:
- The market estimate (ME) sheet in Excel format
- 3 months of analyst support
TABLE OF CONTENTS
1 Introduction
- 1.1 Study Assumptions & Market Definition
- 1.2 Scope of the Study
2 Research Methodology
3 Executive Summary
4 Market Landscape
- 4.1 Market Overview
- 4.2 Market Drivers
- 4.2.1 E-commerce boom & cross-border parcel trade
- 4.2.2 Supply-chain diversification of Asia-Pacific manufacturing
- 4.2.3 Cost-efficiency of LCL over air-freight for SMEs
- 4.2.4 Port infrastructure expansion & FTAs
- 4.2.5 Digital freight platforms offering LCL spot rates
- 4.2.6 Green-shipping initiatives favouring load optimisation
- 4.3 Market Restraints
- 4.3.1 Port congestion & capacity constraints
- 4.3.2 Volatility in ocean-freight rates
- 4.3.3 Limited cold-chain LCL infrastructure
- 4.3.4 Emerging ESG compliance burdens
- 4.4 Value / Supply-Chain Analysis
- 4.5 Regulatory Landscape
- 4.6 Technological Outlook
- 4.7 Porter's Five Forces Analysis
- 4.7.1 Bargaining Power of Suppliers
- 4.7.2 Bargaining Power of Buyers
- 4.7.3 Threat of New Entrants
- 4.7.4 Threat of Substitutes
- 4.7.5 Intensity of Competitive Rivalry
- 4.8 Impact of COVID-19 & Geo-Political Events
5 Market Size & Growth Forecasts
- 5.1 By Service Type
- 5.1.1 Consolidation Services
- 5.1.2 De-consolidation & Distribution
- 5.2 By Destination
- 5.2.1 Domestic
- 5.2.2 International
- 5.3 By Nature of Business
- 5.3.1 Freight Forwarding
- 5.3.2 NVOCCs
- 5.4 By End User
- 5.4.1 Manufacturing and Automotive
- 5.4.2 Retail & E-commerce
- 5.4.3 Healthcare & Pharmaceuticals
- 5.4.4 Agriculture & Forestry
- 5.4.5 Other End Users
- 5.5 By Country
- 5.5.1 China
- 5.5.2 India
- 5.5.3 Indonesia
- 5.5.4 Japan
- 5.5.5 Malaysia
- 5.5.6 Thailand
- 5.5.7 Vietnam
- 5.5.8 Australia
- 5.5.9 Rest of Asia-Pacific
6 Competitive Landscape
- 6.1 Market Concentration
- 6.2 Strategic Moves
- 6.3 Market Share Analysis
- 6.4 Company Profiles {(includes Global level Overview, Market level overview, Core Segments, Financials as available, Strategic Information, Market Rank/Share for key companies, Products & Services, and Recent Developments)}
- 6.4.1 ECU Worldwide (Part of All Cargo Logistics)
- 6.4.2 Shipco
- 6.4.3 Vanguard Logistics
- 6.4.4 Rhenus Logistics
- 6.4.5 Kuehne + Nagel
- 6.4.6 DHL Global Forwarding
- 6.4.7 DSV
- 6.4.8 CEVA Logistics
- 6.4.9 Rohlig Logistics
- 6.4.10 GEODIS
- 6.4.11 Gulf Agency Company (GAC)
- 6.4.12 Kerry Logistics Network
- 6.4.13 Sinotrans
- 6.4.14 Nippon Express
- 6.4.15 CJ Logistics
- 6.4.16 JAS Worldwide
- 6.4.17 APL Logistics
- 6.4.18 Dimerco Express Group
- 6.4.19 Yusen Logistics (Part of NYK Line)
- 6.4.20 Toll Group
7 Market Opportunities & Future Outlook
- 7.1 White-space & Unmet-need Assessment

 北美保溫運輸貨櫃:市場佔有率分析、產業趨勢與統計及成長預測(2026-2031 年)貨櫃航運:市場佔有率分析、產業趨勢與統計、成長預測(2026-2031)
 貨櫃短期租賃市場分析及預測(至2035年):按類型、產品、服務、技術、組件、應用、部署、最終用戶及解決方案分類
 ISO標準貨櫃市場:預測(至2034年)-按貨櫃類型、貨櫃尺寸、材料、所有權、應用、最終用戶和地區分類的全球分析海運貨櫃:市場佔有率分析、產業趨勢與統計、成長預測(2026-2031)歐洲沿海滾裝海運:市場佔有率分析、產業趨勢與統計及成長預測(2026-2031 年)
 貨櫃市場:2026-2032年全球市場預測(按類型、材質、尺寸、所有權、運輸方式、應用和銷售管道)中國貨櫃航運業:市場佔有率分析、產業趨勢與統計及成長預測(2026-2031年)美國貨櫃航運:市場佔有率分析、產業趨勢與統計及成長預測(2026-2031)印度貨櫃航運:市場佔有率分析、產業趨勢與統計及成長預測(2026-2031)