


 |
市場調查報告書
商品編碼
2099083
美國貨櫃航運:市場佔有率分析、產業趨勢與統計及成長預測(2026-2031)United States Container Shipping - Market Share Analysis, Industry Trends & Statistics, Growth Forecasts (2026 - 2031) |
||||||

※ 本網頁內容可能與最新版本有所差異。詳細情況請與我們聯繫。
根據 Mordor Intelligence 預測,美國貨櫃航運市場規模將從 2025 年的 664.9 億美元和 2026 年的 691.6 億美元成長到 2031 年的 834.5 億美元,2026 年至 2031 年的年複合成長率(CAGR)為 3.83%。
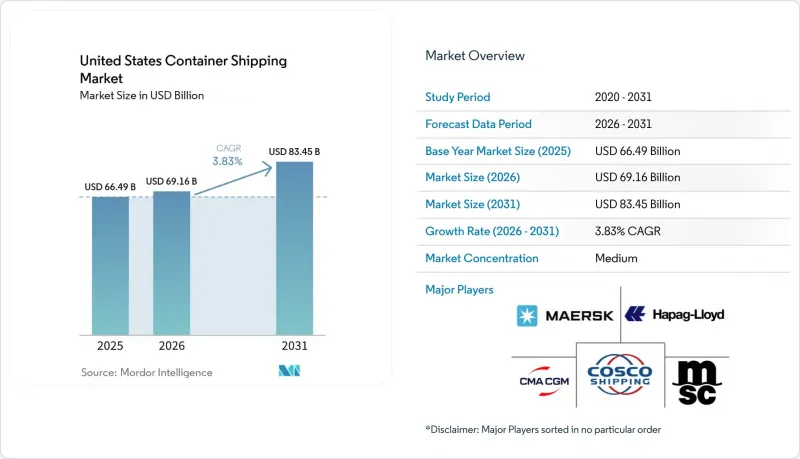
儘管國內進口總量停滯不前,但美國貨櫃航運市場仍受到貨物持續向東海岸和墨西哥灣沿岸港口轉移的影響。本報告按服務類型(遠洋運輸、沿海運輸等)、貨櫃類型(乾貨貨櫃和冷藏貨櫃)、貨櫃尺寸(20英尺、40英尺等)、貨物類型(整箱和拼箱)、終端用戶產業(快速消費品和零售、電子電氣設備等)以及地區(東北部、東南部、中西部、西南部、西部)進行細分。市場預測以美元計價。
美國貨櫃航運市場的趨勢與洞察
東海岸近岸外包和與墨西哥的貿易改道
在美國貨櫃航運市場,隨著貨源從中國轉向墨西哥和東南亞部分地區,貨運路線正經歷持續的轉變。中國在美國貨櫃進口總量中所佔的佔有率從2024年中期的40%下降到2025年中期的28.8%,而同期從印尼和泰國的進口量分別增加了34%和28%。這使得部分進口貨物的平均運輸距離縮短,海運航程也隨之縮短,並提升了以墨西哥灣為主要航線的經濟效益。北美東岸港口對美國進口貨櫃的比例從2025年第一季的46%上升到2026年第一季的46.8%,顯示這種路線轉變正從一種臨時因應措施逐漸演變為一種明確的貿易模式。隨著近岸外包的成熟,預計美國貨櫃航運市場的需求將更加集中在連接墨西哥和大西洋供應鏈與墨西哥灣沿岸。
美國對港口現代化和自動化的投資
港口現代化透過提升泊位效率、起重機能力和陸上貨物吞吐量,正在加強美國貨櫃航運市場的營運基礎。在2025會計年度,港口基礎設施發展計畫下共撥款7.74億美元用於37個項目,反映了在當前撥款期結束前,民眾對港口現代化的大力支持。碼頭營運商也正在進行直接投資,例如伊麗莎白港和洛杉磯港正在進行現代化改造,安裝更高的起重機以適應更大的船舶;長灘港的B號碼頭鐵路支撐項目則旨在提升內陸貨物裝卸能力。這些現代化改造意義重大,因為它們透過縮短船舶停留時間、提高船舶週轉效率和緩解營運限制,為能夠處理更大貨櫃船的港口提供了更多選擇。未來,美國二級港口可靠性和效率的提升將使美國貨櫃航運市場受益,增加直航次數,並減少非必要貨物流向美國境外其他港口的情況。
主要跨太平洋和跨大西洋航線運力過剩。
美國貨櫃航運市場短期內最大的阻礙因素是全球船舶運力過剩。到2026年3月,全球租船船隊規模將超過3360萬標準箱(TEU),而2026年至2028年的訂單積壓主要集中在超大型船舶上,這加劇了連接美國的長途航線的運力壓力。此外,2024年和2025年船舶拆解數量的減少延緩了運輸能力的調整,使供應問題延續到目前的預測期間。對於托運人而言,這可能導致短期內運費走低;但另一方面,如果運費持續受到擠壓,實力較弱的航運公司失去市場佔有率或被迫進行行業重組的風險將會增加。因此,美國貨櫃航運市場面臨著相互矛盾的影響:一方面,運費走低可使客戶短期受益;另一方面,航運公司的盈利和航線營運紀律將面臨越來越大的策略壓力。
細分市場分析
2025年,遠洋貨櫃運輸占美國貨櫃運輸市場佔有率的58.44%,成為整個運輸體系的核心收入來源。其主導地位源於連接美國港口與製造地的長期成熟的跨太平洋和跨大西洋航線。 2025年,其規模仍然顯著,因為大型零售商、工業採購商和依賴進口的製造商仍依賴這些航線來運輸大部分貨物。然而,關稅壓力和貨源多元化削弱了先前支撐美中主要航線盈利的確定性。因此,儘管美國貨櫃運輸市場繼續依賴遠洋運輸服務,但該細分市場的需求結構發生了轉變,不再像以前那樣集中於單一始發國。
預計該類別中成長最快的將是近岸航運,預計到2031年將以4.81%的複合年成長率成長。這一成長與墨西哥近岸外包、加勒比地區支線航線的活性化以及墨西哥灣沿岸走廊的發展密切相關,這些因素為短途和中程海運創造了更多可行的貨運量。 2025年和2026年實施的聯盟重組改變了使用海運網路的托運人的航線安排和港口覆蓋範圍。隨著服務結構的改變,近岸航線對於在新的貨源地和不斷發展的東海岸及墨西哥灣沿岸門戶之間實現靈活的貨物轉運變得日益重要。在美國貨櫃航運業,這一領域不再只是輔助支援層,而是正在成為參與近岸貿易的港口和航運公司更直接的成長途徑。
2025年,乾貨貨櫃占美國貨櫃航運市場的76.40%,這反映了其運輸的貨物種類繁多,且無需溫控。服裝、電子產品、工業零件、家居用品和一般零售貨物的運輸繼續保持這一領域的主導地位。其龐大的市場規模意味著,即使零售需求或生產訂單出現輕微波動,也會對整體市場收入產生顯著影響。儘管2025年來自中國的進口下降導致主要跨太平洋航線上乾貨貨櫃的使用率降低,但這並未削弱該領域在美國國內貨運量中的核心地位。新船訂單(主要為標準運力)也表明,航運公司仍然將乾貨貨櫃視為美國貨櫃航運市場的主要運輸平台。
預計到2031年,冷藏貨櫃的複合年成長率將達到7.43%,成為成長最快的貨櫃類型。這反映了藥品和食品物流需求的不斷成長,而由於美國藥品法規對可追溯性和處理的要求,製藥業獲得了更持續的政策支持。更嚴格的環境法規增加了對冷藏貨櫃相容船隊改造和設備升級的需求,導致該領域的資本密集度增加。與醫療和生命科學產業聯繫緊密的東海岸港口預計將從中受益最多,因為它們已經具備處理這些貨物所需的合規性、倉儲和處理基礎設施。因此,在美國貨櫃航運業,冷藏貨櫃的成長對設備策略、碼頭優先事項和收入結構的影響,比對貨櫃總量的影響更大。
其他好處:
- Excel格式的市場預測(ME)表
- 3個月的分析師支持
目錄
第1章:引言
- 研究假設和市場定義
- 調查範圍
第2章:調查方法
第3章執行摘要
第4章 市場狀況
- 市場概況及貨櫃運輸在物流中的作用
- 市場促進因素
- 將生產轉移到東海岸並重組與墨西哥的貿易路線
- 美國對港口現代化和自動化的投資
- 由於進口醫療用品和食品,冷藏貨物數量增加。
- 重新調整美國墨西哥灣沿岸和東海岸港口的承運商網路
- 在時間緊迫的零售運輸路線上,托運人更傾向於整箱貨運 (FCL)。
- 對能夠提供進度可靠性和數據可視化的海事合約的需求日益成長。
- 市場限制因素
- 主要跨太平洋和跨大西洋航線運力過剩。
- 港口擁擠、勞資糾紛風險以及停留時間的不確定性。
- 美國貿易政策的波動性和關稅造成的訂單不確定性。
- 設備不平衡,特別是冷藏集裝箱和 40 英尺高立方貨櫃。
- 法律規範
- 價值鍊和分銷管道的結構分析
- 技術創新前景
- 波特五力模型
- 貨櫃航運業的變化
- 比較:貨櫃運輸與其他運輸方式
- 價格分析
- 近岸外包和友善外包的趨勢
- 影響貨櫃需求的經濟指標
- 地緣政治事件對供應鏈變化的影響
第5章 市場規模及成長預測(價值,2026-2031 年)
- 按服務類型
- 遠洋貨櫃運輸
- 沿海貨櫃運輸
- 支線/沿海/國內貨櫃運輸
- 按容器類型
- 乾貨容器(通用)
- 冷藏貨櫃
- 按容器尺寸
- 20英尺貨櫃(20英尺)
- 40英尺貨櫃(40英尺)
- 其他特殊尺寸
- 負載類型
- 整箱貨(FCL)
- 拼箱
- 按最終用戶行業分類
- 快速消費品和零售
- 製造業/汽車
- 醫療和藥品
- 電電器設備
- 工業化學品和原料
- 其他
- 按地區
- 東北
- 東南
- 中西部
- 西南
- 西方
第6章 競爭情勢
- 市場集中度
- 關鍵策略趨勢
- 市佔率分析
- 公司簡介
- Mediterranean Shipping Company(MSC)
- AP Moller-Maersk A/S
- CMA CGM Group
- COSCO SHIPPING Holdings Co., Ltd.
- Hapag-Lloyd AG
- Ocean Network Express Pte. Ltd.
- Evergreen Marine Corporation(Taiwan)Ltd.
- ZIM Integrated Shipping Services Ltd.
- Seaboard Marine Ltd.
- Yang Ming Marine Transport Corp.
- SeaLead Shipping Pte. Ltd.
- Wan Hai Lines Ltd.
- Pacific International Lines Pte Ltd
- SM Line Corporation
- Matson, Inc.
- Crowley Maritime Corporation
- King Ocean Services Ltd.
- HMM Co., Ltd.
- TS Lines Ltd.
- Emirates Shipping Line
- X-Press Feeders
- Korea Marine Transport Co.(KMTC)
第7章 市場機會與未來展望
According to Mordor Intelligence, the United States container shipping market size is projected to expand from USD 66.49 billion in 2025 and USD 69.16 billion in 2026 to USD 83.45 billion by 2031, registering a CAGR of 3.83% between 2026 and 2031.
The United States container shipping market is being shaped by a steady rerouting of cargo toward East Coast and Gulf Coast gateways, even though national import volumes have shown limited headline growth. This report is Segmented by Service Type (Deep-Sea, Short-Sea, and More), by Container Type (Dry and Reefer), by Container Size (20-Ft, 40-Ft, and More), by Load Type (FCL and LCL), by End-User Industry (FMCG and Retail, Electronic and Electrical Equipment, and More), and by Region (Northeast, Southeast, Midwest, Southwest, and West). The Market Forecasts are Provided in Terms of Value (USD).
United States Container Shipping Market Trends and Insights
East Coast Nearshoring and Mexico Trade Re-Routing
The United States container shipping market is seeing a durable change in cargo routing as sourcing shifts away from China and toward Mexico and parts of Southeast Asia. China's share of total United States containerized imports fell from 40% in mid-2024 to 28.8% by mid-2025, while Indonesia posted 34% import growth to the United States and Thailand posted 28% growth over the same period. This has shortened the average haul for part of the inbound cargo base and improved the economics of shorter sea legs and Gulf-oriented routing. North American East Coast ports raised their share of United States-laden import containers from 46% in Q1 2025 to 46.8% in Q1 2026, showing that the routing shift has already moved from a temporary response to a measurable trade pattern. As nearshoring matures, the United States container shipping market is likely to see more demand concentrated in corridors linking Gulf and East Coast gateways with Mexico-facing and Atlantic-facing supply chains.
United States Port Modernization and Automation Investments
Port modernization is strengthening the operating base of the United States container shipping market by improving berth productivity, crane capability, and landside cargo flow. FY 2025 distribution of USD 774 million across 37 projects under the Port Infrastructure Development Program, reflecting the scale of public support for port upgrades before the current funding window closes. Terminal operators are also investing directly, with modernization at Port Elizabeth and Los Angeles adding taller cranes for larger vessels, while the Pier B rail support project in Long Beach is improving inland cargo handling capacity. These upgrades matter because they reduce dwell time, improve turn efficiency, and widen the set of ports that can handle larger container ships with fewer operational constraints. Over time, the United States container shipping market should benefit from more direct port calls and less leakage of discretionary cargo to non-United States alternatives, where secondary United States ports become more reliable and more efficient.
Vessel Overcapacity on Major Transpacific and Transatlantic Loops
The largest near-term restraint on the United States container shipping market is a global vessel capacity overhang. Global cellular fleet exceeded 33.6 million TEU by March 2026 and that much of the 2026-2028 orderbook is concentrated in very large ships, which increases pressure on long-haul routes serving the United States. Low demolition activity in 2024 and 2025 also delayed capacity adjustment and pushed the supply issue into the current forecast window. For shippers, this can support softer rates in the near term, but it also increases the risk that weaker carriers lose ground or pursue consolidation when pricing remains under pressure. The United States container shipping market, therefore, faces mixed effects, with short-run customer benefits from lower freight rates but heavier strategic pressure on carrier profitability and route discipline.
Other drivers and restraints analyzed in the detailed report include:
- Refrigerated Cargo Growth from Healthcare and Food Imports
- Carrier Network Rebalancing Toward United States Gulf and East Coast Ports
- Port Congestion, Labor Disruption Risk, and Dwell-Time Volatility
For complete list of drivers and restraints, kindly check the Table Of Contents.
Segment Analysis
Deep-sea or ocean container shipping accounted for 58.44% of the United States container shipping market share in 2025, making it the core revenue base for the broader system. Its lead came from the long-established transpacific and transatlantic loops that connect United States ports with manufacturing centers in Asia and Europe. That scale remained important in 2025 because large retailers, industrial buyers, and import-dependent manufacturers still relied on these routes for the highest cargo volumes. At the same time, tariff pressure and sourcing diversification weakened the certainty that had previously supported the strongest China-United States mainline economics. The United States container shipping market, therefore, continued to depend on deep-sea services, but the shape of demand inside that segment became less concentrated around a single origin country.
The fastest growth in this category is shifting to short-sea shipping, which is expected to expand at a 4.81% CAGR through 2031. That growth is tied to Mexico nearshoring, Caribbean feeder activity, and Gulf Coast corridor development, which are creating more viable volumes for shorter and mid-distance maritime movements. Alliance reshuffling in 2025 and 2026, which changed schedule design and port pair coverage for shippers using deep-sea networks. As service structures change, short-sea routes are gaining importance because they support flexible cargo handoff between new sourcing points and growing East Coast and Gulf Coast gateways. Within the United States container shipping industry, this segment is no longer merely a secondary support layer, as it is becoming a more direct growth path for ports and carriers exposed to nearshore trade.
Dry containers accounted for 76.40% of the United States container shipping market size in 2025, which reflects the wide variety of standard cargo that moves without temperature control. Apparel, electronics, industrial parts, home goods, and general retail shipments all kept this segment firmly in the lead. Its large base also means that even small shifts in retail demand or manufacturing orders can move total market revenue in visible ways. The decline in Chinese-origin imports in 2025 weakened dry container utilization on major transpacific lanes, but it did not diminish the segment's central role in national cargo flows. Newbuild orders aimed mainly at standard capacity also show that carriers still view dry containers as the main throughput platform for the United States container shipping market.
Reefer containers are projected to grow at a 7.43% CAGR through 2031, making them the fastest-moving container type. This reflects stronger demand for pharmaceutical and food logistics, but the pharmaceutical side has more durable policy support due to traceability and handling requirements under the United States drug regulations. Environmental regulations are increasing retrofit and equipment-replacement needs for reefer-capable fleets, thereby increasing capital intensity in this segment. East Coast ports with established healthcare and life sciences links stand to gain the most, as they already support the compliance, warehousing, and handling routines required for these cargoes. In the United States container shipping industry, reefer growth is therefore changing equipment strategy, terminal priorities, and the value mix more than it is changing total box volume.
Complete Report Scope:
- By Service Type
- Deep-Sea/Ocean Container Shipping
- Short-Sea Container Shipping
- Feeder and Coastal/Domestic Container Shipping
- By Container Type
- Dry Containers (General Purpose)
- Reefer Containers
- By Container Size
- 20-foot Containers (20 ft)
- 40-foot Containers (40 ft)
- Other Specialized Sizes
- By Load Type
- Full-Container-Load (FCL)
- Less-Than-Container-Load (LCL)
- By End-User Industry
- FMCG and Retail
- Manufacturing and Automotive
- Healthcare and Pharmaceuticals
- Electronics and Electrical Equipment
- Industrial Chemicals and Raw Materials
- Others
- By Region
- Northeast
- Southeast
- Midwest
- Southwest
- West
List of Companies Covered in this Report:
- Mediterranean Shipping Company (MSC)
- A.P. Moller - Maersk A/S
- CMA CGM Group
- COSCO SHIPPING Holdings Co., Ltd.
- Hapag-Lloyd AG
- Ocean Network Express Pte. Ltd.
- Evergreen Marine Corporation (Taiwan) Ltd.
- ZIM Integrated Shipping Services Ltd.
- Seaboard Marine Ltd.
- Yang Ming Marine Transport Corp.
- SeaLead Shipping Pte. Ltd.
- Wan Hai Lines Ltd.
- Pacific International Lines Pte Ltd
- SM Line Corporation
- Matson, Inc.
- Crowley Maritime Corporation
- King Ocean Services Ltd.
- HMM Co., Ltd.
- TS Lines Ltd.
- Emirates Shipping Line
- X-Press Feeders
- Korea Marine Transport Co. (KMTC)
Additional Benefits:
- The market estimate (ME) sheet in Excel format
- 3 months of analyst support
TABLE OF CONTENTS
1 Introduction
- 1.1 Study Assumptions & Market Definition
- 1.2 Scope of the Study
2 Research Methodology
3 Executive Summary
4 Market Landscape
- 4.1 Market Overview and Role of Container Shipping in Logistics
- 4.2 Market Drivers
- 4.2.1 East Coast Nearshoring and Mexico Trade Re-Routing
- 4.2.2 US Port Modernization and Automation Investments
- 4.2.3 Refrigerated Cargo Growth from Healthcare and Food Imports
- 4.2.4 Carrier Network Rebalancing Toward US Gulf and East Coast Ports
- 4.2.5 Shipper Preference for FCL on Time-Sensitive Retail Lanes
- 4.2.6 Demand for Schedule Reliability and Data-Visible Ocean Contracts
- 4.3 Market Restraints
- 4.3.1 Vessel Overcapacity on Major Transpacific and Transatlantic Loops
- 4.3.2 Port Congestion, Labor Disruption Risk, and Dwell-Time Volatility
- 4.3.3 US Trade Policy Volatility and Tariff-Driven Booking Uncertainty
- 4.3.4 Equipment Imbalance, Especially Reefers and 40-Foot High Cubes
- 4.4 Regulatory Framework
- 4.5 Value Chain and Distribution Channel Architecture Analysis
- 4.6 Technology Innovations Outlook
- 4.7 Porter's Five Forces
- 4.7.1 Threat of New Entrants
- 4.7.2 Bargaining Power of Suppliers
- 4.7.3 Bargaining Power of Buyers
- 4.7.4 Threat of Substitutes
- 4.7.5 Rivalry Among Competitors
- 4.8 Evolution of Container Shipping Industry
- 4.9 Comparison: Container Shipping vs Other Freight Modes
- 4.10 Pricing Analysis
- 4.11 Nearshoring and Friend-Shoring Developments
- 4.12 Economic Indicators Influencing Container Demand
- 4.13 Impact of Geo-Political Events on Supply Chain Shifts
5 Market Size & Growth Forecasts (Value, 2026-2031)
- 5.1 By Service Type
- 5.1.1 Deep-Sea/Ocean Container Shipping
- 5.1.2 Short-Sea Container Shipping
- 5.1.3 Feeder and Coastal/Domestic Container Shipping
- 5.2 By Container Type
- 5.2.1 Dry Containers (General Purpose)
- 5.2.2 Reefer Containers
- 5.3 By Container Size
- 5.3.1 20-foot Containers (20 ft)
- 5.3.2 40-foot Containers (40 ft)
- 5.3.3 Other Specialized Sizes
- 5.4 By Load Type
- 5.4.1 Full-Container-Load (FCL)
- 5.4.2 Less-Than-Container-Load (LCL)
- 5.5 By End-User Industry
- 5.5.1 FMCG and Retail
- 5.5.2 Manufacturing and Automotive
- 5.5.3 Healthcare and Pharmaceuticals
- 5.5.4 Electronics and Electrical Equipment
- 5.5.5 Industrial Chemicals and Raw Materials
- 5.5.6 Others
- 5.6 By Region
- 5.6.1 Northeast
- 5.6.2 Southeast
- 5.6.3 Midwest
- 5.6.4 Southwest
- 5.6.5 West
6 Competitive Landscape
- 6.1 Market Concentration
- 6.2 Key Strategic Moves
- 6.3 Market Share Analysis
- 6.4 Company Profiles (includes Global level Overview, Market level overview, Core Segments, Financials as available, Strategic Information, Market Rank/Share for key companies, Products & Services, and Recent Developments)
- 6.4.1 Mediterranean Shipping Company (MSC)
- 6.4.2 A.P. Moller - Maersk A/S
- 6.4.3 CMA CGM Group
- 6.4.4 COSCO SHIPPING Holdings Co., Ltd.
- 6.4.5 Hapag-Lloyd AG
- 6.4.6 Ocean Network Express Pte. Ltd.
- 6.4.7 Evergreen Marine Corporation (Taiwan) Ltd.
- 6.4.8 ZIM Integrated Shipping Services Ltd.
- 6.4.9 Seaboard Marine Ltd.
- 6.4.10 Yang Ming Marine Transport Corp.
- 6.4.11 SeaLead Shipping Pte. Ltd.
- 6.4.12 Wan Hai Lines Ltd.
- 6.4.13 Pacific International Lines Pte Ltd
- 6.4.14 SM Line Corporation
- 6.4.15 Matson, Inc.
- 6.4.16 Crowley Maritime Corporation
- 6.4.17 King Ocean Services Ltd.
- 6.4.18 HMM Co., Ltd.
- 6.4.19 TS Lines Ltd.
- 6.4.20 Emirates Shipping Line
- 6.4.21 X-Press Feeders
- 6.4.22 Korea Marine Transport Co. (KMTC)
7 Market Opportunities & Future Outlook
- 7.1 White-space & Unmet-Need Assessment

 貨櫃市場:2026-2032年全球市場預測(按類型、材質、尺寸、所有權、運輸方式、應用和銷售管道)
 中國貨櫃航運業:市場佔有率分析、產業趨勢與統計及成長預測(2026-2031年)印度貨櫃航運:市場佔有率分析、產業趨勢與統計及成長預測(2026-2031)
 貨櫃改造市場-全球產業規模、佔有率、趨勢、機會、預測:按類型、改造類型、應用、產業、地區和競爭格局分類,2021-2031年
 貨櫃船市場:按部件、燃料類型和地區分類貨物固定設備市場:2026-2032年全球市場預測(依產品、材料、應用及通路分類)
 貨櫃船市場規模、佔有率、成長及全球產業分析:按類型、應用和地區分類,並預測至2026-2034年海運貨櫃:市場佔有率分析、產業趨勢與統計、成長預測(2026-2031)全球智慧貨櫃市場規模、佔有率、趨勢和成長分析報告(2026-2034)全球貨櫃市場規模、佔有率、趨勢和成長分析報告(2026-2034)