


 |
市場調查報告書
商品編碼
2119814
新加坡資料中心儲存:市場佔有率分析、產業趨勢與統計及成長預測(2026-2031 年)Singapore Data Center Storage - Market Share Analysis, Industry Trends & Statistics, Growth Forecasts (2026 - 2031) |
||||||

※ 本網頁內容可能與最新版本有所差異。詳細情況請與我們聯繫。
據 Mordor Intelligence 稱,新加坡資料中心儲存市場預計到 2026 年價值 12.4 億美元,高於 2025 年的 12 億美元,預計到 2031 年將達到 14.6 億美元。
預計 2026 年至 2031 年的複合年成長率為 3.40%。
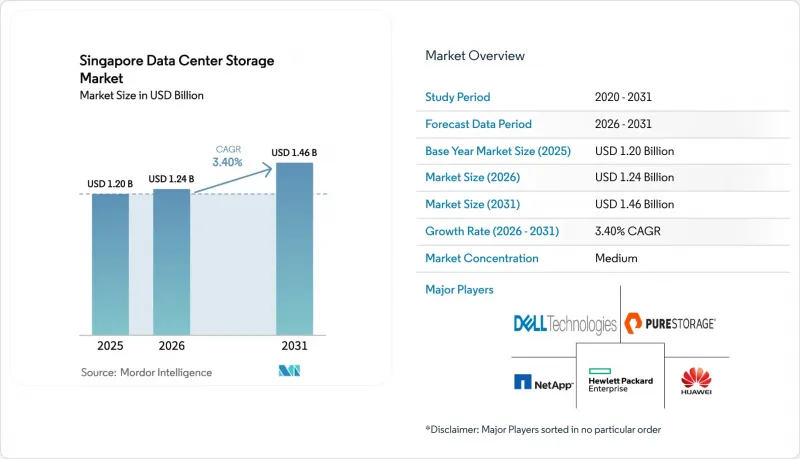
本報告按儲存技術(網路附加儲存 (NAS)、儲存區域網路(SAN) 及其他)、儲存類型(傳統硬碟陣列及其他)和最終用戶(IT 和通訊、銀行、金融服務和保險 (BFSI)、政府及其他)進行細分。此外,也依外形規格(機架式及其他)及介面(SAS/SATA 及其他)進行細分。所有細分市場的規模和預測均以美元 (USD) 計價。
新加坡資料中心儲存市場趨勢及洞察。
政府的「綠色直流」電力分配政策正在加速快閃記憶體儲存的普及應用。
新加坡已獲得300兆瓦的新增電力供應能力,其中200兆瓦將優先分配給可再生能源用戶,從而鼓勵買家採用符合嚴格PUE 1.3閾值的低功耗全Flash陣列。使用者回饋,與機械硬碟相比,全快閃陣列可節省高達85%的電力,並顯著減少機架面積。新加坡某政府部門近期透過部署Pure Storage系統,減少了94%的占地面積。這清楚地表明,該政策正在加速快閃記憶體技術的普及應用。該政策為早期採用者提供優先電力分配,從而創造了競爭優勢,並加速了新加坡資料中心儲存市場對快閃記憶體儲存的需求。
NVMe 的效能對於 AI 工作負載至關重要。
生成式人工智慧模型為傳統儲存設計帶來了壓力,但NVMe的平行隊列消除了高容量GPU叢集的關鍵延遲瓶頸。鎧俠的122.88TB企業級固態硬碟與美光的6500 ION系列固態硬碟均在提升吞吐量的同時降低了機架電力消耗。這些效能提升縮短了人工智慧訓練週期,促使雲端服務供應商將NVMe指定為新加坡資料中心儲存市場新增容量的標準。
高昂的初始投資(資本支出)是推廣應用的一大障礙。
全Flash陣列的購買成本仍然是硬碟儲存系統的兩到三倍,這給中型企業的預算帶來了壓力。此外,電源升級和冷卻系統維修的額外成本也延長了投資回收期。雖然儲存即服務 (STaaS) 模式可以部分抵消資本支出,但它也引發了受監管工作負載的資料主權問題,減緩了新加坡資料中心儲存市場的成長。
細分市場分析
預計到2025年,儲存區域網路(SAN) 將佔據46.85%的市場佔有率,這反映出其在金融和電信等需要低延遲區塊儲存的應用領域中,作為高效能基礎的地位。 NAS 的複合年成長率 (CAGR) 為5.12%,其靈活的文件協定正滿足關鍵協作工作負載和邊緣資料擷取應用情境的需求。在新加坡的資料中心儲存市場,這兩種技術在混合環境中持續融合,並增加了物件儲存層以支援長期歸檔。供應商的產品藍圖擴大提供整合管理層,使營運商能夠在不停機的情況下在 SAN 和 NAS 之間遷移資料集。
同時,美國專利US10917321B2中概述的解耦式記憶體架構,透過將運算和儲存分離,為最佳化資源利用率提供了一種新選擇(patents.google.com)。早期試點研究表明,提高利用率將減少閒置容量,這在新加坡資料中心儲存市場面臨日益成長的碳排放相關成本壓力之際,無疑是一項極具吸引力的優勢。
即使到了2025年,傳統硬碟陣列仍將佔據39.55%的市場佔有率,但全Flash陣列的成長速度將最快,複合年成長率(CAGR)將達到6.54%。這項轉變的驅動力在於效能的顯著提升,例如亞毫秒的延遲和高IOPS,這些提升直接改善了人工智慧和分析工作負載。新加坡資料中心儲存市場的規模反映了介質成本的下降和能源價格的上漲,而快閃記憶體的低「瓦/IO」特性更有利於市場發展。
公共部門專案清楚地展現了快閃記憶體儲存的經濟優勢。某部會的實施使機架空間減少了94%,能源成本降低了50%。快閃記憶體密度藍圖承諾在2026年實現150TB和300TB的隨身碟,預計將進一步加速HDD的淘汰。然而,新加坡資料中心儲存市場的中期前景表明,混合儲存系統仍將繼續用於二級工作負載。
其他好處
- Excel格式的市場預測(ME)表
- 3個月的分析師支持
目錄
第1章:引言
- 研究假設和市場定義
- 調查範圍
第2章:調查方法
第3章執行摘要
第4章 市場狀況
- 市場概覽
- 市場促進因素
- 政府向綠色資料中心分配 300 兆瓦電力,促進了對快閃儲存的資本投資。
- 擴展人工智慧基礎設施需要超低延遲的NVMe陣列。
- 數據主權相關法規激增(PDPA修正案)
- 擴展IT基礎設施並促進雲端採用
- 超大規模投資項目(Equinix、Digital Realty)
- 柔佛-新加坡經濟特區 (SEZ) 使得模組化跨境儲存艙的實現成為可能。
- 市場限制因素
- 企業儲存的初始資本投資成本較高
- 儘管暫停令已經解除,但土地和電力短缺問題仍然存在。
- SSD控制器供應鏈的波動(地緣政治因素)
- 碳排放稅增加和ESG合規成本
- 價值供應鏈分析
- 監理情勢
- 技術展望
- 波特五力模型
- 市場宏觀經濟趨勢的評估
第5章 市場規模與成長預測
- 儲存技術
- 網路附加儲存 (NAS)
- 儲存區域網路(SAN)
- 直接附加儲存(DAS)
- 物件存儲/磁帶存儲
- 依儲存類型
- 傳統硬碟陣列
- 全Flash陣列(AFA)
- 混合儲存
- 依資料中心類型
- 超大規模資料中心業者雲端服務供應商
- 託管設施
- 企業邊緣
- 最終用戶
- 資訊科技/通訊
- BFSI
- 政府/公共部門
- 媒體與娛樂
- 醫療保健和生命科學
- 製造業
- 按外形規格
- 機架安裝型
- 刀片模組化
- 可分離和可組合
- 透過介面
- SAS/SATA
- NVMe
- 光纖通道 iSCSI
第6章 競爭情勢
- 市場集中度
- 策略趨勢
- 市佔率分析
- 公司簡介
- Dell Technologies
- Hewlett Packard Enterprise
- NetApp
- Huawei Technologies
- Pure Storage
- Lenovo
- Fujitsu
- Oracle
- Seagate Technology
- Kingston Technology
- IBM
- Hitachi Vantara
- Western Digital
- Micron Technology
- Kioxia Singapore
- Amazon Web Services
- Microsoft Azure
- Inspur
- Supermicro
- Synology
- QNAP Systems
第7章 投資分析
第8章 市場機會與未來展望
- 未開發市場和未滿足需求的評估
According to Mordor Intelligence, Singapore data center storage market size in 2026 is estimated at USD 1.24 billion, growing from 2025 value of USD 1.20 billion with 2031 projections showing USD 1.46 billion, growing at 3.40% CAGR over 2026-2031.
This report is Segmented Into Storage Technology (Network Attached Storage (NAS), Storage Area Network (SAN) and More), Storage Type (Traditional Storage, and More), and End-User (IT & Telecommunication, BFSI, Government, and More). Form Factor (Rack-Mounted and ), Interface (SAS / SATA and More). The Market Sizes and Forecasts are Provided in Terms of Value (USD) for all the Segments.
Singapore Data Center Storage Market Trends and Insights
Government "Green DC" Power-Allocation Drives Flash Storage Adoption
Singapore earmarked 300 MW of new capacity, with 200 MW ring-fenced for operators using renewable energy, nudging buyers toward low-power all-flash arrays that fit within a strict 1.3 PUE threshold. Operators report up to an 85% power reduction versus HDD and significantly smaller rack footprints. A recent ministry refresh trimmed floor area by 94% after deploying Pure Storage systems, underscoring how policy catalyzes technology. The same policy grants early adopters preferential power allocation, creating a competitive edge that accelerates flash demand across the Singapore data center storage market.
AI Workloads Demand NVMe Performance Capabilities
Generative-AI models strain classical storage designs; NVMe's parallel queues eliminate latency bottlenecks vital for high-volume GPU clusters. Kioxia's 122.88 TB enterprise SSD and Micron's 6500 ION series each raise throughput while curbing rack power use. These performance gains shorten AI training cycles, prompting cloud providers to specify NVMe as a standard for new capacity in the Singapore data center storage market.
High Upfront Capex Creates Adoption Barriers
All-flash arrays still cost 2-3x more at purchase than HDD systems, straining budgets for mid-market firms Additional costs arise from power upgrades and cooling retrofits, extending payback periods. Storage-as-a-service models partly offset capex but can introduce sovereignty concerns for regulated workloads, tempering growth in the Singapore data center storage market.
Other drivers and restraints analyzed in the detailed report include:
- Data Sovereignty Rules Reshape Storage Architectures
- Expansion of IT Infrastructure and Cloud On-ramps
- Land and Power Constraints Persist Despite Policy Changes
For complete list of drivers and restraints, kindly check the Table Of Contents.
Segment Analysis
Storage Area Networks captured 46.85% share in 2025, reflecting their position as the performance backbone for financial and telco applications that demand low-latency block storage. NAS, scaling at 5.12% CAGR, is taking on collaborative workloads and edge ingestion use cases where flexible file protocols matter. The Singapore data center storage market continues to blend both technologies in hybrid estates that add object storage tiers for long-term archives. Vendor roadmaps increasingly offer unified management layers, allowing operators to shift datasets between SAN and NAS without downtime.
At the same time, disaggregated memory architectures outlined in US Patent US10917321B2 create an emerging option that separates compute from storage to optimize resource use patents.google.com. Early proofs suggest improved utilization rates that reduce stranded capacity, a compelling benefit as carbon-based cost pressures intensify across the Singapore data center storage market.
Traditional HDD arrays still hold 39.55% share in 2025, yet all-flash arrays rise the fastest at 6.54% CAGR. The switch is driven by tangible performance gains-sub-millisecond latency and higher IOPS-that directly improve AI and analytics workloads. The Singapore data center storage market size, reflecting both falling media costs and rising energy prices that favor flash's lower watt-per-IO profile.
Public-sector projects illustrate flash economics vividly: a ministerial deployment reduced rack space by 94% and cut energy bills in half. Flash density roadmaps that promise 150 TB and 300 TB drives by 2026 will only hasten HDD retirement, though hybrid systems remain in play for tier-2 workloads through the mid-term horizon of the Singapore data center storage market.
Complete Report Scope:
- By Storage Technology
- Network Attached Storage (NAS)
- Storage Area Network (SAN)
- Direct Attached Storage (DAS)
- Object and Tape Storage
- By Storage Type
- Traditional HDD Arrays
- All-Flash Arrays (AFA)
- Hybrid Storage
- By Data Center Type
- Hyperscalers/Cloud Service Provider
- Colocation Facilities
- Enterprise and Edge
- By End User
- IT and Telecommunication
- BFSI
- Government and Public Sector
- Media and Entertainment
- Healthcare and Life Sciences
- Manufacturing
- By Form Factor
- Rack-mounted
- Blade and Modular
- Disaggregated / Composable
- By Interface
- SAS / SATA
- NVMe
- Fibre Channel and iSCSI
List of Companies Covered in this Report:
- Dell Technologies
- Hewlett Packard Enterprise
- NetApp
- Huawei Technologies
- Pure Storage
- Lenovo
- Fujitsu
- Oracle
- Seagate Technology
- Kingston Technology
- IBM
- Hitachi Vantara
- Western Digital
- Micron Technology
- Kioxia Singapore
- Amazon Web Services
- Microsoft Azure
- Inspur
- Supermicro
- Synology
- QNAP Systems
Additional Benefits:
- The market estimate (ME) sheet in Excel format
- 3 months of analyst support
TABLE OF CONTENTS
1 Introduction
- 1.1 Study Assumptions and Market Definition
- 1.2 Scope of the Study
2 Research Methodology
3 Executive Summary
4 Market Landscape
- 4.1 Market Overview
- 4.2 Market Drivers
- 4.2.1 Government Green DC power-allocation (300 MW) unlocks flash-storage capex
- 4.2.2 AI build-outs demand ultra-low-latency NVMe arrays
- 4.2.3 Surge in data-sovereignty rules (PDPA amendments)
- 4.2.4 Expansion of IT infrastructure and cloud on-ramps
- 4.2.5 Hyperscale investment pipeline (Equinix, Digital Realty)
- 4.2.6 Johor-Singapore SEZ enabling modular cross-border storage pods
- 4.3 Market Restraints
- 4.3.1 High upfront capex of enterprise-grade storage
- 4.3.2 Land-and-power scarcity despite moratorium lift
- 4.3.3 SSD controller supply-chain volatility (geo-political)
- 4.3.4 Rising carbon-tax / ESG compliance costs
- 4.4 Value / Supply-Chain Analysis
- 4.5 Regulatory Landscape
- 4.6 Technological Outlook
- 4.7 Porters Five Forces
- 4.7.1 Threat of New Entrants
- 4.7.2 Bargaining Power of Buyers
- 4.7.3 Bargaining Power of Suppliers
- 4.7.4 Threat of Substitutes
- 4.7.5 Intensity of Competitive Rivalry
- 4.8 Assessment of Macro Economic Trends on the Market
5 Market Size and Growth Forecasts (Value)
- 5.1 By Storage Technology
- 5.1.1 Network Attached Storage (NAS)
- 5.1.2 Storage Area Network (SAN)
- 5.1.3 Direct Attached Storage (DAS)
- 5.1.4 Object and Tape Storage
- 5.2 By Storage Type
- 5.2.1 Traditional HDD Arrays
- 5.2.2 All-Flash Arrays (AFA)
- 5.2.3 Hybrid Storage
- 5.3 By Data Center Type
- 5.3.1 Hyperscalers/Cloud Service Provider
- 5.3.2 Colocation Facilities
- 5.3.3 Enterprise and Edge
- 5.4 By End User
- 5.4.1 IT and Telecommunication
- 5.4.2 BFSI
- 5.4.3 Government and Public Sector
- 5.4.4 Media and Entertainment
- 5.4.5 Healthcare and Life Sciences
- 5.4.6 Manufacturing
- 5.5 By Form Factor
- 5.5.1 Rack-mounted
- 5.5.2 Blade and Modular
- 5.5.3 Disaggregated / Composable
- 5.6 By Interface
- 5.6.1 SAS / SATA
- 5.6.2 NVMe
- 5.6.3 Fibre Channel and iSCSI
6 Competitive Landscape
- 6.1 Market Concentration
- 6.2 Strategic Moves
- 6.3 Market Share Analysis
- 6.4 Company Profiles (includes Global-level Overview, Market-level Overview, Core Segments, Financials as available, Strategic Information, Market Rank/Share, Products and Services, Recent Developments)
- 6.4.1 Dell Technologies
- 6.4.2 Hewlett Packard Enterprise
- 6.4.3 NetApp
- 6.4.4 Huawei Technologies
- 6.4.5 Pure Storage
- 6.4.6 Lenovo
- 6.4.7 Fujitsu
- 6.4.8 Oracle
- 6.4.9 Seagate Technology
- 6.4.10 Kingston Technology
- 6.4.11 IBM
- 6.4.12 Hitachi Vantara
- 6.4.13 Western Digital
- 6.4.14 Micron Technology
- 6.4.15 Kioxia Singapore
- 6.4.16 Amazon Web Services
- 6.4.17 Microsoft Azure
- 6.4.18 Inspur
- 6.4.19 Supermicro
- 6.4.20 Synology
- 6.4.21 QNAP Systems
7 Investment Analysis
8 Market Opportunities and Future Outlook
- 8.1 White-space and Unmet-need Assessment

 中國資料中心儲存:市場佔有率分析、產業趨勢與統計及成長預測(2026-2031)印尼資料中心儲存:市場佔有率分析、產業趨勢與統計及成長預測(2026-2031)印度資料中心儲存:市場佔有率分析、產業趨勢與統計及成長預測(2026-2032)德國資料中心儲存:市場佔有率分析、行業趨勢和統計數據以及成長預測(2026-2031 年)菲律賓資料中心儲存:市場佔有率分析、產業趨勢與統計及成長預測(2026-2031 年)越南資料中心儲存:市場佔有率分析、產業趨勢與統計及成長預測(2026-2031)馬來西亞資料中心儲存:市場佔有率分析、產業趨勢與統計及成長預測(2026-2031 年)
 2026-2030年全球伺服器儲存市場
 資料中心儲存市場-2026-2032年全球市場預測
 2026年全球儲存架構市場報告