


 |
市場調查報告書
商品編碼
2119808
印度資料中心儲存:市場佔有率分析、產業趨勢與統計及成長預測(2026-2032)India Data Center Storage - Market Share Analysis, Industry Trends & Statistics, Growth Forecasts (2026 - 2032) |
||||||

※ 本網頁內容可能與最新版本有所差異。詳細情況請與我們聯繫。
據 Mordor Intelligence 稱,印度資料中心儲存市場預計到 2026 年價值將達到 35.1 億美元,高於 2025 年的 29 億美元,預計到 2032 年將達到 110.5 億美元。
預計 2026 年至 2032 年的複合年成長率將達到 21.12%。
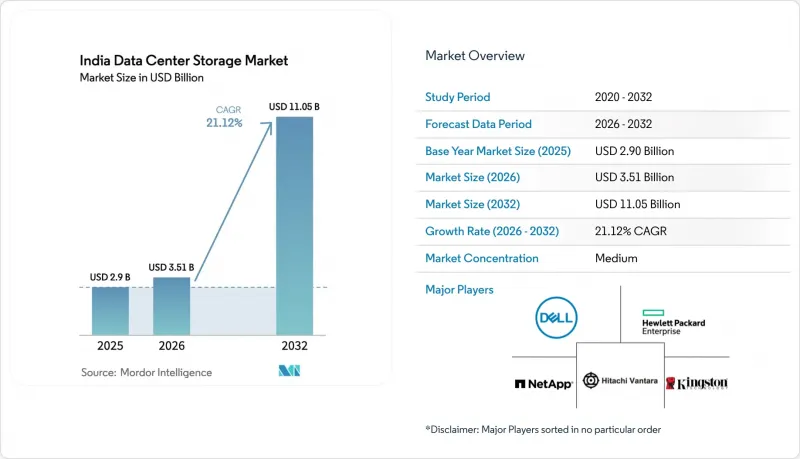
本報告按儲存技術(網路附加儲存、儲存區域網路及其他)、儲存類型(傳統儲存、全快閃儲存、混合式儲存)、資料中心類型(託管、超大規模/本地部署及其他)和最終用戶產業(IT/電信及其他)進行分類。市場預測以美元計價。
印度資料中心儲存市場趨勢及洞察。
IT基礎設施的擴展
在企業現代化進程的推動下,印度國內儲存容量持續翻番,預計2025年底將達到2070兆瓦,高於目前的1255兆瓦。與「數位印度」舉措相關的資料中心資本投資計畫預計到2027年將注入超過1,000億美元,這將加速對支援混合雲端部署的下一代陣列的需求。聯邦政府項目,例如國家資訊中心(NIC)投資6億美元的古瓦哈提建設項目,正在增加區域節點,這將重振服務於東北各邦的供應商生態系統。儲存架構師正在摒棄直接連接部署,轉而採用可在公共雲端、私有雲端和邊緣雲端之間互通的軟體定義堆疊,這進一步明確了印度資料中心儲存市場的收入前景。由於土地和電力價格飽和的大都會圈相比,像那格浦爾和賴布爾這樣的二線樞紐城市的總擁有成本 (TCO) 優勢日益增強,因此它們的重要性也日益凸顯,從而進一步拓展了商業機會。
增加對超大規模資料中心的投資
突破性的資本投資正在重塑印度的資料中心儲存市場。信實工業計畫投資300億美元在賈姆訥格爾建設的園區,目標是實現創紀錄的3GW IT負載,並針對需要大規模並行閃存陣列的人工智慧訓練叢集進行了最佳化。同時,由微軟、貝萊德和淡馬錫主導的300億美元「MGX計畫」財團,從亞洲14個候選地點中選定了孟買,凸顯了其在超大規模資料中心領域的持續發展勢頭。
谷歌斥資 60 億美元在維沙卡帕特南建設的資料中心鞏固了「主權雲」的概念,並進一步強化了在地化的儲存需求。這些大型企劃正推動採購趨勢轉向 NVMe-oF、剪切機編碼和高級分層存儲,從而幫助超大規模資料中心業者資料中心降低延遲和能耗。這種連鎖反應正迫使印度資料中心儲存市場的現有供應商轉向開放 API 和計量收費模式。
高昂的初始投資成本
平均建造成本約為每兆瓦540萬美元,其中儲存佔預算的15%至20%,這對融資有限的公司來說是一筆不小的負擔。雖然全Flash陣列性能卓越,但其平均售價(ASP)高於混合產品,導致中小企業的更新換代週期延長。孟買和班加羅爾高昂的機房租金進一步加劇了人們對整體擁有成本(TCO)的擔憂,使得基於營運成本(OPEX)的「儲存即服務(STaaS)」模式更具吸引力。日立Vantara和戴爾等供應商正在擴展其計量收費服務,允許用戶靈活調整容量和效能,從而在一定程度上緩解印度資料中心儲存市場的這些限制。
細分市場分析
預計到2025年,儲存區域網路(SAN)將繼續主導印度資料中心儲存市場,市場佔有率高達45.40%,這主要得益於銀行、金融和保險(BFSI)以及通訊平台對關鍵任務資料庫區塊級吞吐量的需求。儘管SAN架構資本密集,但它能夠提供高事務工作負載所需的穩定延遲和強大的分區能力。印度國家銀行的YONO服務擴展,將6,400萬行動用戶連接到低延遲的Oracle RAC叢集,凸顯了SAN的重要性。隨著一級銀行資料庫整合的推進,預計基於SAN部署的印度資料中心儲存市場規模將穩定成長。同時,受孟買和海得拉巴地區媒體製作公司串流、設計協作和分析工作負載的推動,網路附加儲存(NAS)預計到2032年將以18.97%的複合年成長率成長。
從笨重的檔案伺服器遷移到叢集NAS系統,有助於資料民主化並簡化橫向擴展。 QNAP和NetApp等廠商正在整合多重通訊協定訪問,允許客戶在統一的陣列中切換SAN和NAS模式。直連配置在邊緣節點領域仍佔有一席之地,在這些節點上,簡易性比可擴展性更為重要;而軟體定義儲存則在科技新創公司中建立其初始框架,這些新創公司被通用硬體的經濟性所吸引。總體而言,隨著法令遵循採用提供審計追蹤和不可變簡介的架構,混合協議策略有望提高印度資料中心儲存市場的柔軟性。
預計到2025年,全Flash陣列將佔據印度資料中心儲存市場38.10%的佔有率,並以17.05%的複合年成長率持續成長,這反映出其性價比的成熟度。大規模人工智慧訓練叢集需要Petabyte級快閃記憶體池來最大限度地減少GPU空閒時間,而傳統的HDD儲存層無法滿足這項需求。隨著企業運行對延遲敏感的金融科技和OTT工作負載,預計印度資料中心儲存市場中快閃記憶體系統的規模將進一步擴大。
傳統機械硬碟在歸檔層仍佔有一席之地,每TB成本仍是決定性因素。混合陣列,即前端採用固態硬碟(SSD),後端採用機械硬碟(HDD),為精明的首席資訊長(CIO)提供了過渡性的成本效益。三星和Acro等產業合作夥伴旨在透過擴大固態硬碟的供應管道和實現在地化供應來緩解NAND快閃記憶體價格的波動。隨著PCIe 5.0和支援區域命名空間的固態硬碟逐漸成為主流,預計單位I/O能耗將降低,從而進一步增強閃存在印度資料中心儲存市場的發展動能。
其他好處
- Excel格式的市場預測(ME)表
- 3個月的分析師支持
目錄
第1章:引言
- 研究假設和市場定義
- 調查範圍
第2章:調查方法
第3章執行摘要
第4章 市場狀況
- 市場概覽
- 市場促進因素
- IT基礎設施的擴展
- 增加對超大規模資料中心的投資
- 政府措施強制要求在國內儲存數據
- 人工智慧/機器學習工作負載的激增正在推動對高效能陣列的需求。
- 二、三線城市邊緣資料中心的興起
- 金融科技和數位支付生態系統的發展
- 市場限制因素
- 初始投資成本高
- 區域城市電力供應不穩定
- 依賴進口的零件價格波動
- 熟練倉儲專家短缺
- 價值供應鏈分析
- 監理情勢
- 技術展望
第5章 市場規模與成長預測
- 儲存技術
- 網路附加儲存 (NAS)
- 儲存區域網路(SAN)
- 直接附加儲存(DAS)
- 其他
- 依儲存類型
- 傳統儲存
- 全快閃儲存
- 混合儲存
- 依資料中心類型
- 搭配
- 超大規模,內部構建
- 企業邊緣模組化
- 按最終用戶行業分類
- 資訊科技/通訊
- BFSI
- 政府
- 媒體與娛樂
- 其他
第6章 競爭情勢
- 市佔率分析
- 公司簡介
- Dell Inc.
- Hewlett Packard Enterprise
- NetApp Inc.
- Hitachi Vantara LLC
- Kingston Technology Company Inc.
- Pure Storage Inc.
- Lenovo Group Limited
- Fujitsu Limited
- Oracle Corporation
- Seagate Technology LLC
- Cisco Systems Inc.
- IBM Corporation
- Huawei Technologies Co. Ltd.
- Western Digital Corporation
- Micron Technology Inc.
- Super Micro Computer Inc.
- Inspur Group
- Synology Inc.
- QNAP Systems Inc.
- Nimbus Data Inc.
- Zadara Storage Inc.
第7章 市場機會與未來展望
According to Mordor Intelligence, India data center storage market size in 2026 is estimated at USD 3.51 billion, growing from 2025 value of USD 2.90 billion with 2032 projections showing USD 11.05 billion, growing at 21.12% CAGR over 2026-2032.
This report is Segmented by Storage Technology (Network Attached Storage, Storage Area Network, and More), Storage Type (Traditional Storage, All-Flash Storage, Hybrid Storage), Data Center Type (Colocation, Hyperscale/Self-built, and More), End-User Industry (IT and Telecommunication, and More). The Market Forecasts are Provided in Terms of Value (USD).
India Data Center Storage Market Trends and Insights
Expansion of IT Infrastructure
Enterprise modernization continues to double national capacity, rising from 1,255 MW to an expected 2,070 MW by end-2025. Data center capex programs tied to the Digital India initiative inject over USD 100 billion through 2027, pulling forward demand for next-generation arrays that underpin hybrid-cloud rollouts. Federal projects such as the National Informatics Centre's USD 600 million Guwahati build add regional nodes that stimulate vendor ecosystems serving northeastern states. Storage architects are retiring direct-attached deployments in favor of software-defined stacks that interoperate across public, private, and edge clouds, reinforcing revenue visibility for the India data center storage market. Secondary hubs such as Nagpur and Raipur gain relevance because land and power pricing widen TCO advantages over saturated metros, further decentralizing opportunities.
Increased Investments in Hyperscale Data Centers
Landmark capital outlays are reshaping the India data center storage market. Reliance Industries' planned USD 30 billion Jamnagar campus targets a record 3 GW IT load and is optimized for AI training clusters that need massively parallel flash arrays. In parallel, the USD 30 billion Project MGX consortium-anchored by Microsoft, BlackRock, and Temasek-selects Mumbai among fourteen Asia sites, underscoring sustained hyperscale momentum.
Google's USD 6 billion Visakhapatnam facility cements the sovereign-cloud narrative, further locking in localized storage demand. Such megaprojects tilt procurement toward NVMe-oF, erasure coding, and advanced tiering that help hyperscalers curb latency and power draw. The ripple effect compels incumbent vendors in the India data center storage market to pivot toward open APIs and consumption-based contracting.
High Initial Investment Cost
Average build costs hover at USD 5.4 million per MW, with storage absorbing 15-20% of budgets, impeding cash-constrained adopters . All-flash arrays, while performance-superior, command higher ASPs than hybrid peers, delaying refresh cycles within small enterprises. Premium colocation rents in Mumbai and Bengaluru compound TCO concerns, making opex-based storage-as-a-service models more enticing. Vendors such as Hitachi Vantara and Dell are scaling pay-per-use offerings that flex in capacity and performance, partially offsetting this restraint within the India data center storage market.
Other drivers and restraints analyzed in the detailed report include:
- Government Data-Localization Mandates
- AI/ML Workload Proliferation Driving High-Performance Arrays
- Import-Dependent Component Price Volatility
For complete list of drivers and restraints, kindly check the Table Of Contents.
Segment Analysis
Storage Area Networks continued to dominate the India data center storage market in 2025 with a 45.40% share, driven by BFSI and telecom platforms that mandate block-level throughput for mission-critical databases. Although capital intensive, SAN fabrics deliver consistent latency and robust zoning required for high-transaction workloads. State Bank of India's YONO expansion underscores SAN relevance by anchoring 64 million mobile users on low-latency Oracle RAC clusters. The India data center storage market size for SAN-based deployments is projected to rise steadily as tier-1 banks consolidate databases. At the same time, Network Attached Storage posts a 18.97% CAGR through 2032, fueled by streaming, design collaboration, and analytics workloads in media production houses around Mumbai and Hyderabad.
Migration from cumbersome file servers to clustered NAS advances data democratization and simplifies scale-out growth. Vendors such as QNAP and NetApp now bundle multiprotocol access, enabling customers to toggle between SAN and NAS modalities within unified arrays. Direct-attached configurations retain niche roles at edge nodes where simplicity trumps scalability, while software-defined storage is carving early footholds among tech startups attracted to commodity hardware economics. Overall, blended protocol strategies are expected to elevate flexibility across the India data center storage market as compliance rules favor architectures providing audit trails and immutable snapshots.
All-flash arrays already captured 38.10% of the India data center storage market share in 2025 and are projected to compound at 17.05% annually, reflecting maturing price-performance economics. Large AI training clusters require petabyte-scale flash pools to minimize GPU idle time, an imperative that conventional HDD tiers cannot satisfy. The India data center storage market size for flash systems is poised to grow as organizations execute latency-critical fintech and OTT workloads.
Traditional spinning media endures within archival tiers, where cost per TB remains decisive. Hybrid arrays marry SSD front-ends with HDD back-ends, offering transitional economics for cautious CIOs. Industry alliances such as Samsung-Acro aim to widen SSD accessibility and localize supply to cushion NAND price swings. As PCIe 5.0 and zoned-namespace SSDs mainstream, unit energy per I/O is set to decline, reinforcing flash momentum within the India data center storage market.
Complete Report Scope:
- By Storage Technology
- Network Attached Storage (NAS)
- Storage Area Network (SAN)
- Direct Attached Storage (DAS)
- Other Technologies
- By Storage Type
- Traditional Storage
- All-Flash Storage
- Hybrid Storage
- By Data Center Type
- Colocation
- Hyperscale / Self-built
- Enterprise / Edge / Modular
- By End-User Industry
- IT and Telecommunication
- BFSI
- Government
- Media and Entertainment
- Other End Users
List of Companies Covered in this Report:
- Dell Inc.
- Hewlett Packard Enterprise
- NetApp Inc.
- Hitachi Vantara LLC
- Kingston Technology Company Inc.
- Pure Storage Inc.
- Lenovo Group Limited
- Fujitsu Limited
- Oracle Corporation
- Seagate Technology LLC
- Cisco Systems Inc.
- IBM Corporation
- Huawei Technologies Co. Ltd.
- Western Digital Corporation
- Micron Technology Inc.
- Super Micro Computer Inc.
- Inspur Group
- Synology Inc.
- QNAP Systems Inc.
- Nimbus Data Inc.
- Zadara Storage Inc.
Additional Benefits:
- The market estimate (ME) sheet in Excel format
- 3 months of analyst support
TABLE OF CONTENTS
1 INTRODUCTION
- 1.1 Study Assumptions and Market Definition
- 1.2 Scope of the Study
2 RESEARCH METHODOLOGY
3 EXECUTIVE SUMMARY
4 MARKET LANDSCAPE
- 4.1 Market Overview
- 4.2 Market Drivers
- 4.2.1 Expansion of IT infrastructure
- 4.2.2 Increased investments in hyperscale data centers
- 4.2.3 Government data-localisation mandates
- 4.2.4 AI/ML workload proliferation driving high-performance arrays
- 4.2.5 Rise of edge data centers in tier-2/3 cities
- 4.2.6 Growth of fintech and digital payments ecosystem
- 4.3 Market Restraints
- 4.3.1 High initial investment cost
- 4.3.2 Unreliable power supply in secondary cities
- 4.3.3 Import-dependent component price volatility
- 4.3.4 Shortage of skilled storage professionals
- 4.4 Value / Supply-Chain Analysis
- 4.5 Regulatory Landscape
- 4.6 Technological Outlook
5 MARKET SIZE and GROWTH FORECASTS
- 5.1 By Storage Technology
- 5.1.1 Network Attached Storage (NAS)
- 5.1.2 Storage Area Network (SAN)
- 5.1.3 Direct Attached Storage (DAS)
- 5.1.4 Other Technologies
- 5.2 By Storage Type
- 5.2.1 Traditional Storage
- 5.2.2 All-Flash Storage
- 5.2.3 Hybrid Storage
- 5.3 By Data Center Type
- 5.3.1 Colocation
- 5.3.2 Hyperscale / Self-built
- 5.3.3 Enterprise / Edge / Modular
- 5.4 By End-User Industry
- 5.4.1 IT and Telecommunication
- 5.4.2 BFSI
- 5.4.3 Government
- 5.4.4 Media and Entertainment
- 5.4.5 Other End Users
6 COMPETITIVE LANDSCAPE
- 6.1 Market Share Analysis
- 6.2 Company Profiles (includes Global level Overview, Market level overview, Core Segments, Financials as available, Strategic Information, Market Rank/Share for key companies, Products and Services, and Recent Developments)
- 6.2.1 Dell Inc.
- 6.2.2 Hewlett Packard Enterprise
- 6.2.3 NetApp Inc.
- 6.2.4 Hitachi Vantara LLC
- 6.2.5 Kingston Technology Company Inc.
- 6.2.6 Pure Storage Inc.
- 6.2.7 Lenovo Group Limited
- 6.2.8 Fujitsu Limited
- 6.2.9 Oracle Corporation
- 6.2.10 Seagate Technology LLC
- 6.2.11 Cisco Systems Inc.
- 6.2.12 IBM Corporation
- 6.2.13 Huawei Technologies Co. Ltd.
- 6.2.14 Western Digital Corporation
- 6.2.15 Micron Technology Inc.
- 6.2.16 Super Micro Computer Inc.
- 6.2.17 Inspur Group
- 6.2.18 Synology Inc.
- 6.2.19 QNAP Systems Inc.
- 6.2.20 Nimbus Data Inc.
- 6.2.21 Zadara Storage Inc.
7 MARKET OPPORTUNITIES and FUTURE OUTLOOK
- 7.1 White-space and Unmet-Need Assessment

 中國資料中心儲存:市場佔有率分析、產業趨勢與統計及成長預測(2026-2031)印尼資料中心儲存:市場佔有率分析、產業趨勢與統計及成長預測(2026-2031)德國資料中心儲存:市場佔有率分析、行業趨勢和統計數據以及成長預測(2026-2031 年)新加坡資料中心儲存:市場佔有率分析、產業趨勢與統計及成長預測(2026-2031 年)菲律賓資料中心儲存:市場佔有率分析、產業趨勢與統計及成長預測(2026-2031 年)越南資料中心儲存:市場佔有率分析、產業趨勢與統計及成長預測(2026-2031)馬來西亞資料中心儲存:市場佔有率分析、產業趨勢與統計及成長預測(2026-2031 年)
 2026-2030年全球伺服器儲存市場
 資料中心儲存市場-2026-2032年全球市場預測
 2026年全球儲存架構市場報告