


 |
市場調查報告書
商品編碼
2119805
印尼資料中心儲存:市場佔有率分析、產業趨勢與統計及成長預測(2026-2031)Indonesia Data Center Storage - Market Share Analysis, Industry Trends & Statistics, Growth Forecasts (2026 - 2031) |
||||||

※ 本網頁內容可能與最新版本有所差異。詳細情況請與我們聯繫。
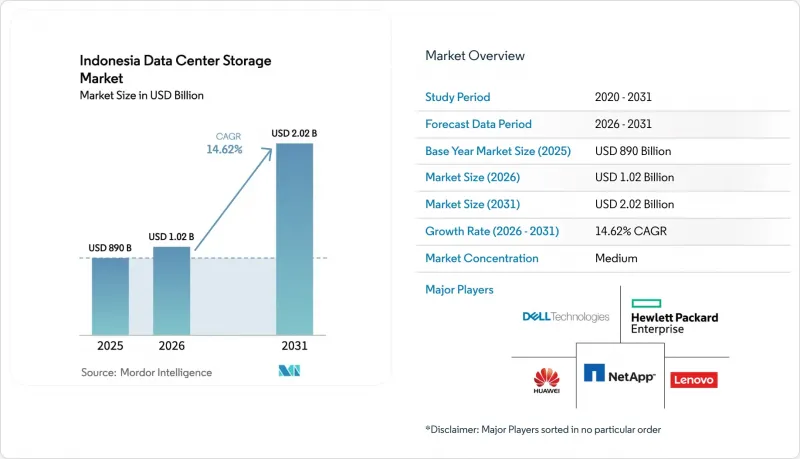
據 Mordor Intelligence 稱,印尼資料中心儲存市場預計到 2026 年價值將達到 10.2 億美元,高於 2025 年的 8.9 億美元,預計到 2031 年將達到 20.2 億美元。
預計 2026 年至 2031 年的複合年成長率為 14.62%。
本報告按儲存技術(網路附加儲存、儲存區域網路、其他)、儲存類型(傳統硬碟陣列、其他)、資料中心類型(託管機房、其他)、最終用戶(IT/電信、銀行、金融服務和保險、其他)、外形規格(機架式、其他)和介面(SAS/SATA、NVMe、光纖通道/iSCSI)進行分類。市場預測以美元計價。
印尼資料中心儲存市場趨勢及洞察。
全國範圍內的IT基礎設施擴展
隨著全國骨幹網的部署,容量正從雅加達轉移到514個市鎮,這要求營運商採用分散式儲存拓撲結構,以確保在17,000個島嶼上提供低延遲服務。印尼電信正在將光纖網路擴展到1000萬戶家庭,並加速部署用於影片快取和物聯網遙測的邊緣儲存節點。行動數據消費量的成長(與2013年相比成長了50倍)正在擴大總儲存容量,而各市鎮的「智慧城市」計畫則創造了數十個微需求點。因此,供應商正將重點轉向聯合SAN和物件存儲,即使在頻寬受限的站點也能自主運作。這一趨勢正在為印尼資料中心儲存市場解決方案的長期成長奠定基礎,這些解決方案將自癒能力與輕量級管理堆疊相結合。
增加對超大規模設施的投資
微軟斥資17億美元打造的雲端區域正在為人工智慧基礎設施樹立新的標竿。該區域將GPU叢集與NVMe-oF架構結合,實現了低於100微秒的延遲。 Digital Realty與Bersama Digital Infrastructure Asia成立的1億美元合資企業,展示了全球企業如何透過共用結構滿足本地合規要求。位於雅加達和巴淡島的超大規模叢集集中了電力、光纖和中立的託管服務,從而降低了每Terabyte的成本,並加快了向全快閃陣列的升級週期。小規模供應商正競相維修舊設施以保持競爭力,這推動了印尼資料中心儲存市場升級的良性循環。這股資金湧入正在加速下一代儲存協議的部署,並加劇了服務等級承諾的競爭。
最新儲存陣列的初始資本支出高度
企業級全快閃平台通常售價超過50萬美元,這對於融資有限的印尼企業而言構成了一道障礙。 2024年,半導體短缺進一步推高了採購成本,延長了前置作業時間,並延緩了更新換代。中小企業(SME)依賴租賃模式或繼續採用以硬碟(HDD)為中心的配置,導致營運成本(OPEX)居高不下,性能潛力受限。金融機構受嚴格的加密和審計法規約束,需要在其基礎硬體中添加合規模組,從而承擔更高的成本。這些資金外流阻礙了NVMe和軟體定義架構在印尼資料中心儲存市場的廣泛應用。
細分市場分析
在印尼資料中心儲存市場,SAN預計到2025年將達到2.325億美元,市佔率為26.12%。憑藉高效能區塊存取能力,SAN在核心銀行、計費和ERP工作負載領域保持著強勁的地位。同時,NAS正以14.78%的複合年成長率快速成長,因為區域分店透過在本地快取檔案並將其鏡像到總部來減少廣域網路流量。物件儲存和磁帶儲存仍然佔據小眾但重要的戰略地位。物件儲存用於保護OTT影片庫,而磁帶儲存則用於保護空氣間隙的合規性歸檔。
NAS 的成長凸顯了分散式運算的結構性轉變。零售連鎖店正在其 POS 系統附近部署雙控制器 NAS 集群,以確保即使在網路故障期間也能維持業務連續性。 SAN 廠商則透過捆綁 NVMe over Fabrics 技術來降低延遲,從而保護其在關鍵業務領域的市場佔有率。隨著混合環境的日趨成熟,編配工具能夠自動在 SAN、NAS 和物件池之間遷移資料集,從而最佳化印尼資料中心儲存市場,使其更好地匹配工作負載特性和成本限制。
預計到2025年,硬碟陣列仍將維持43.02%的市場佔有率,並繼續成為儲存冷數據和影片資料的首選。然而,全Flash陣列解決了金融科技和叫車應用中的延遲難題,推動快閃記憶體產品出貨量逐年激增。由於每GB成本更低、功耗更低(尤其是在兆瓦成本與全球燃料價格走勢密切相關的情況下),快閃記憶體的投資報酬率正在進一步提升。混合陣列填補了這一空白。自動化分層軟體可將未使用的資料區塊動態遷移到硬碟,進而降低30-40%的儲存成本。
此外,快閃記憶體有助於提高機架密度,預計到2031年,全Flash陣列(AFA)的年成長率將達到15.12%。據經銷商稱,主流AFA產品的前置作業時間不到六週,比經常滯留在丹戎不碌港的HDD批量出貨更具優勢。隨著NAND藍圖向3D-QLC發展,預計到2027年,印尼資料中心儲存市場在讀取密集型工作負載方面,NAND快閃記憶體和HDD的價格將趨於一致,這可能會加速從機械硬碟向快閃記憶體媒體的轉變。
其他好處
- Excel格式的市場預測(ME)表
- 3個月的分析師支持
目錄
第1章:引言
- 研究假設和市場定義
- 調查範圍
第2章:調查方法
第3章執行摘要
第4章 市場狀況
- 市場概覽
- 市場促進因素
- 全國範圍內的IT基礎設施擴展
- 增加對超大規模設施的投資
- 採用雲端運算的企業浪潮正在加速發展。
- 政府正在推動「印尼4.0」數位化進程。
- 為OTT和CCTV部署S3相容的物件儲存。
- 新海底電纜的鋪設實現了資料本地化。
- 市場限制因素
- 現代儲存陣列需要大量的初始資本支出(CAPEX)。
- 高技能倉儲管理人員短缺
- 電網可靠性不足導致總擁有成本上升。
- 地震和洪水風險推高了保險費和設計成本。
- 供應鏈分析
- 監理情勢
- 技術展望
- 波特五力分析
- 對影響市場的宏觀經濟因素進行評估
第5章 市場規模與成長預測
- 儲存技術
- 網路附加儲存 (NAS)
- 儲存區域網路(SAN)
- 直接附加儲存(DAS)
- 物件存儲/磁帶存儲
- 依儲存類型
- 傳統硬碟陣列
- 全Flash陣列(AFA)
- 混合儲存
- 依資料中心類型
- 託管設施
- 超大規模資料中心業者雲端服務供應商
- 企業邊緣
- 最終用戶
- 資訊科技/通訊
- BFSI
- 政府/公共部門
- 媒體與娛樂
- 醫療保健和生命科學
- 製造業
- 按外形規格
- 機架安裝型
- 刀片模組化
- 可分離和可組合
- 透過介面
- SAS/SATA
- NVMe
- 光纖通道 iSCSI
第6章 競爭情勢
- 市場集中度
- 策略趨勢
- 市佔率分析
- 公司簡介
- Dell Technologies
- Hewlett Packard Enterprise(HPE)
- Huawei Technologies
- NetApp
- Lenovo
- Fujitsu
- Seagate Technology
- Western Digital
- IBM
- Hitachi Vantara
- Pure Storage
- Kingston Technology
- Inspur
- Synology
- Oracle
- NEC
- QNAP Systems
- Supermicro
- Infortrend
- Micron Technology Inc.
第7章 市場機會與未來展望
According to Mordor Intelligence, Indonesia's data center storage market size in 2026 is estimated at USD 1.02 billion, growing from 2025 value of USD 890 million with 2031 projections showing USD 2.02 billion, growing at 14.62% CAGR over 2026-2031.
This report is Segmented by Storage Technology (Network-Attached Storage, Storage Area Network, and More), Storage Type (Traditional HDD Arrays and More ), Data Center Type (Colocation Facilities and More), End User (IT and Telecommunication, BFSI and More), Form Factor (Rack-Mounted and More), Interface(sas / SATA, Nvme, Fibre Channel and ISCSI). The Market Forecasts are Provided in Terms of Value (USD).
Indonesia Data Center Storage Market Trends and Insights
Expansion of IT Infrastructure Nationwide
Nationwide backbone roll-outs move capacity from Jakarta toward 514 municipalities, forcing operators to adopt distributed storage topologies that guarantee low-latency services across 17,000 islands. Telkom Indonesia has extended fiber to 10 million homes, stimulating edge-storage nodes for video caching and IoT telemetry. Rising mobile data consumption-up fifty-fold since 2013-magnifies aggregate storage volumes, while municipal "smart-city" projects create dozens of micro demand centers. Vendors, therefore, pivot to federated SAN and object stores capable of autonomous operations in bandwidth-constrained sites. This pattern anchors long-run growth for Indonesia data center storage market solutions that combine self-healing capabilities with lightweight management stacks.
Rising Investments in Hyperscale Facilities
Microsoft's USD 1.7 billion cloud region is setting a new benchmark for AI-ready infrastructure, pairing GPU clusters with NVMe-oF fabrics for sub-100-microsecond latency. Digital Realty's USD 100 million joint venture with Bersama Digital Infrastructure Asia shows how global firms secure local compliance through shared equity structures. Hyperscale clusters in Jakarta and Batam concentrate power, fiber, and neutral colocation, compressing per-terabyte pricing and accelerating refresh cycles toward all-flash arrays. Smaller providers rush to retrofit legacy halls to stay relevant, fuelling a virtuous upgrade loop in the Indonesia data center storage market. These capital flows shorten adoption timelines for next-generation storage protocols and intensify competition on service-level commitments.
High Upfront CAPEX for Modern Storage Arrays
All-flash platforms often exceed USD 500,000 for enterprise-grade sets, a hurdle for cash-constrained Indonesian firms. Semiconductor shortages amplified procurement costs in 2024, extending lead times and delaying refresh cycles. SMEs resort to leasing models or continue with HDD-centric layouts that inflate OPEX and limit performance headroom. Financial institutions, bound by stringent encryption and audit rules, face even higher bills when layering compliance modules onto base hardware. This capital drain postpones the broader penetration of NVMe and software-defined architectures within the Indonesian data center storage market.
Other drivers and restraints analyzed in the detailed report include:
- Accelerated Enterprise Cloud-Adoption Wave
- Government "Making Indonesia 4.0" Digital Push
- Shortage of Advanced Storage-Management Talent
For complete list of drivers and restraints, kindly check the Table Of Contents.
Segment Analysis
The Indonesian data center storage market size attributable to SAN reached USD 232.5 million in 2025, equal to a 26.12% share. High-performance block access keeps SAN entrenched in core banking, billing, and ERP workloads. Yet, NAS is expanding faster at a 14.78% CAGR as provincial branches cache files locally and then mirror to the capital, cutting WAN traffic. Object and tape retain niche but strategic seats: object captures OTT video libraries, whereas tape safeguards air-gapped compliance archives.
NAS growth underscores a structural tilt toward distributed compute. Retail chains deploy dual-controller NAS clusters near point-of-sale systems, sustaining operations during network outages. SAN vendors counter by bundling NVMe-over-Fabrics to shave latency, defending mission-critical shares. As hybrid footprints mature, orchestration tools automatically migrate datasets between SAN, NAS, and object pools, keeping the Indonesian data center storage market aligned with workload profiles and cost envelopes.
HDD arrays retained 43.02% revenue share in 2025, favored for cold data and video retention. Still, flash shipments surged year on year as all-flash arrays answered latency complaints in fintech and ride-hailing apps. Falling cost per gigabyte and power savings strengthen flash ROI, especially when megawatt tariffs track global fuel trends. Hybrid arrays bridge the gap: auto-tiering software dynamically demotes idle blocks to HDD, cutting capacity spend by 30-40%.
Flash also improves rack density, while all-flash arrays are growing at 15.12% through 2031. Distributors report lead times under six weeks for mainstream AFA SKUs, an edge over HDD batches that often queue at Tanjung Priok port. As the NAND roadmap heads to 3D-QLC, the Indonesian data center storage market anticipates parity pricing for read-intensive workloads by 2027, accelerating the rotation out of spinning media
Complete Report Scope:
- By Storage Technology
- Network Attached Storage (NAS)
- Storage Area Network (SAN)
- Direct Attached Storage (DAS)
- Object and Tape Storage
- By Storage Type
- Traditional HDD Arrays
- All-Flash Arrays (AFA)
- Hybrid Storage
- By Data Center Type
- Colocation Facilities
- Hyperscalers/Cloud Service Providers
- Enterprise and Edge
- By End User
- IT and Telecommunication
- BFSI
- Government and Public Sector
- Media and Entertainment
- Healthcare and Life Sciences
- Manufacturing
- By Form Factor
- Rack-mounted
- Blade and Modular
- Disaggregated / Composable
- By Interface
- SAS / SATA
- NVMe
- Fibre Channel and iSCSI
List of Companies Covered in this Report:
- Dell Technologies
- Hewlett Packard Enterprise (HPE)
- Huawei Technologies
- NetApp
- Lenovo
- Fujitsu
- Seagate Technology
- Western Digital
- IBM
- Hitachi Vantara
- Pure Storage
- Kingston Technology
- Inspur
- Synology
- Oracle
- NEC
- QNAP Systems
- Supermicro
- Infortrend
- Micron Technology Inc.
Additional Benefits:
- The market estimate (ME) sheet in Excel format
- 3 months of analyst support
TABLE OF CONTENTS
1 INTRODUCTION
- 1.1 Study Assumptions and Market Definition
- 1.2 Scope of the Study
2 RESEARCH METHODOLOGY
3 EXECUTIVE SUMMARY
4 MARKET LANDSCAPE
- 4.1 Market Overview
- 4.2 Market Drivers
- 4.2.1 Expansion of IT infrastructure nationwide
- 4.2.2 Rising investments in hyperscale facilities
- 4.2.3 Accelerated enterprise cloud-adoption wave
- 4.2.4 Government Making Indonesia 4.0 digital push
- 4.2.5 Uptake of S3-compatible object storage for OTT and CCTV
- 4.2.6 New submarine-cable landings enabling data-localisation
- 4.3 Market Restraints
- 4.3.1 High upfront CAPEX for modern storage arrays
- 4.3.2 Shortage of advanced storage-management talent
- 4.3.3 Grid-power unreliability inflating TCO
- 4.3.4 Seismic and flood risks boosting insurance/design costs
- 4.4 Supply-Chain Analysis
- 4.5 Regulatory Landscape
- 4.6 Technological Outlook
- 4.7 Porter's Five Forces Analysis
- 4.7.1 Threat of New Entrants
- 4.7.2 Bargaining Power of Buyers
- 4.7.3 Bargaining Power of Suppliers
- 4.7.4 Threat of Substitutes
- 4.7.5 Competitive Rivalry
- 4.8 Assessment of Macroeconomic Factors on the Market
5 MARKET SIZE and GROWTH FORECASTS (VALUE)
- 5.1 By Storage Technology
- 5.1.1 Network Attached Storage (NAS)
- 5.1.2 Storage Area Network (SAN)
- 5.1.3 Direct Attached Storage (DAS)
- 5.1.4 Object and Tape Storage
- 5.2 By Storage Type
- 5.2.1 Traditional HDD Arrays
- 5.2.2 All-Flash Arrays (AFA)
- 5.2.3 Hybrid Storage
- 5.3 By Data Center Type
- 5.3.1 Colocation Facilities
- 5.3.2 Hyperscalers/Cloud Service Providers
- 5.3.3 Enterprise and Edge
- 5.4 By End User
- 5.4.1 IT and Telecommunication
- 5.4.2 BFSI
- 5.4.3 Government and Public Sector
- 5.4.4 Media and Entertainment
- 5.4.5 Healthcare and Life Sciences
- 5.4.6 Manufacturing
- 5.5 By Form Factor
- 5.5.1 Rack-mounted
- 5.5.2 Blade and Modular
- 5.5.3 Disaggregated / Composable
- 5.6 By Interface
- 5.6.1 SAS / SATA
- 5.6.2 NVMe
- 5.6.3 Fibre Channel and iSCSI
6 COMPETITIVE LANDSCAPE
- 6.1 Market Concentration
- 6.2 Strategic Moves
- 6.3 Market Share Analysis
- 6.4 Company Profiles {(includes Global level Overview, Market level overview, Core Segments, Financials as available, Strategic Information, Market Rank/Share for key companies, Products and Services, and Recent Developments)}
- 6.4.1 Dell Technologies
- 6.4.2 Hewlett Packard Enterprise (HPE)
- 6.4.3 Huawei Technologies
- 6.4.4 NetApp
- 6.4.5 Lenovo
- 6.4.6 Fujitsu
- 6.4.7 Seagate Technology
- 6.4.8 Western Digital
- 6.4.9 IBM
- 6.4.10 Hitachi Vantara
- 6.4.11 Pure Storage
- 6.4.12 Kingston Technology
- 6.4.13 Inspur
- 6.4.14 Synology
- 6.4.15 Oracle
- 6.4.16 NEC
- 6.4.17 QNAP Systems
- 6.4.18 Supermicro
- 6.4.19 Infortrend
- 6.4.20 Micron Technology Inc.
7 MARKET OPPORTUNITIES and FUTURE OUTLOOK
- 7.1 White-space and Unmet-need Assessment

 中國資料中心儲存:市場佔有率分析、產業趨勢與統計及成長預測(2026-2031)印度資料中心儲存:市場佔有率分析、產業趨勢與統計及成長預測(2026-2032)德國資料中心儲存:市場佔有率分析、行業趨勢和統計數據以及成長預測(2026-2031 年)新加坡資料中心儲存:市場佔有率分析、產業趨勢與統計及成長預測(2026-2031 年)菲律賓資料中心儲存:市場佔有率分析、產業趨勢與統計及成長預測(2026-2031 年)越南資料中心儲存:市場佔有率分析、產業趨勢與統計及成長預測(2026-2031)馬來西亞資料中心儲存:市場佔有率分析、產業趨勢與統計及成長預測(2026-2031 年)
 2026-2030年全球伺服器儲存市場
 資料中心儲存市場-2026-2032年全球市場預測
 2026年全球儲存架構市場報告