

 |
市場調查報告書
商品編碼
2117537
北美資料中心房地產:市場佔有率分析、產業趨勢與統計及成長預測(2026-2031 年)North America Data Center Real Estate - Market Share Analysis, Industry Trends & Statistics, Growth Forecasts (2026 - 2031) |
||||||

※ 本網頁內容可能與最新版本有所差異。詳細情況請與我們聯繫。
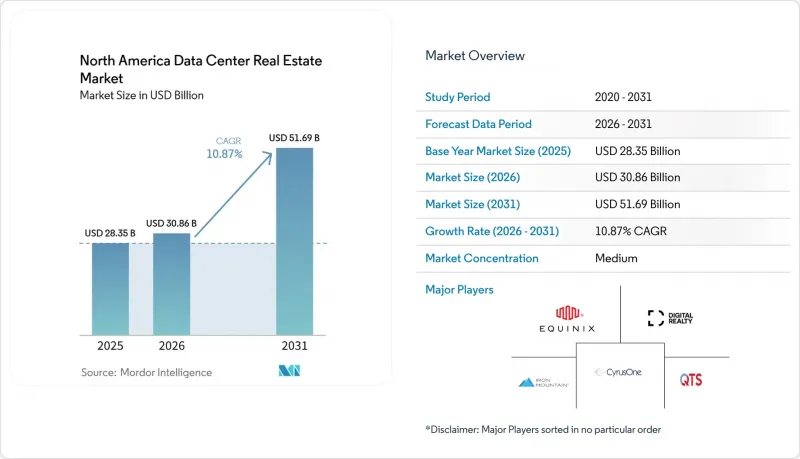
根據 Mordor Intelligence 預測,北美資料中心房地產市場規模將從 2025 年的 283.5 億美元成長到 2026 年的 308.6 億美元,然後在 2031 年達到 516.9 億美元,2026 年至 2031 年的複合年成長率為 10.87%。
本報告按物業類型(託管、超大規模、邊緣運算、模組化及其他)、所有權類型(租賃、公司自有)、公司規模(大型企業、中小企業)、最終用戶(資訊科技和電信及其他)以及地區(美國、加拿大和墨西哥)進行細分。市場預測以美元計價。
北美資料中心房地產市場的趨勢與洞察
對人工智慧和生成式人工智慧的需求正在加速託管服務的擴張。
人工智慧訓練和推理工作負載正在改變北美資料中心房地產市場的需求結構。與許多傳統企業應用相比,這些工作負載運作時間更長,對電力和冷卻環境的要求也更高。這提升了專用設施的價值,因為租戶需要可靠的容量,同時又不希望對其內部建設計畫造成長期延誤。此外,這種需求不僅限於超大規模資料中心業者;新型雲端供應商、模型服務公司和專注於GPU的平台也在爭奪同樣的房地產資源。這種競爭提升了那些能夠逐步擴展而不中斷運作中營運的資料中心的戰略價值。因此,北美資料中心房地產市場正受益於更廣泛的人工智慧基本客群,而非單一的租戶群。
創紀錄的低空置率正在推動積極的預租活動。
北美資料中心房地產市場空置率居高不下,導致租賃週期縮短。由於關鍵樞紐的高品質容量仍然有限,租戶越來越傾向於儘早簽訂合約。這一趨勢使業主能夠更清晰地了解收入前景,並增強貸款方對專案竣工前的信心。此外,業主還能更可靠地預測未來的現金流,進而促進大規模的開發案。與可靠目的地的早期合約降低了租賃風險,使業主能夠更專注於執行風險。因此,北美資料中心房地產市場吸引資本的原因不僅在於其旺盛的需求,還在於已簽訂合約的需求能夠及早顯現。
電網連接的延遲正在減緩資料中心的發展。
併網延遲仍是北美資料中心房地產市場的一大結構性限制。大型專案不僅依賴建築許可,還取決於電網的準備、變電站的建造以及電力公司的調度安排。即使土地和資金籌措已經到位,這些流程也常常會延誤專案進度。因此,開發商現在不再將未來的電力供應能力視為後續的執行任務,而是將其作為選址的核心要素。這種轉變使那些與電力公司關係密切且擁有良好業績記錄的開發商獲得了優勢。因此,儘管北美資料中心房地產市場仍然面臨電力短缺,但並非所有已宣布的項目都能按計劃推進。
細分市場分析
到2025年,託管服務將佔北美資料中心房地產市場佔有率的48.60%,鞏固其作為該市場最大收入來源的地位。企業外包、超大規模需求的外溢效應以及對快速獲取可用容量的需求,都為這一細分市場帶來了益處。在北美資料中心房地產行業,託管服務也為希望擴展業務而無需等待完全建成設施交付的租戶提供了靈活的選擇。超大規模資料中心仍然是第二大類別,並繼續與領先的交易對象簽訂長期租賃協議。隨著速度變得至關重要,而永久性基礎設施升級所需的時間又比租戶部署計劃更長,模組化方案的重要性日益凸顯。
預計到2031年,邊緣運算領域將以14.20%的複合年成長率成長,成為北美資料中心房地產市場中成長最快的資產類型。這一成長反映了人們對低延遲推理、分散式內容傳送以及更靠近用戶的本地處理日益成長的興趣。隨著人工智慧的應用從集中式模型訓練轉向可用於運作中的企業和消費級應用,邊緣運算資產的重要性日益凸顯。 「其他」類別的相對權重持續下降,因為在目前的電力、冷卻和合規性要求下,僅限企業使用的所有權模式已不再有效率。
預計到2025年,租賃業務將佔北美資料中心房地產市場規模的81.50%,這表明外包容量仍然是該市場的主要驅動力。預計到2031年,租賃業務將以11.4%的複合年成長率成長,成為成長最快的所有權模式。這一結果反映出,客製化建造(BTS)租賃模式比許多內部建設專案能夠更快地交付容量。此外,它還允許租戶長期掌控房地產資產,而無需累計其計入資產負債表。在北美資料中心房地產產業,這種模式是連接速度、柔軟性和規模的最佳橋樑。
隨著大型科技公司不斷建造和管理其旗艦園區,自有資料中心供應依然十分可觀。然而,由於長期客製化協議賦予租戶廣泛的營運控制權,租賃和自有主導中心之間的界線正變得模糊不清。這種轉變正在改變融資評估方式,因為一些租賃資產開始像擁有基礎設施支援的淨租賃物業一樣運作。這也意味著,在北美資料中心房地產市場,越來越多的佔有率正由客製化租賃結構而非標準的多租戶模式所支撐。
其他好處:
- Excel格式的市場預測(ME)表
- 3個月的分析師支持
目錄
第1章:引言
- 研究假設和市場定義
- 調查範圍
第2章:調查方法
第3章執行摘要
第4章 市場狀況
- 市場概覽
- 市場促進因素
- 對人工智慧和生成式人工智慧日益成長的需求正在加速託管服務的擴張。
- 創紀錄的低空置率促進了積極的預租活動。
- 電力供應情況將影響資料中心位置。
- 新興市場正在吸引對資料中心開發的投資。
- 現場發電增強了能源供應的穩定性。
- 海底電纜和互連的擴展正在增強互連互通。
- 市場限制因素
- 與電力公司並網的延誤正在減緩資料中心的發展。
- 由於變壓器和變電站設備短缺,該專案進度落後於計劃。
- 水資源可用性和製冷限制制約了新的開發項目。
- 電力成本上漲和電網限制加劇了營運風險。
- 價值供應鏈分析
- 供應鏈與生態系概述
- 主要原料、資源和供應商清單
- 主要銷售代理商和通路夥伴名單
- 主要最終用戶列表
- 監理情勢
- 技術展望
- 波特五力分析
第5章 市場規模與成長預測
- 按屬性類型
- 搭配
- 超大規模
- 邊緣資料中心屬性
- 模組化資料中心屬性
- 其他(批發、零售、B2B)
- 依所有權類型
- 租賃
- 房屋所有權
- 按公司規模
- 大公司
- 小型企業
- 最終用戶
- IT/通訊
- 銀行業、金融服務業及保險業
- 政府/公共部門
- 衛生保健
- 其他最終用戶
- 國家
- 美國
- 加拿大
- 墨西哥
第6章 競爭情勢
- 市場集中度
- 策略趨勢
- 市佔率分析
- 公司簡介
- Equinix, Inc.
- Digital Realty Trust, Inc.
- Iron Mountain Incorporated
- CyrusOne LLC
- QTS Realty Trust, LLC
- Vantage Data Centers LLC
- STACK Infrastructure
- NTT Global Data Centers
- CoreSite Realty Corporation
- Cologix, Inc.
- Flexential Corporation
- DataBank Holdings Ltd.
- EdgeConneX, Inc.
- Aligned Data Centers
- CloudHQ LLC
- Switch, Inc.
- Compass Datacenters
- Centersquare
- Prime Data Centers
- PowerHouse Data Centers
第7章 市場機會與未來展望
According to Mordor Intelligence, the North America data center real estate market size is expected to grow from USD 28.35 billion in 2025 to USD 30.86 billion in 2026 and is forecast to reach USD 51.69 billion by 2031 at 10.87% CAGR over 2026-2031.
This report is Segmented by Property Type (Colocation, Hyperscale, Edge, Modular, and Others), Ownership (Leased and Owner Occupied), Enterprise Size (Large Enterprises and Small and Medium Enterprises), End-Users (Information Technology and Telecom, and More), and Geography (United States, Canada, Mexico). The Market Forecasts are Provided in Terms of Value (USD).
North America Data Center Real Estate Market Trends and Insights
AI and Generative AI Demand Accelerates Colocation Expansion
AI training and inference workloads are changing the demand profile of the North America data center real estate market. These workloads run for longer periods and require denser power and cooling environments than many legacy enterprise applications. This makes specialized facilities more valuable because tenants need dependable capacity without long delays in internal build programs. The demand also extends beyond hyperscalers because neocloud providers, model-serving firms, and GPU-focused platforms now compete for the same real estate pipeline. That competition raises the strategic value of sites that can scale in stages without disrupting live operations. The North America data center real estate market, therefore, benefits from a broader AI customer base rather than from a single class of tenant.
Record-Low Vacancy Supports Strong Preleasing Activity
Tight vacancy conditions continue to shorten the leasing cycle across the North America data center real estate market. Tenants are increasingly willing to commit earlier because available high-quality capacity in major hubs remains limited. That behavior improves landlords' revenue visibility and gives lenders greater confidence in projects before delivery. It also supports larger development programs because owners can underwrite future cash flow with greater certainty. Early commitments from strong counterparties reduce lease-up risk and shift more attention toward execution risk. The North America data center real estate market is therefore attracting capital not only because demand is high, but also because contracted demand is visible earlier.
Utility Interconnection Delays Slow Data Center Development
Utility interconnection delays remain a structural constraint on the North America data center real estate market. Large projects need more than building permits because they depend on transmission readiness, substation work, and utility scheduling. These steps often stretch project timelines even when land and financing are already in place. Developers are responding by treating future power-delivery slots as a core part of site control rather than a later execution task. That change favors operators with established utility relationships and repeat development experience. The North America data center real estate market, therefore, remains capacity hungry, but not every announced project can move on the same timeline.
Other drivers and restraints analyzed in the detailed report include:
- Power Availability Drives Data Center Site Selection
- Frontier Markets Attract Data Center Development Investment
- Transformer and Substation Equipment Shortages Delay Project Delivery
For complete list of drivers and restraints, kindly check the Table Of Contents.
Segment Analysis
Colocation held 48.60% of the North America data center real estate market share in 2025, which confirms its role as the largest revenue pool in this market. The segment benefits from enterprise outsourcing, hyperscale overflow demand, and the need for fast access to ready capacity. In the North America data center real estate industry, colocation also offers a flexible path for tenants that want to scale without waiting for full self-build delivery. Hyperscale properties remain the second-largest category and continue to attract long lease structures with strong counterparties. Modular formats are gaining relevance where speed matters and permanent utility upgrades take longer than tenant deployment plans.
The edge segment is expected to grow at a 14.20% CAGR through 2031, making it the fastest-growing property type in the North America data center real estate market. Its growth reflects rising interest in low-latency inference, distributed content delivery, and localized processing closer to users. This property class is particularly relevant as AI serving moves from centralized model training into live enterprise and consumer applications. The Others category continues to lose relative weight because stand-alone enterprise ownership models are less efficient under current power, cooling, and compliance demands.
The leased segment accounted for 81.50% share of the North America data center real estate market size in 2025, which shows how strongly outsourced capacity still defines this market. The leased segment is projected to grow at a 11.4% CAGR through 2031, making it the fastest-growing ownership model. This outcome reflects the fact that build-to-suit leasing can deliver capacity faster than many self-build timelines. It also allows tenants to secure long-duration control without carrying the real estate asset on their own balance sheet. In the North America data center real estate industry, this model has become the clearest bridge between speed, flexibility, and scale.
Owner-occupied supply continues to matter because large technology companies still build and control major campuses directly. Even so, the line between leased and owner-directed capacity is becoming less rigid as long-term build-to-suit structures give tenants extensive operational control. That shift changes underwriting because some leased assets now behave more like infrastructure-backed net-lease properties. It also means a growing share of the North America data center real estate market is supported by customized lease structures rather than by standard multi-tenant formats.
Complete Report Scope:
- By Property Type
- Colocation
- Hyperscale
- Edge Data Center Properties
- Modular Data Center Properties
- Others (Wholesale, Retail and Enterprise)
- By Ownership
- Leased
- Owner Occupied
- By Enterprise Size
- Large Enterprises
- Small and Medium Enterprises
- By End-Users
- Information Technology and Telecom
- Banking, Financial Services, and Insurance
- Government and Public Sector
- Healthcare
- Other End Users
- By Country
- United States
- Canada
- Mexico
List of Companies Covered in this Report:
- Equinix, Inc.
- Digital Realty Trust, Inc.
- Iron Mountain Incorporated
- CyrusOne LLC
- QTS Realty Trust, LLC
- Vantage Data Centers LLC
- STACK Infrastructure
- NTT Global Data Centers
- CoreSite Realty Corporation
- Cologix, Inc.
- Flexential Corporation
- DataBank Holdings Ltd.
- EdgeConneX, Inc.
- Aligned Data Centers
- CloudHQ LLC
- Switch, Inc.
- Compass Datacenters
- Centersquare
- Prime Data Centers
- PowerHouse Data Centers
Additional Benefits:
- The market estimate (ME) sheet in Excel format
- 3 months of analyst support
TABLE OF CONTENTS
1 Introduction
- 1.1 Study Assumptions and Market Definition
- 1.2 Scope of the Study
2 Research Methodology
3 Executive Summary
4 Market Landscape
- 4.1 Market Overview
- 4.2 Market Drivers
- 4.2.1 AI and Generative AI Demand Accelerates Colocation Expansion
- 4.2.2 Record-Low Vacancy Supports Strong Preleasing Activity
- 4.2.3 Power Availability Drives Data Center Site Selection
- 4.2.4 Frontier Markets Attract Data Center Development Investment
- 4.2.5 On-Site Power Generation Enhances Energy Reliability
- 4.2.6 Subsea Cable and Interconnection Expansion Strengthens Connectivity
- 4.3 Market Restraints
- 4.3.1 Utility Interconnection Delays Slow Data Center Development
- 4.3.2 Transformer and Substation Equipment Shortages Delay Project Delivery
- 4.3.3 Water Availability and Cooling Constraints Limit New Developments
- 4.3.4 Rising Power Costs and Grid Curtailment Increase Operating Risks
- 4.4 Value / Supply-Chain Analysis
- 4.4.1 Overview of the Supply Chain and Ecosystem
- 4.4.2 List of Key Raw Materials, Resources & Suppliers
- 4.4.3 List of Major Distributors and Channel Partners
- 4.4.4 List of Major End Users
- 4.5 Regulatory Landscape
- 4.6 Technological Outlook
- 4.7 Porter's Five Forces Analysis
- 4.7.1 Bargaining Power of Suppliers
- 4.7.2 Bargaining Power of Consumers
- 4.7.3 Threat of New Entrants
- 4.7.4 Threat of Substitutes
- 4.7.5 Intensity of Competitive Rivalry
5 Market Size & Growth Forecasts (Value, USD)
- 5.1 By Property Type
- 5.1.1 Colocation
- 5.1.2 Hyperscale
- 5.1.3 Edge Data Center Properties
- 5.1.4 Modular Data Center Properties
- 5.1.5 Others (Wholesale, Retail and Enterprise)
- 5.2 By Ownership
- 5.2.1 Leased
- 5.2.2 Owner Occupied
- 5.3 By Enterprise Size
- 5.3.1 Large Enterprises
- 5.3.2 Small and Medium Enterprises
- 5.4 By End-Users
- 5.4.1 Information Technology and Telecom
- 5.4.2 Banking, Financial Services, and Insurance
- 5.4.3 Government and Public Sector
- 5.4.4 Healthcare
- 5.4.5 Other End Users
- 5.5 By Country
- 5.5.1 United States
- 5.5.2 Canada
- 5.5.3 Mexico
6 Competitive Landscape
- 6.1 Market Concentration
- 6.2 Strategic Moves
- 6.3 Market Share Analysis
- 6.4 Company Profiles (Includes Global Level Overview, Market Level Overview, Core Segments, Financials as Available, Strategic Information, Products and Services, Recent Developments)
- 6.4.1 Equinix, Inc.
- 6.4.2 Digital Realty Trust, Inc.
- 6.4.3 Iron Mountain Incorporated
- 6.4.4 CyrusOne LLC
- 6.4.5 QTS Realty Trust, LLC
- 6.4.6 Vantage Data Centers LLC
- 6.4.7 STACK Infrastructure
- 6.4.8 NTT Global Data Centers
- 6.4.9 CoreSite Realty Corporation
- 6.4.10 Cologix, Inc.
- 6.4.11 Flexential Corporation
- 6.4.12 DataBank Holdings Ltd.
- 6.4.13 EdgeConneX, Inc.
- 6.4.14 Aligned Data Centers
- 6.4.15 CloudHQ LLC
- 6.4.16 Switch, Inc.
- 6.4.17 Compass Datacenters
- 6.4.18 Centersquare
- 6.4.19 Prime Data Centers
- 6.4.20 PowerHouse Data Centers
7 Market Opportunities & Future Outlook
- 7.1 White-Space and Unmet-Need Assessment

 亞特蘭大資料中心:市場佔有率分析、產業趨勢與統計及成長預測(2026-2031 年)北維吉尼亞資料中心:市場佔有率分析、產業趨勢與統計及成長預測(2026-2031 年)雅加達資料中心:市場佔有率分析、產業趨勢與統計資料、成長預測(2026-2032 年)
 資料中心測試市場報告:趨勢、預測與競爭分析(至2035年)
 資料中心市場分析及預測(至2035年):類型、產品、服務、技術、組件、應用、部署、最終用戶、功能、解決方案中東和非洲資料中心房地產:市場佔有率分析、行業趨勢和統計數據以及成長預測(2026-2031 年)南美洲資料中心房地產:市場佔有率分析、產業趨勢與統計及成長預測(2026-2031 年)亞太地區資料中心房地產:市場佔有率分析、產業趨勢與統計及成長預測(2026-2031 年)歐洲資料中心房地產:市場佔有率分析、產業趨勢與統計及成長預測(2026-2031 年)資料中心房地產:市場佔有率分析、產業趨勢與統計、成長預測(2026-2031)