

 |
市場調查報告書
商品編碼
2117530
資料中心房地產:市場佔有率分析、產業趨勢與統計、成長預測(2026-2031)Data Center Real Estate - Market Share Analysis, Industry Trends & Statistics, Growth Forecasts (2026 - 2031) |
||||||

※ 本網頁內容可能與最新版本有所差異。詳細情況請與我們聯繫。
根據 Mordor Intelligence 預測,資料中心房地產市場規模將從 2025 年的 750 億美元和 2026 年的 825 億美元成長到 2031 年的 1424 億美元,2026 年至 2031 年的年複合成長率(CAGR)為 11.54%。
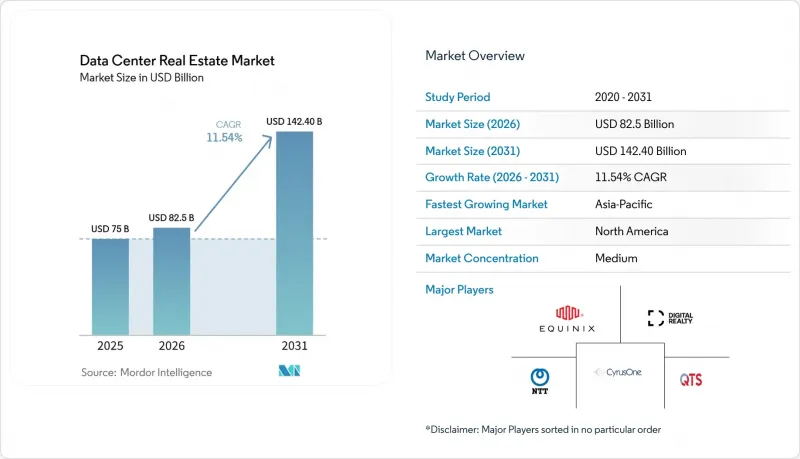
本報告按物業類型(託管、超大規模、邊緣資料中心等)、所有權類型(租賃和自有)、公司規模(大型企業和中小企業)、最終用戶(資訊技術和電信等)以及地區(北美、歐洲、亞太等)進行細分。市場預測以美元計價。
全球資料中心房地產市場趨勢及洞察
人工智慧工作負載正在推動對高效能資料中心設施的需求。
人工智慧正在改變資料中心房地產市場的實體需求。這是因為高密度運算需要更強大的電力、更充足的冷卻能力以及大規模連續的容量塊。這種變化不僅限於訓練叢集,推理流量也開始決定未來用戶和企業應用設施的選址。分散式推理將推動大規模園區和靠近需求中心的小規模節點的發展,因此這種變化對房地產決策至關重要。此外,技術壓力也不容忽視。新型伺服器平台的出現迫使營運商重新設計溫度控管系統,而不是簡單地擴展傳統佈局。 NVIDIA 於 2026 年發布了其「Rubin」伺服器平台,該平台採用全液冷設計,提高了新開發項目中人工智慧基礎設施的標準。
雲端運算和超大規模擴展正在加速容量成長。
隨著雲端運算的擴張,資料中心房地產市場持續受益,因為超大規模租戶對大規模容量的需求日益成長,且交付期限也越來越緊迫。這使得價值重心從單純囤積土地轉向能夠快速過渡到全面開發而無需長期延誤的地塊。這也有利於那些已經了解如何管理大型園區、協調公共產業以及簽訂長期租賃協議的營運商。如此規模的需求正在改變傳統的專案模式,因為300兆瓦或以上的容量需求正在影響開發商如何整合土地和電力,而不是僅僅出售建築物。因此,在資料中心房地產市場容量供應的高階領域,超大規模和託管策略之間的重疊程度越來越高。
併網延遲正在減緩新建資料中心的開發速度。
由於黃金位置的需求並非問題所在,資料中心房地產市場的主要營運限制因素在於併網時間。如果電力供應落後租戶需求數年,開發商就無法如預期時間表將土地和資本轉化為收益。這種延遲會削弱土地的經濟價值,迫使租戶提前簽署預租協議。此外,它還會擴大已建成項目與仍依賴不確定電力供應計劃的投機性項目之間的價值差距。因此,資料中心房地產市場不僅受數位需求成長的影響,也受能源基礎建設順序的影響。
細分市場分析
到2025年,託管資料中心將佔資料中心房地產市場佔有率的46.80%,繼續保持其在整體投資組合中的領先地位。這一細分市場持續受到尋求快速入駐、共用基礎設施和降低開發風險的租戶的青睞。這對於需要即時獲得容量而非耗時數年的建設週期的雲端平台、新型雲端供應商和企業而言尤其重要。主要託管資料中心的低空置率表明,在需求最成熟的區域,供應仍然緊張。在資料中心房地產市場,託管仍然是擴展性最強的途徑,因為它能夠在單一營運模式下同時滿足企業需求和超大規模溢出需求。
超大規模資料中心仍佔據第二大市場佔有率,因為最大的租戶仍需要園區式的場地和超大規模的電力供應。同時,邊緣資料中心預計在2031年將以15.20%的複合年成長率成長,成為目前市場結構中成長最快的資料中心類型。這一成長反映了對延遲敏感的推理處理、本地化應用傳輸和區域彈性規劃的日益普及。模組化資料中心也越來越受到關注,因為它們可以縮短部署週期,而傳統建設方式耗時過長。至於其他類型的資料中心,隨著業主管理的傳統設施被營運商主導、擁有更強大電力和冷卻能力的平台所取代,它們在資料中心房地產行業的相對佔有率持續下降。
預計到2025年,租賃物業將佔資料中心房地產市場佔有率的78.40%,並有望保持最高的成長率,到2031年複合年成長率(CAGR)預計為12.10%。這表明,自有產權模式不僅規模龐大,而且隨著需求的成長,其地位也不斷鞏固。租戶更傾向於租賃,因為它可以減輕資產負債表的負擔,縮短部署時間,並允許他們將部分開發風險轉移給專業營運商。隨著授權、設備採購和電力供應計劃越來越難以預測,這一趨勢變得越發重要。在資料中心房地產市場,租賃模式如今與策略速度以及物業本身的經濟效益密切相關。
該板塊的強勁勢頭也反映在穩定運作中資產的交易趨勢中。 2026年6月,Digital Realty同意以78億美元收購黑石集團在維吉尼亞北部三座已全部出租的資料中心的股份。這凸顯了高品質、長期租賃資產在核心市場中的價值之高。自用型資料中心繼續滿足國防、情報、中央銀行以及需要履行現場營運義務的公司的特定需求。客製化(BTS)模式進一步模糊了這一界限,它提供客製化的設施,而無需租戶直接擁有所有權。因此,資料中心房地產行業正在向一種新的模式轉變,在這種模式下,管理關鍵基礎設施比完全擁有實體資產更為重要。
區域分析
到2025年,北美將佔據資料中心房地產市場佔有率的37.80%,成為全球最大的區域收入貢獻者。美國仍然是主要驅動力,擁有最豐富的租戶基礎以及最集中的運作中平台和資本。同時,電力供應和許可證核准時間正成為該地區擴張面臨的最緊迫阻礙因素。加拿大作為大規模部署的鄰近樞紐,其重要性日益凸顯,使其成為一個極具吸引力的選擇,尤其對於那些尋求在園區開發和能源採購方面擁有更大柔軟性的運營商而言。墨西哥也吸引了許多近岸數位基礎設施策略的關注,這些策略旨在透過利用低延遲和區域一體化來滿足拉丁美洲的需求。
歐洲在資料中心房地產市場佔據重要佔有率,預計到2025年,新增供應仍將主要依賴FLAPD叢集。法蘭克福和倫敦憑藉其強大的網路連接、強勁的企業需求和成熟的營運商生態系統,仍然是區域活動的中心。然而,日益嚴格的永續性和報告要求提高了新加入經營者的合規門檻。這些趨勢促使人們更傾向於選擇大型、專業管理的資產,因為與小規模獨立設施相比,這些資產能夠更有效地滿足報告、效率和彈性方面的要求。
預計到2031年,亞太地區將以13.80%的複合年成長率成長,成為資料中心房地產市場成長速度最快的地區。該地區受益於強勁的數位化需求、超大規模企業的溢出效應、本地雲端的擴張以及各國鼓勵國內數據託管的各國政策。印度正崛起為結構相對開放的市場之一,擁有不斷成長的運作中能力基礎和持續的長期需求。馬來西亞和其他二線樞紐也受惠於新加坡需求的外流,新加坡正將部分區域擴張轉向其他供應地點。南美洲和中東及非洲雖然絕對規模較小,但稅收優惠、政府主導的數位化計畫以及大規模人工智慧相關園區計畫正在開闢新的發展方向,因此也備受關注。
其他好處:
- Excel格式的市場預測(ME)表
- 3個月的分析師支持
目錄
第1章:引言
- 研究假設和市場定義
- 調查範圍
第2章:調查方法
第3章執行摘要
第4章 市場狀況
- 市場概覽
- 市場促進因素
- 人工智慧工作負載正在推動對高功率資料中心設施的需求。
- 雲端運算和超大規模技術的擴張正在加速容量的成長。
- 資料在地化政策正在增加對國內資料中心的需求。
- 已獲批准並配備電力供應的土地正在吸引對資料中心的投資。
- 水冷技術的應用正在推動下一代資料中心的發展。
- 電錶背後的電力策略正在推動能源整合園區的擴張。
- 市場限制因素
- 併網延遲正在減緩新建資料中心的開發速度。
- 不斷上漲的建築和設備成本正在降低專案的盈利。
- 由於遭到當地居民的反對,資料中心計畫的批准被推遲。
- 氣候風險和不斷上漲的保險費加劇了企業營運的不確定性。
- 價值供應鏈分析
- 供應鏈與生態系概述
- 主要原料、資源和供應商清單
- 主要銷售代理商和通路夥伴名單
- 主要最終用戶列表
- 監理情勢
- 技術展望
- 波特五力分析
第5章 市場規模與成長預測
- 按屬性類型
- 搭配
- 超大規模
- 邊緣資料中心屬性
- 模組化資料中心屬性
- 其他(批發、零售、B2B)
- 依所有權類型
- 租賃
- 房屋所有權
- 按公司規模
- 大公司
- 小型企業
- 最終用戶
- IT/通訊
- 銀行業、金融服務業及保險業
- 政府/公共部門
- 衛生保健
- 其他最終用戶
- 按地區
- 北美洲
- 美國
- 加拿大
- 墨西哥
- 歐洲
- 英國
- 德國
- 法國
- 義大利
- 西班牙
- 俄羅斯
- 其他歐洲國家
- 亞太地區
- 中國
- 印度
- 日本
- 澳洲
- 韓國
- 東南亞(新加坡、馬來西亞、泰國、印尼、越南、菲律賓)
- 其他亞太國家
- 南美洲
- 巴西
- 阿根廷
- 其他南美國家
- 中東和非洲
- 沙烏地阿拉伯
- 阿拉伯聯合大公國
- 土耳其
- 南非
- 奈及利亞
- 其他中東和非洲國家
- 北美洲
第6章 競爭情勢
- 市場集中度
- 策略趨勢
- 市佔率分析
- 公司簡介
- Equinix, Inc.
- Digital Realty Trust, Inc.
- NTT Global Data Centers
- CyrusOne Inc.
- QTS Realty Trust, LLC
- Iron Mountain Incorporated
- STACK Infrastructure
- Vantage Data Centers LLC
- EdgeConneX, Inc.
- GDS Holdings Limited
- Global Switch Limited
- ST Telemedia Global Data Centres
- DATA4 Group
- Colt Data Centre Services
- NorthC Group BV
- Keppel Data Centres Pte. Ltd.
- AirTrunk
- Yondr Group
- AtlasEdge
- Teraco Data Environments(Pty)Ltd.
第7章 市場機會與未來展望
According to Mordor Intelligence, the data center real estate market size is projected to expand from USD 75 billion in 2025 and USD 82.5 billion in 2026 to USD 142.40 billion by 2031, registering a CAGR of 11.54% between 2026 to 2031.
This report is Segmented by Property Type (Colocation, Hyperscale, Edge Data Center Properties, and More), Ownership (Leased and Owner Occupied), Enterprise Size (Large Enterprises and Small and Medium Enterprises), End-Users (Information Technology and Telecom, and More), and Geography (North America, Europe, Asia-Pacific, and More). The Market Forecasts are Provided in Terms of Value (USD).
Global Data Center Real Estate Market Trends and Insights
AI Workloads Drive Demand for High-Power Data Center Facilities
AI is changing the physical requirements of the data center real estate market because higher-density compute needs more power, more cooling, and larger contiguous capacity blocks. This shift is not limited to training clusters, as inference traffic is beginning to shape where future facilities should sit relative to users and enterprise applications. That change matters for real estate decisions because distributed inference supports growth in both major campuses and smaller nodes closer to demand centers. The pressure is also technological, since new server platforms are forcing operators to redesign thermal systems rather than expand legacy layouts. NVIDIA released its Rubin server platform in 2026 with a fully liquid-cooled design, which raises the bar for AI-ready infrastructure across new developments.
Cloud and Hyperscale Expansion Accelerates Capacity Growth
The data center real estate market continues to benefit from cloud expansion, as hyperscale tenants still need large blocks of capacity amid increasingly compressed delivery schedules. This has shifted value away from simple land banking and toward sites that can move into active development without long delays. It also favors operators who already understand large-campus execution, utility coordination, and long-duration lease structuring. Demand at this scale is changing the typical project profile, as 300 MW and larger requirements now influence how developers assemble land and power rather than market a building. As a result, the data center real estate market is seeing stronger overlap between hyperscale and colocation strategies at the upper end of capacity delivery.
Power Grid Connection Delays Slow New Data Center Developments
Grid connection timing is the primary operating constraint in the data center real estate market, as demand is not the problem in most core locations. When power delivery trails tenant demand by several years, developers cannot convert land and capital into revenue on a predictable schedule. That delay weakens site economics and forces occupiers to prelease earlier than they otherwise would. It also increases the value gap between ready sites and speculative projects that still depend on uncertain utility timelines. The data center real estate market is therefore being shaped as much by energy infrastructure sequencing as by digital demand growth.
Other drivers and restraints analyzed in the detailed report include:
- Data Localization Policies Increase In-Country Data Center Demand
- Pre-Permitted Powered Sites Attract Data Center Investments
- High Construction and Equipment Costs Reduce Project Returns
For complete list of drivers and restraints, kindly check the Table Of Contents.
Segment Analysis
Colocation properties held 46.80% of the data center real estate market share in 2025, which kept this format in the leading position across the overall portfolio mix. The segment continues to benefit from tenants that want fast occupancy, shared infrastructure, and lower development exposure. This is especially important for cloud platforms, neocloud operators, and enterprises that need immediate capacity rather than a multiyear build cycle. Low vacancy in major colocation hubs also shows that supply remains tight in the most established demand corridors. In the data center real estate market, colocation still offers the broadest path to scale because it supports both enterprise demand and hyperscale overflow within a single operating model.
Hyperscale properties remain the second-largest segment because the largest tenants still require campus-style footprints and very large power commitments. At the same time, the edge data center properties segment is projected to expand at a 15.20% CAGR through 2031, making it the fastest-growing property format in the current mix. That growth reflects the spread of latency-sensitive inference, localized application delivery, and regional resilience planning. Modular properties are also gaining interest because they shorten deployment timelines in markets where traditional construction can take too long. The remaining formats continue to lose relative weight in the data center real estate industry as owner-managed legacy facilities give way to operator-led platforms with stronger power and cooling capabilities.
Leased properties accounted for 78.40% of the data center real estate market share in 2025 and also carry the fastest projected CAGR at 12.10% through 2031. This shows that the leading ownership model is not only large but also continues to strengthen as demand increases. Tenants favor leasing because it reduces balance sheet burden, shortens time to deployment, and transfers part of the development risk to specialist operators. That preference has become even more important as permitting, equipment procurement, and power delivery timelines have become less predictable. In the data center real estate market, the lease model is now tied as much to strategic speed as to real estate economics.
The strength of this segment is also visible in transaction activity for stabilized leased assets. In June 2026, Digital Realty agreed to acquire Blackstone's interests in three fully leased Northern Virginia data centers for USD 7.8 billion, highlighting how premium, long-term-leased assets are being valued in core markets. Owner-occupied properties still serve specific needs in defense, intelligence, central banking, and enterprises with retained on-premises obligations. Build-to-suit structures further blur the line because they give tenants tailored facilities without requiring direct ownership. The data center real estate industry is therefore moving toward a model where control of mission-critical infrastructure matters more than owning the physical asset outright.
Complete Report Scope:
- By Property Type
- Colocation
- Hyperscale
- Edge Data Center Properties
- Modular Data Center Properties
- Others (Wholesale, Retail and Enterprise)
- By Ownership
- Leased
- Owner Occupied
- By Enterprise Size
- Large Enterprises
- Small and Medium Enterprises
- By End-Users
- Information Technology and Telecom
- Banking, Financial Services, and Insurance
- Government and Public Sector
- Healthcare
- Other End Users
- By Geography
- North America
- United States
- Canada
- Mexico
- Europe
- United Kingdom
- Germany
- France
- Italy
- Spain
- Russia
- Rest of Europe
- Asia-Pacific
- China
- India
- Japan
- Australia
- South Korea
- SouthEast Asia (Singapore, Malaysia, Thailand, Indonesia, Vietnam, and Philippines)
- Rest of Asia-Pacific
- South America
- Brazil
- Argentina
- Rest of South America
- Middle East and Africa
- Saudi Arabia
- United Arab Emirates
- Turkey
- South Africa
- Nigeria
- Rest of Middle East and Africa
- North America
Geography Analysis
North America held 37.80% of the data center real estate market share in 2025, making it the largest regional contributor to global revenue. The United States remained the main anchor because it combines the deepest tenant pool with the largest concentration of operating platforms and capital. At the same time, the region is also where power delivery and approval timing are becoming the most immediate constraints on expansion. Canada is gaining relevance as an adjacent option for large-scale deployments, especially for operators seeking greater flexibility in campus development and energy sourcing. Mexico is also drawing interest from nearshore digital infrastructure strategies that aim to serve Latin American demand with lower latency and regional alignment.
Europe accounted for a substantial share of the data center real estate market and continued to rely heavily on the FLAPD cluster for new supply additions in 2025. Frankfurt and London stayed at the center of regional activity because they combine deep connectivity, strong enterprise demand, and established operator ecosystems. Even so, tighter sustainability and reporting expectations are raising the compliance threshold for newer entrants. That dynamic supports larger, professionally managed assets that can absorb reporting, efficiency, and resilience requirements more effectively than small standalone facilities.
Asia-Pacific is projected to advance at a 13.80% CAGR through 2031, giving it the fastest regional growth rate in the data center real estate market. The region benefits from strong digital demand, hyperscale spillover, local cloud expansion, and a wider set of national policies that encourage in-country data hosting. India is emerging as one of the more structurally open markets because its live capacity base is growing while long-term demand remains broad. Malaysia and other secondary hubs are also gaining from Singapore overflow, which is redirecting some regional expansion into alternative supply locations. South America and the Middle East and Africa are smaller in absolute terms, but both regions are attracting attention where fiscal incentives, sovereign digital programs, and large AI-linked campus plans are creating new development corridors.
- Equinix, Inc.
- Digital Realty Trust, Inc.
- NTT Global Data Centers
- CyrusOne Inc.
- QTS Realty Trust, LLC
- Iron Mountain Incorporated
- STACK Infrastructure
- Vantage Data Centers LLC
- EdgeConneX, Inc.
- GDS Holdings Limited
- Global Switch Limited
- ST Telemedia Global Data Centres
- DATA4 Group
- Colt Data Centre Services
- NorthC Group B.V.
- Keppel Data Centres Pte. Ltd.
- AirTrunk
- Yondr Group
- AtlasEdge
- Teraco Data Environments (Pty) Ltd.
Additional Benefits:
- The market estimate (ME) sheet in Excel format
- 3 months of analyst support
TABLE OF CONTENTS
1 Introduction
- 1.1 Study Assumptions and Market Definition
- 1.2 Scope of the Study
2 Research Methodology
3 Executive Summary
4 Market Landscape
- 4.1 Market Overview
- 4.2 Market Drivers
- 4.2.1 AI Workloads Drive Demand for High-Power Data Center Facilities
- 4.2.2 Cloud and Hyperscale Expansion Accelerates Capacity Growth
- 4.2.3 Data Localization Policies Increase In-Country Data Center Demand
- 4.2.4 Pre-Permitted Powered Sites Attract Data Center Investments
- 4.2.5 Liquid-Cooling Adoption Supports Next-Generation Data Center Development
- 4.2.6 Behind-the-Meter Power Strategies Expand Energy-Integrated Campuses
- 4.3 Market Restraints
- 4.3.1 Power Grid Connection Delays Slow New Data Center Developments
- 4.3.2 High Construction and Equipment Costs Reduce Project Returns
- 4.3.3 Community Opposition Delays Data Center Project Approvals
- 4.3.4 Climate Risks and Rising Insurance Costs Increase Operating Uncertainty
- 4.4 Value / Supply-Chain Analysis
- 4.4.1 Overview of the Supply Chain and Ecosystem
- 4.4.2 List of Key Raw Materials, Resources & Suppliers
- 4.4.3 List of Major Distributors and Channel Partners
- 4.4.4 List of Major End Users
- 4.5 Regulatory Landscape
- 4.6 Technological Outlook
- 4.7 Porter's Five Forces Analysis
- 4.7.1 Bargaining Power of Suppliers
- 4.7.2 Bargaining Power of Consumers
- 4.7.3 Threat of New Entrants
- 4.7.4 Threat of Substitutes
- 4.7.5 Intensity of Competitive Rivalry
5 Market Size & Growth Forecasts (Value, USD)
- 5.1 By Property Type
- 5.1.1 Colocation
- 5.1.2 Hyperscale
- 5.1.3 Edge Data Center Properties
- 5.1.4 Modular Data Center Properties
- 5.1.5 Others (Wholesale, Retail and Enterprise)
- 5.2 By Ownership
- 5.2.1 Leased
- 5.2.2 Owner Occupied
- 5.3 By Enterprise Size
- 5.3.1 Large Enterprises
- 5.3.2 Small and Medium Enterprises
- 5.4 By End-Users
- 5.4.1 Information Technology and Telecom
- 5.4.2 Banking, Financial Services, and Insurance
- 5.4.3 Government and Public Sector
- 5.4.4 Healthcare
- 5.4.5 Other End Users
- 5.5 By Geography
- 5.5.1 North America
- 5.5.1.1 United States
- 5.5.1.2 Canada
- 5.5.1.3 Mexico
- 5.5.2 Europe
- 5.5.2.1 United Kingdom
- 5.5.2.2 Germany
- 5.5.2.3 France
- 5.5.2.4 Italy
- 5.5.2.5 Spain
- 5.5.2.6 Russia
- 5.5.2.7 Rest of Europe
- 5.5.3 Asia-Pacific
- 5.5.3.1 China
- 5.5.3.2 India
- 5.5.3.3 Japan
- 5.5.3.4 Australia
- 5.5.3.5 South Korea
- 5.5.3.6 SouthEast Asia (Singapore, Malaysia, Thailand, Indonesia, Vietnam, and Philippines)
- 5.5.3.7 Rest of Asia-Pacific
- 5.5.4 South America
- 5.5.4.1 Brazil
- 5.5.4.2 Argentina
- 5.5.4.3 Rest of South America
- 5.5.5 Middle East and Africa
- 5.5.5.1 Saudi Arabia
- 5.5.5.2 United Arab Emirates
- 5.5.5.3 Turkey
- 5.5.5.4 South Africa
- 5.5.5.5 Nigeria
- 5.5.5.6 Rest of Middle East and Africa
- 5.5.1 North America
6 Competitive Landscape
- 6.1 Market Concentration
- 6.2 Strategic Moves
- 6.3 Market Share Analysis
- 6.4 Company Profiles (Includes Global Level Overview, Market Level Overview, Core Segments, Financials as available, Strategic Information, Products and Services, Recent Developments)
- 6.4.1 Equinix, Inc.
- 6.4.2 Digital Realty Trust, Inc.
- 6.4.3 NTT Global Data Centers
- 6.4.4 CyrusOne Inc.
- 6.4.5 QTS Realty Trust, LLC
- 6.4.6 Iron Mountain Incorporated
- 6.4.7 STACK Infrastructure
- 6.4.8 Vantage Data Centers LLC
- 6.4.9 EdgeConneX, Inc.
- 6.4.10 GDS Holdings Limited
- 6.4.11 Global Switch Limited
- 6.4.12 ST Telemedia Global Data Centres
- 6.4.13 DATA4 Group
- 6.4.14 Colt Data Centre Services
- 6.4.15 NorthC Group B.V.
- 6.4.16 Keppel Data Centres Pte. Ltd.
- 6.4.17 AirTrunk
- 6.4.18 Yondr Group
- 6.4.19 AtlasEdge
- 6.4.20 Teraco Data Environments (Pty) Ltd.
7 Market Opportunities & Future Outlook
- 7.1 White-Space and Unmet-Need Assessment

 亞特蘭大資料中心:市場佔有率分析、產業趨勢與統計及成長預測(2026-2031 年)北維吉尼亞資料中心:市場佔有率分析、產業趨勢與統計及成長預測(2026-2031 年)雅加達資料中心:市場佔有率分析、產業趨勢與統計資料、成長預測(2026-2032 年)
 資料中心測試市場報告:趨勢、預測與競爭分析(至2035年)
 資料中心市場分析及預測(至2035年):類型、產品、服務、技術、組件、應用、部署、最終用戶、功能、解決方案中東和非洲資料中心房地產:市場佔有率分析、行業趨勢和統計數據以及成長預測(2026-2031 年)南美洲資料中心房地產:市場佔有率分析、產業趨勢與統計及成長預測(2026-2031 年)亞太地區資料中心房地產:市場佔有率分析、產業趨勢與統計及成長預測(2026-2031 年)北美資料中心房地產:市場佔有率分析、產業趨勢與統計及成長預測(2026-2031 年)歐洲資料中心房地產:市場佔有率分析、產業趨勢與統計及成長預測(2026-2031 年)