


 |
市場調查報告書
商品編碼
2119569
非洲SVOD市場:市場佔有率分析、產業趨勢與統計及成長預測(2026-2031年)Africa SVOD - Market Share Analysis, Industry Trends & Statistics, Growth Forecasts (2026 - 2031) |
||||||

※ 本網頁內容可能與最新版本有所差異。詳細情況請與我們聯繫。
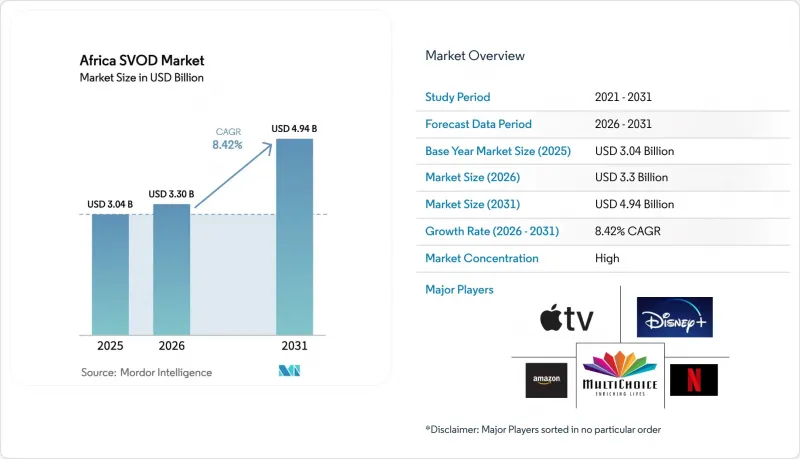
據 Mordor Intelligence 稱,2025 年非洲 SVOD 市值為 30.4 億美元,預計到 2031 年將從 2026 年的 33 億美元成長至 49.4 億美元,預測期(2026-2031 年)的複合年成長率為 8.42%。
本報告按內容類型(劇情、音樂、運動等)、收入模式(訂閱式視訊點播、付費式視訊點播)、裝置類型(智慧型手機、智慧電視、平板電腦、PC或筆記型電腦等)、年齡層(18-24歲、25-34歲、35-44歲、45歲以上)及地區(肯亞、南非、奈及利亞)進行細分。市場預測以美元計價。
非洲SVOD市場的趨勢與洞察
全球公司的進入加劇了競爭
全球平台正透過製作原創內容和建立發行合作關係,加深對非洲市場的關注。光是Netflix一家就已獲得283部奈及利亞影片的授權,並累計2,360萬美元用於進一步的內容開發,這表明其對該地區持續投資。儘管積極的在地化策略提升了其吸引力,但在價格敏感的市場中,不斷上漲的價格凸顯了獲利的難度。 Disney+正專注於在南非的擴張,而Amazon Prime Video則透過將電商優勢與其串流媒體服務相結合來打造差異化優勢。 Canal+憑藉著對MultiChoice的收購,已在50個國家擁有約5,000萬用戶,加劇了加值內容市場的競爭。
擴大經濟實惠的行動數據套餐
電信業者主導的數據流量套餐和零費率優惠正在推動串流媒體服務的普及。 Safaricom 透過提高光纖速度並推出行動和固網家庭共享套餐,直接應對 Starlink 的挑戰。 M-PESA Ratiba 的循環支付功能可自動收取訂閱費用,從而最大限度地降低用戶解約率。 Airtel 的虛擬萬事達卡允許 1.5 億行動支付用戶訂閱國際服務,降低了支付門檻,擴大了目標客戶群。這些預付套餐和微支付方式正在降低准入門檻,並維持整個非洲 SVOD 市場的需求。
持續高昂的訂閱費用與 ARPU(每位用戶平均收入)之間的衝突
價格上漲阻礙了用戶接受度,並引發了更嚴格的監管審查。 MultiChoice Nigeria在2025年將DStv的價格提高了22%以上,使月費達到44,500奈拉(約50.30美元),此舉引發了消費者的強烈不滿。加納當局警告稱,除非價格降低30%,否則將吊銷其許可證。 Netflix在奈及利亞兩年內三度漲價,凸顯了非洲SVOD市場成本回收與用戶負擔之間的矛盾。最終,這些高昂的價格收入比限制了低收入和農村用戶的使用。
細分市場分析
預計到2025年,電視劇將佔總收入的44.76%,鞏固其作為非洲SVOD市場核心組成部分的地位。雖然《血與水》等跨界熱門影集的成功推動了全球對非洲電視劇的需求,但MultiChoice在2024會計年度於其四大主要區域製作的59部本土原創劇集,進一步提升了其在非洲SVOD市場高階故事講述領域的地位。實況活動和生活風格節目也支撐著需求,但電視劇在所有人群中都保持著長期的受歡迎程度。預計到2025年,體育節目僅佔總收入的13.28%,但預計到2031年將以10.05%的複合年成長率成長,這主要得益於2025年國際足聯俱樂部世界杯的轉播權以及非洲杯半決賽創紀錄的1030萬獨立觀眾。 Showmax 的行動端專屬英超聯賽套餐,每月定價 69 蘭特(3.73 美元),強調了其「智慧型手機優先」的定位,以此作為體育訂閱領域的驅動力。
該領域的成長潛力反映了非洲龐大的足球迷群體以及他們為觀看大型賽事收費的意願,即便這意味著放棄價格昂貴的綜合娛樂套餐。在非洲的SVOD(訂閱隨選視訊)市場,聚合商正擴大採用按次付費(PPV)附加元件,以整合收費和交易模式。在預測期內,已獲得本地聯賽和女子體育賽事轉播權的供應商將擴大其市場佔有率,而低延遲串流媒體和互動式「觀賽派對」將提高客戶維繫。預計電視劇仍將保持主導地位,但考慮到透過行動網路觀看實況活動的便利性,其市場佔有率可能會被體育、紀錄片和音樂等內容蠶食一部分。
預計到2025年,SVOD模式將佔總收入的91.12%,這顯示非洲SVOD市場消費者更傾向於訂閱服務。一次性數據費用、定期行動支付以及與營運商的捆綁套餐有助於維持穩定的收入並降低解約率。 Netflix在24個法語國家的Canal+套餐中的整合,體現了對分銷網路的有效利用。同時,Showmax基於Peacock平台的重新設計提升了4K串流媒體播放和內容髮現功能,進一步證明了其訂閱定價的合理性。儘管SVOD佔據主導地位,但仍面臨定價方面的限制,因此一些公司嘗試推出僅限行動裝置使用的套餐和家庭共用套餐。
TVOD 9.25% 的複合年成長率主要得益於極具吸引力的收費模式,這種模式既能滿足價格敏感型用戶的需求,也能吸引那些尋求優質獨家內容但又不想簽訂長期合約的用戶。該模式支持熱門電影上映和體育賽事決賽,使平台能夠充分利用高峰期的需求來實現盈利。混合獲利模式——將內容庫收費與高價值賽事按次付費相結合——正逐漸成為非洲 SVOD 市場應對收入波動的有效策略。雖然未來廣告支援的付費模式可能會吸收 TVOD 的部分成長,但按次收費選項仍將是備受矚目的賽事和新片上映的可行選擇。
其他好處:
- Excel格式的市場預測(ME)表
- 3個月的分析師支持
目錄
第1章:引言
- 研究假設和市場定義
- 調查範圍
第2章:調查方法
第3章執行摘要
第4章 市場狀況
- 市場概覽
- 市場促進因素
- 全球公司的進入加劇了競爭
- 擴大經濟實惠的行動數據包月套餐
- 智慧型手機在非洲的普及率迅速成長
- 增加對本地內容投資的獎勵
- 電信業者(Telco)和OTT的混合商品搭售策略
- 引入雲端原生串流架構
- 市場限制因素
- 高訂閱費和ARPU值
- 在大都會圈以外,寬頻基礎設施的發展有相當大的差異。
- 透過非法串流媒體設備使用盜版內容的情況日益增加。
- 該地貨幣波動會影響價格決定
- 產業生態系分析
- 監理情勢
- 技術展望
- 宏觀經濟因素的影響
- 波特五力分析
- 用戶平均收入(ARPU)分析
第5章 市場規模與成長預測
- 按內容類型
- 戲劇
- 音樂
- 運動的
- 其他內容類型
- 按收入模式
- 訂閱式視訊點播
- 交易型視訊點播
- 依設備類型
- 智慧型手機
- 智慧電視
- 藥片
- 桌上型電腦或筆記型電腦
- 其他設備類型
- 按年齡層
- 18-24歲
- 25-34歲
- 35-44歲
- 45歲或以上
- 國家
- 肯亞
- 南非
- 奈及利亞
- 埃及
- 摩洛哥
- 其他非洲國家
第6章 競爭情勢
- 市場集中度
- 策略趨勢
- 市佔率分析
- 公司簡介
- Amazon.com Inc.
- Netflix Inc.
- MultiChoice Group Ltd.
- Walt Disney Company(Disney+)
- Apple Inc.(Apple TV+)
- Canal+Group(MyCanal)
- PCCW Media Group(Viu)
- iROKO Partners Ltd.(iROKOtv)
- Google LLC(YouTube Premium)
- MTN Group Ltd.(Ayoba)
- Huawei Technologies Co. Ltd.(Huawei Video)
- StarTimes Group(StarTimes ON)
- Orange SA(Orange VOD)
- StarTimes Media
- Telkom SA SOC Ltd.(TelkomONE)
第7章 市場機會與未來展望
According to Mordor Intelligence, the Africa SVOD market size was valued at USD 3.04 billion in 2025 and estimated to grow from USD 3.3 billion in 2026 to reach USD 4.94 billion by 2031, at a CAGR of 8.42% during the forecast period (2026-2031).
This report is Segmented by Content Genre (Drama, Music, Sports, and More), Revenue Model (Subscription Video On Demand, and Transactional Video On Demand), Device Type (Smartphone, Smart TV, Tablet, PC or Laptop, and More), Age Group (18-24 Years, 25-34 Years, 35-44 Years, and 45 Years and Above), and Geography (Kenya, South Africa, Nigeria, and More). The Market Forecasts are Provided in Terms of Value (USD).
Africa SVOD Market Trends and Insights
Intensification of Competition with Global Entrants
Global platforms deepen their African focus by commissioning originals and striking distribution alliances. Netflix alone licensed 283 Nigerian titles and earmarked USD 23.6 million for further content development, signalling sustained local investment. Aggressive localization broadens appeal, yet recurring price hikes in price-sensitive markets highlight monetization complexities. Disney + concentrates its rollout on South Africa, whereas Amazon Prime Video packages streaming with e-commerce perks to differentiate. Canal+ leverages its MultiChoice acquisition to scale across 50 countries and nearly 50 million subscribers, intensifying the fight for premium.
Expansion of Affordable Mobile Data Bundles
Operator-led data bundles and zero-rating propel streaming uptake. Safaricom doubled fiber speeds and introduced family share plans that merge mobile and fixed-line access, directly confronting Starlink's entry. M-PESA Ratiba's standing-order feature automates subscription payments and minimizes churn. Airtel's virtual Mastercard lets 150 million mobile-money users subscribe to international services, reducing payment friction and expanding addressable wallets. Such prepaid bundles and micropayments lower entry barriers and sustain demand across the Africa SVOD market.
Persistently High Subscription Fees Versus ARPU
Price hikes strain adoption and amplify regulatory scrutiny. MultiChoice Nigeria raised DStv premiums by more than 22% in 2025, pushing monthly fees to NGN 44,500 (USD 50.3) and sparking consumer backlash. Ghana's authorities threatened to revoke licenses unless fees dropped by 30% Netflix enacted three Nigerian price increases in two years, highlighting the tension between cost recovery and affordability within the Africa SVOD market. Ultimately, these high price-to-income ratios limit penetration among lower-income and rural users.
Other drivers and restraints analyzed in the detailed report include:
- Surge in Smartphone Penetration Across Africa
- Rising Local Content Investment Incentives
- Patchy Broadband Infrastructure Outside Metros
For complete list of drivers and restraints, kindly check the Table Of Contents.
Segment Analysis
Drama accounted for 44.76% of revenue in 2025, cementing its place as the cornerstone of the Africa SVOD market share. The success of crossover hits such as "Blood and Water" expanded global appetite for African drama, while MultiChoice's 59 local originals across four core territories in fiscal 2024 increased its Africa SVOD market size footprint in premium storytelling. Live-event genres and lifestyle shows supplement demand, yet dramas retain longer shelf life across demographics. Sports, although only 13.28% of 2025 revenue, exhibits a 10.05% CAGR to 2031, powered by rights to FIFA Club World Cup 2025 and AFCON's record-shattering 10.3 million unique-viewer semifinal.Showmax's mobile-only Premier League tier at ZAR 69 (USD 3.73) monthly underscores the smartphone-first positioning that drives sports subscriptions.
The segment's upside reflects Africa's vast football fandom and the willingness of fans to pay for marquee tournaments even if they avoid higher-priced general-entertainment tiers. Aggregators increasingly deploy pay-per-view add-ons within the Africa SVOD market to blend recurring and transactional models. Over the forecast period, providers that secure local leagues and women's sports will widen engagement, while low-latency streaming and interactive watch-parties will deepen retention. Drama is expected to hold leadership but cede some share to sports, documentaries and music, given the rising accessibility of live events on mobile networks.
The SVOD model captured 91.12% of receipts in 2025, illustrating consumer preference for flat-rate access in the Africa SVOD market. Bulk data top-ups, standing-order mobile payments and telco-bundling agreements sustain recurring revenues and reduce churn. Netflix bundles within Canal+ packages across 24 Francophone countries exemplify distribution leverage, whereas Showmax's Peacock-powered relaunch enhances 4K streaming and content discovery to justify subscription price points. Despite dominance, SVOD faces affordability constraints, prompting experimentation with mobile-only plans and shared-household tiers.
TVOD's 9.25% CAGR stems from its pay-as-you-go appeal to price-sensitive users or those seeking premium exclusives without long-term commitments. The model supports blockbuster movie releases alongside sports finals, enabling platforms to monetize peaks in demand. Hybrid monetization-merging subscription for catalog content and transactional for high-value events-emerges as a practical hedge against income volatility in the Africa SVOD market. Over time, ad-supported tiers may absorb part of TVOD growth, yet transactional options will persist for marquee events and early-release titles.
Complete Report Scope:
- By Content Genre
- Drama
- Music
- Sports
- Other Content Genres
- By Revenue Model
- Subscription Video on Demand
- Transactional Video on Demand
- By Device Type
- Smartphone
- Smart TV
- Tablet
- PC or Laptop
- Other Device Types
- By Age Group
- 18-24 Years
- 25-34 Years
- 35-44 Years
- 45 Years and above
- By Country
- Kenya
- South Africa
- Nigeria
- Egypt
- Morocco
- Rest of Africa
List of Companies Covered in this Report:
- Amazon.com Inc.
- Netflix Inc.
- MultiChoice Group Ltd.
- Walt Disney Company (Disney+)
- Apple Inc. (Apple TV+)
- Canal+ Group (MyCanal)
- PCCW Media Group (Viu)
- iROKO Partners Ltd. (iROKOtv)
- Google LLC (YouTube Premium)
- MTN Group Ltd. (Ayoba)
- Huawei Technologies Co. Ltd. (Huawei Video)
- StarTimes Group (StarTimes ON)
- Orange S.A. (Orange VOD)
- StarTimes Media
- Telkom SA SOC Ltd. (TelkomONE)
Additional Benefits:
- The market estimate (ME) sheet in Excel format
- 3 months of analyst support
TABLE OF CONTENTS
1 INTRODUCTION
- 1.1 Study Assumptions and Market Definition
- 1.2 Scope of the Study
2 RESEARCH METHODOLOGY
3 EXECUTIVE SUMMARY
4 MARKET LANDSCAPE
- 4.1 Market Overview
- 4.2 Market Drivers
- 4.2.1 Intensification of competition with global entrants
- 4.2.2 Expansion of affordable mobile data bundles
- 4.2.3 Surge in smartphone penetration across Africa
- 4.2.4 Rising local content investment incentives
- 4.2.5 Telco-OTT hybrid bundling strategies
- 4.2.6 Introduction of cloud-native streaming architectures
- 4.3 Market Restraints
- 4.3.1 Persistently high subscription fees vs ARPU
- 4.3.2 Patchy broadband infrastructure outside metros
- 4.3.3 Increasing piracy via illicit streaming devices
- 4.3.4 Local currency volatility impacting pricing power
- 4.4 Industry Ecosystem Analysis
- 4.5 Regulatory Landscape
- 4.6 Technological Outlook
- 4.7 Impact of Macroeconomic Factors
- 4.8 Porter's Five Forces Analysis
- 4.8.1 Bargaining Power of Suppliers
- 4.8.2 Bargaining Power of Consumers
- 4.8.3 Threat of New Entrants
- 4.8.4 Threat of Substitutes
- 4.8.5 Intensity of Competitive Rivalry
- 4.9 Average Revenue per User Analysis
5 MARKET SIZE AND GROWTH FORECASTS (VALUE)
- 5.1 By Content Genre
- 5.1.1 Drama
- 5.1.2 Music
- 5.1.3 Sports
- 5.1.4 Other Content Genres
- 5.2 By Revenue Model
- 5.2.1 Subscription Video on Demand
- 5.2.2 Transactional Video on Demand
- 5.3 By Device Type
- 5.3.1 Smartphone
- 5.3.2 Smart TV
- 5.3.3 Tablet
- 5.3.4 PC or Laptop
- 5.3.5 Other Device Types
- 5.4 By Age Group
- 5.4.1 18-24 Years
- 5.4.2 25-34 Years
- 5.4.3 35-44 Years
- 5.4.4 45 Years and above
- 5.5 By Country
- 5.5.1 Kenya
- 5.5.2 South Africa
- 5.5.3 Nigeria
- 5.5.4 Egypt
- 5.5.5 Morocco
- 5.5.6 Rest of Africa
6 COMPETITIVE LANDSCAPE
- 6.1 Market Concentration
- 6.2 Strategic Moves
- 6.3 Market Share Analysis
- 6.4 Company Profiles (includes Global level Overview, Market level Overview, Core Segments, Financials as available, Strategic Information, Market Rank or Share for key companies, Products and Services, and Recent Developments)
- 6.4.1 Amazon.com Inc.
- 6.4.2 Netflix Inc.
- 6.4.3 MultiChoice Group Ltd.
- 6.4.4 Walt Disney Company (Disney+)
- 6.4.5 Apple Inc. (Apple TV+)
- 6.4.6 Canal+ Group (MyCanal)
- 6.4.7 PCCW Media Group (Viu)
- 6.4.8 iROKO Partners Ltd. (iROKOtv)
- 6.4.9 Google LLC (YouTube Premium)
- 6.4.10 MTN Group Ltd. (Ayoba)
- 6.4.11 Huawei Technologies Co. Ltd. (Huawei Video)
- 6.4.12 StarTimes Group (StarTimes ON)
- 6.4.13 Orange S.A. (Orange VOD)
- 6.4.14 StarTimes Media
- 6.4.15 Telkom SA SOC Ltd. (TelkomONE)
7 MARKET OPPORTUNITIES AND FUTURE OUTLOOK
- 7.1 White-space and unmet-need assessment

 2026-2030年全球影音隨選市場
 北美廣告視訊點播(AVOD):市場佔有率分析、行業趨勢和統計數據以及成長預測(2026-2031 年)中東和非洲的廣告視訊點播 (AVOD):市場佔有率分析、行業趨勢與統計數據、成長預測 (2026-2031)南美洲廣告視訊點播 (AVOD):市場佔有率分析、產業趨勢與統計數據、成長預測 (2026-2031)歐洲廣告支援的影片點播(AVOD):市場佔有率分析、行業趨勢與統計數據及成長預測(2026-2031 年)交易型視訊點播 (TVOD):市場佔有率分析、行業趨勢和統計數據、成長預測 (2026-2031)廣告支援的視訊點播(AVOD):市場佔有率分析、行業趨勢和統計數據以及成長預測(2026-2031 年)訂閱式影片發送服務(SVOD):市場佔有率分析、行業趨勢和統計數據以及成長預測(2026-2031 年)
 隨選視訊市場:2026-2032年全球市場預測(依服務模式、內容類型、商品搭售結構、製作模式、語言提供、收費週期、影像品質、設備類型及供應商類型分類)
 2026-2030年全球視訊點播市場