


 |
市場調查報告書
商品編碼
2119182
北美廣告視訊點播(AVOD):市場佔有率分析、行業趨勢和統計數據以及成長預測(2026-2031 年)North America Advertising Video-on-Demand (AVOD) - Market Share Analysis, Industry Trends & Statistics, Growth Forecasts (2026 - 2031) |
||||||

※ 本網頁內容可能與最新版本有所差異。詳細情況請與我們聯繫。
據 Mordor Intelligence 稱,2025 年北美廣告視訊點播 (AVOD) 市場價值為 382 億美元,預計將從 2026 年的 405.3 億美元成長到 2031 年的 629.9 億美元,預測期(2026-2031 年)的複合年成長率為 9.22%。
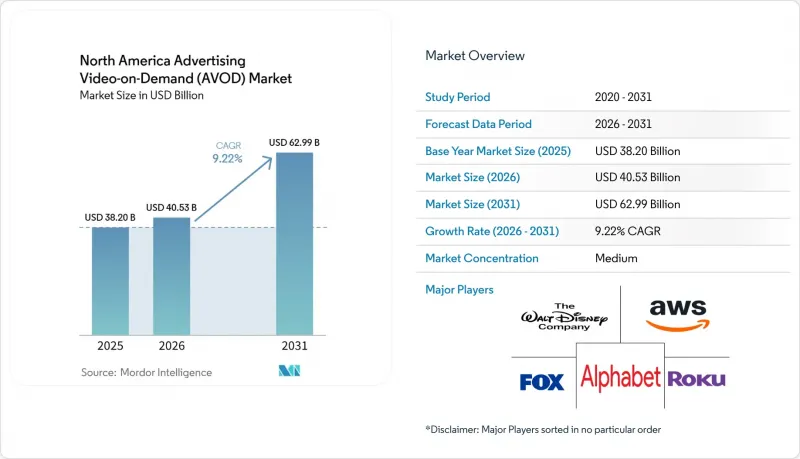
本報告按內容類型(電影和影像製作、電視節目和劇集內容、其他)、設備類型(智慧型手機和平板電腦、智慧電視、筆記型電腦和桌上型電腦、其他設備)、最終用戶(媒體和娛樂、零售和電子商務、其他)、廣告形式(前置式、其他)以及地區進行細分。市場預測以美元計價。
北美廣告視訊點播 (AVOD) 市場趨勢與洞察
持續的“停掉有線電視服務”和“訂閱疲勞”
「停掉有線電視服務)是北美廣告支援的視訊點播(AVOD)市場的一個結構性因素,因為它將用戶的觀看時間從傳統電視套餐轉移到了串流媒體服務。預計訂閱傳統捆綁付費電視的家庭數量將從2016年的8,350萬戶下降到2026年的4,320萬戶。由於串流媒體服務的訂閱費用預計在2025年將上漲19.5%,而整體通貨膨脹率僅為2.7%,免費和廣告支援型服務變得更具吸引力。 Netflix進一步擴大了其付費方案和免費觀看選項之間的價格差距,將其「標準廣告版」的月費從6.99美元提高到8.99美元。預計到2026年,廣告支援型計畫將佔高級訂閱視訊點播(SVOD)用戶的46%,這意味著即使在最初以訂閱主導起家的服務中,廣告空間也在增加。
將廣告預算從傳統電視轉向連網電視(CTV)和廣告支援的隨選視訊(AVOD)。
廣告預算從傳統電視轉向聯網電視(CTV)正在推動北美視訊點播(AVOD)市場的發展,因為串流媒體廣告位正成為電視廣告買家的直接替代方案。 2025年,聯網電視支出成長了16%,到年底,數位影片影片支出占美國電視和影片廣告總支出的近60%。 Premion委託進行的一項2026年調查顯示,70%的美國廣告商計劃將其在聯網電視上的投資平均增加17%。預計這部分新增投資將來自傳統電視、數位展示廣告、付費搜尋和社群媒體的預算。預計到2026年,不包括政治廣告在內的全國性和地區性傳統電視廣告支出將下降2.4%至279億美元,而數位電視廣告支出預計將增加3%至210億美元。這項轉變意味著 AVOD 供應商不僅要尋求新的廣告收入,還要直接與線性電視經銷商競爭,爭奪他們與廣告代理商的關係和電視廣告預算。
內容授權和高級版權成本不斷上漲。
內容獲取成本的不斷攀升給北美廣告支援的視訊點播(AVOD)市場帶來了壓力,因為需要大規模的內容庫和獨家節目才能吸引觀眾和廣告需求。 NBA的轉播權協議將於2025-26賽季生效,價值每年75億美元;亞馬遜則以130億美元的價格獲得了為期11年的周四晚間橄欖球賽轉播權。根據公開訊息,Netflix在2026年的年度內容支出將達到190億美元。標準的18至36個月的版權恢復期縮短了獨家播放期,因此能夠涵蓋高昂的授權費用。與擁有更廣泛議價能力的垂直整合平台相比,授權、窗口期、聯合發行和版稅等方面的要求對小規模的運營商來說負擔更重。
細分市場分析
至2025年,電視節目和劇集類內容將佔內容類型總收入的38.51%。連續劇擁有穩定的觀眾群、可預測的觀看時間,以及符合既定電視廣告購買模式的固定廣告位。其豐富的節目庫也有助於綜合娛樂平台在一天中的不同時段維持收視率。電影和影像仍然是重要的輔助內容類別,因為授權的院線發行可以增加廣告位,並支援更長的觀看時間。
預計2026年至2031年間,紀錄片將以9.83%的複合年成長率成長。這種節目形式對廣告商極具吸引力,因為其主題便於基於興趣進行定向投放,而其完整的時長也鼓勵觀眾觀看完整節目。 2026年6月,Ionic Studios對Documentary+進行了策略性投資,成為其AVOD和FAST頻道業務的官方發行商。這項交易反映出人們對非虛構類節目作為一種獨特的廣告空間來源的興趣日益濃厚。其他內容類型,包括短片和創作者主導型節目,也變得越來越重要,因為平台正在吸引那些能夠吸引年輕觀眾的創作者,而這些年輕觀眾先前對傳統的AVOD模式興趣不大。
預計2026年至2031年間,智慧電視的複合年成長率將達到9.58%,成為成長最快的設備類別。這一成長與電視作業系統在內容發現、廣告投放和用戶資料收集方面所發揮的作用密切相關。根據影片廣告局(VAB)的報告顯示,95%的聯網電視在開機時會在主畫面顯示廣告。這意味著,在用戶啟動串流媒體應用程式之前,裝置平台將在廣告體驗中扮演至關重要的角色。
到2025年,智慧型手機和平板電腦將佔北美廣告視訊點播(AVOD)市場27.99%的佔有率。行動觀看在年輕一代和墨西哥仍然十分重要,在墨西哥,行動網路的普及率甚至超過了家庭固定寬頻。這套設備基數支撐著北美AVOD市場持續成長,滿足了那些在家外短時間觀看內容的消費者的需求。一項針對63位串流媒體產業主管的調查發現,62%的受訪者認為Roku是家庭螢幕曝光度最具戰略意義的聯網電視平台。筆記型電腦和桌上型電腦仍然被廣泛用於職場、通勤和遠端觀看,尤其是在新聞和商業節目方面。遊戲機和機上盒則為優質節目和實況活動的同步播放提供了穩定且互補的廣告空間。
其他好處
- Excel格式的市場預測(ME)表
- 3個月的分析師支持
目錄
第1章:引言
- 研究假設和市場定義
- 調查範圍
第2章:調查方法
第3章執行摘要
第4章 市場狀況
- 市場概覽
- 市場促進因素
- 持續的“停掉有線電視服務”和“訂閱疲勞”
- 線性電視廣告預算轉移到連網電視(CTV)和廣告支援的視訊點播(AVOD)。
- 對可定向、可衡量的影片廣告的需求
- 快速擴張廣告支援型串流廣告庫存
- 僅限串流媒體的體育賽事直播和高級賽事直播時段
- 零售媒體與購物影片。
- 市場限制因素
- 內容授權和高級版權成本不斷上漲。
- 「圍牆花園」之間測量資料的碎片化
- 廣告重複投放與觀眾流失
- 平台准入和主螢幕存取費用
- 產業價值鏈分析
- 宏觀經濟因素對市場的影響
- 監理情勢
- 技術展望
- 波特五力分析
第5章 市場規模與成長預測
- 按內容類型
- 電影和影像作品
- 電視節目和劇集內容
- 記錄
- 其他內容類型
- 依設備類型
- 智慧型手機和平板電腦
- 智慧電視
- 筆記型電腦和桌上型電腦
- 其他設備類型
- 最終用戶
- 媒體與娛樂
- 零售與電子商務
- 銀行業、金融服務業及保險業
- 教育
- 資訊科技/通訊
- 衛生保健
- 其他終端用戶產業
- 透過廣告形式
- 前置式
- 中段滾動
- 後記
- 互動影片和購物影片
- 按地區
- 美國
- 加拿大
- 墨西哥
第6章 競爭情勢
- 市場集中度
- 策略趨勢
- 市佔率分析
- 公司簡介
- Alphabet Inc.
- Amazon.com, Inc.
- The Walt Disney Company
- Fox Corporation
- Roku, Inc.
- Paramount Skydance Corporation
- Comcast Corporation
- Netflix, Inc.
- Warner Bros. Discovery, Inc.
- Samsung Electronics Co., Ltd.
- LG Electronics Inc.
- The Trade Desk, Inc.
- Magnite, Inc.
- PubMatic, Inc.
- Yahoo Inc.
- Vizio, Inc.
- Plex, Inc.
- Crackle Plus, LLC
- FuboTV Inc.
- Philo Inc.
第7章 市場機會與未來展望
According to Mordor Intelligence, the North America advertising video-on-demand (AVOD) market size was valued at USD 38.20 billion in 2025 and is estimated to grow from USD 40.53 billion in 2026 to reach USD 62.99 billion by 2031, at a CAGR of 9.22% during the forecast period (2026-2031).
This report is Segmented by Content Type (Movies and Films, TV Shows and Episodic Content, and More), Device Type (Smartphones and Tablets, Smart TVs, Laptops and Desktops, and Other Device Types), End-User (Media and Entertainment, Retail and E-Commerce, and More), Ad Format (Pre-Roll, and More), and Geography. The Market Forecasts are Provided in Terms of Value (USD).
North America Advertising Video-on-Demand (AVOD) Market Trends and Insights
Ongoing Cord-Cutting and Subscription Fatigue
Cord-cutting has become a structural condition for the North America advertising video-on-demand (AVOD) market because it moves viewing time from traditional television packages to streaming services. Traditional bundled pay television fell to 43.2 million US households in 2026, down from 83.5 million households in 2016. Streaming subscription costs rose 19.5% in 2025, while the overall inflation rate was 2.7%, thereby increasing the appeal of free and ad-supported services. Netflix raised the monthly price of its Standard with Ads plan from USD 6.99 to USD 8.99, reinforcing the price difference between paid tiers and free viewing options. Ad-supported tiers accounted for 46% of premium subscription video-on-demand subscriptions in 2026, indicating that advertising inventory is also growing within services that began as subscription-led platforms.
Migration of Linear TV Budgets to CTV and AVOD
The shift of advertising budgets from linear television to connected television supports the North America advertising video-on-demand (AVOD) market, as streaming inventory provides a direct alternative for television buyers. Connected TV advertising spending increased 16% in 2025, and digital video represented nearly 60% of total US television and video advertising spending by year-end. A 2026 survey commissioned by Premion found that 70% of US advertisers planned to increase connected TV investment by an average of 17%. The additional investment is expected to come from linear television, digital display, paid search, and social media budgets. National and local linear television advertising, excluding political spending, is projected to decline 2.4% to USD 27.9 billion in 2026, while digital television formats are expected to grow 3% to USD 21 billion. The shift means AVOD providers compete directly with linear sellers for agency relationships and television budgets rather than only seeking new advertising spending.
Content Licensing and Premium Rights Cost Inflation
Rising content acquisition costs constrain the North America advertising video-on-demand (AVOD) market because larger libraries and exclusive programming are needed to compete for viewers and advertising demand. The NBA rights structure, which began with the 2025-26 season, was valued at USD 7.5 billion per year, and Amazon signed an 11-year Thursday Night Football agreement valued at USD 13 billion. Netflix's annual content spending stands at USD 19 billion in 2026, based on its public disclosures. Standard rights reversion windows of 18 to 36 months reduce the duration of exclusive access, which can support high licensing costs. Licensing, windowing, syndication, and royalty requirements impose a greater burden on smaller operators than on vertically integrated platforms with broader negotiating power.
Other drivers and restraints analyzed in the detailed report include:
- Demand for Addressable and Measurable Video Advertising
- Expansion of FAST and Ad-Supported Streaming Inventory
- Measurement Fragmentation Across Walled Gardens
For complete list of drivers and restraints, kindly check the Table Of Contents.
Segment Analysis
TV Shows and Episodic Content accounted for 38.51% of content-type revenue in 2025. Serial programming provides recurring audiences, predictable session lengths, and familiar advertising breaks that align with established television buying practices. Its broad catalog depth also helps general-entertainment platforms sustain viewing across different times of day. Movies and Films remained an important secondary content category because licensed theatrical titles add inventory and can support longer viewing sessions.
Documentaries are projected to grow at a 9.83% CAGR from 2026 to 2031. The format can appeal to advertisers because its subject matter supports interest-based targeting, and its long-form structure can support viewer completion. Ionic Studios took a strategic equity stake in Documentary+ in June 2026 and became the Publisher of Record for its AVOD and FAST channel business. The transaction reflected growing interest in nonfiction programming as a distinct source of advertising inventory. Other content types, including short-form and creator-led programming, are gaining relevance as platforms add creators who can attract younger audiences that previously engaged less with conventional AVOD formats.
Smart TVs are projected to expand at a 9.58% CAGR from 2026 to 2031, making them the fastest-growing device category. Their growth is tied to the television operating system's role in content discovery, advertising delivery, and audience data collection. The Video Advertising Bureau reported that 95% of connected televisions display advertising on the home screen when powered on. This gives device platforms a position in the advertising journey before a viewer enters a streaming application.
Smartphones and tablets accounted for 27.99% of the North America advertising video-on-demand (AVOD) market in 2025. Mobile viewing remains important among younger audiences and in Mexico, where mobile access can precede fixed household broadband. This device base supports continued access to the North America advertising video-on-demand (AVOD) market among consumers who watch short sessions outside the home. A survey of 63 senior streaming executives found that 62% regarded Roku as the most strategically important connected TV platform for home-screen visibility. Laptops and Desktops continued to serve workplace, commute, and remote-viewing use cases, especially for news and business programming. Game consoles and set-top boxes provided a stable, supporting inventory for premium broadcast simulcasts and live events.
Complete Report Scope:
- By Content Type
- Movies and Films
- TV Shows and Episodic Content
- Documentaries
- Other Content Types
- By Device Type
- Smartphones and Tablets
- Smart TVs
- Laptops and Desktops
- Other Device Types
- By End-User
- Media and Entertainment
- Retail and E-Commerce
- Banking, Financial Services, and Insurance
- Education
- Information Technology and Telecommunications
- Healthcare
- Other End-User Industries
- By Ad Format
- Pre-Roll
- Mid-Roll
- Post-Roll
- Interactive and Shoppable Video
- By Geography
- United States
- Canada
- Mexico
List of Companies Covered in this Report:
- Alphabet Inc.
- Amazon.com, Inc.
- The Walt Disney Company
- Fox Corporation
- Roku, Inc.
- Paramount Skydance Corporation
- Comcast Corporation
- Netflix, Inc.
- Warner Bros. Discovery, Inc.
- Samsung Electronics Co., Ltd.
- LG Electronics Inc.
- The Trade Desk, Inc.
- Magnite, Inc.
- PubMatic, Inc.
- Yahoo Inc.
- Vizio, Inc.
- Plex, Inc.
- Crackle Plus, LLC
- FuboTV Inc.
- Philo Inc.
Additional Benefits:
- The market estimate (ME) sheet in Excel format
- 3 months of analyst support
TABLE OF CONTENTS
1 INTRODUCTION
- 1.1 Study Assumptions and Market Definition
- 1.2 Scope of the Study
2 RESEARCH METHODOLOGY
3 EXECUTIVE SUMMARY
4 MARKET LANDSCAPE
- 4.1 Market Overview
- 4.2 Market Drivers
- 4.2.1 Ongoing Cord-Cutting and Subscription Fatigue
- 4.2.2 Migration of Linear TV Budgets to CTV and AVOD
- 4.2.3 Demand for Addressable and Measurable Video Advertising
- 4.2.4 Expansion of FAST and Ad-Supported Streaming Inventory
- 4.2.5 Streaming-Exclusive Live Sports and Premium Event Inventory
- 4.2.6 Retail Media and Shoppable Video Convergence
- 4.3 Market Restraints
- 4.3.1 Content Licensing and Premium Rights Cost Inflation
- 4.3.2 Measurement Fragmentation Across Walled Gardens
- 4.3.3 Repetitive Ad Loads and Viewer Churn
- 4.3.4 Platform Gatekeeping and Home-Screen Access Fees
- 4.4 Industry Value Chain Analysis
- 4.5 Impact of Macroeconomic Factors on the Market
- 4.6 Regulatory Landscape
- 4.7 Technological Outlook
- 4.8 Porter's Five Forces Analysis
- 4.8.1 Bargaining Power of Suppliers
- 4.8.2 Bargaining Power of Buyers
- 4.8.3 Threat of New Entrants
- 4.8.4 Threat of Substitutes
- 4.8.5 Intensity of Competitive Rivalry
5 MARKET SIZE AND GROWTH FORECASTS (VALUE)
- 5.1 By Content Type
- 5.1.1 Movies and Films
- 5.1.2 TV Shows and Episodic Content
- 5.1.3 Documentaries
- 5.1.4 Other Content Types
- 5.2 By Device Type
- 5.2.1 Smartphones and Tablets
- 5.2.2 Smart TVs
- 5.2.3 Laptops and Desktops
- 5.2.4 Other Device Types
- 5.3 By End-User
- 5.3.1 Media and Entertainment
- 5.3.2 Retail and E-Commerce
- 5.3.3 Banking, Financial Services, and Insurance
- 5.3.4 Education
- 5.3.5 Information Technology and Telecommunications
- 5.3.6 Healthcare
- 5.3.7 Other End-User Industries
- 5.4 By Ad Format
- 5.4.1 Pre-Roll
- 5.4.2 Mid-Roll
- 5.4.3 Post-Roll
- 5.4.4 Interactive and Shoppable Video
- 5.5 By Geography
- 5.5.1 United States
- 5.5.2 Canada
- 5.5.3 Mexico
6 COMPETITIVE LANDSCAPE
- 6.1 Market Concentration
- 6.2 Strategic Moves
- 6.3 Market Share Analysis
- 6.4 Company Profiles (includes Global Level Overview, Market Level Overview, Core Segments, Financials as available, Strategic Information, Market Rank/Share, Products and Services, Recent Developments)
- 6.4.1 Alphabet Inc.
- 6.4.2 Amazon.com, Inc.
- 6.4.3 The Walt Disney Company
- 6.4.4 Fox Corporation
- 6.4.5 Roku, Inc.
- 6.4.6 Paramount Skydance Corporation
- 6.4.7 Comcast Corporation
- 6.4.8 Netflix, Inc.
- 6.4.9 Warner Bros. Discovery, Inc.
- 6.4.10 Samsung Electronics Co., Ltd.
- 6.4.11 LG Electronics Inc.
- 6.4.12 The Trade Desk, Inc.
- 6.4.13 Magnite, Inc.
- 6.4.14 PubMatic, Inc.
- 6.4.15 Yahoo Inc.
- 6.4.16 Vizio, Inc.
- 6.4.17 Plex, Inc.
- 6.4.18 Crackle Plus, LLC
- 6.4.19 FuboTV Inc.
- 6.4.20 Philo Inc.
7 MARKET OPPORTUNITIES AND FUTURE OUTLOOK
- 7.1 White-Space and Unmet-Need Assessment

 非洲SVOD市場:市場佔有率分析、產業趨勢與統計及成長預測(2026-2031年)
 2026-2030年全球影音隨選市場中東和非洲的廣告視訊點播 (AVOD):市場佔有率分析、行業趨勢與統計數據、成長預測 (2026-2031)南美洲廣告視訊點播 (AVOD):市場佔有率分析、產業趨勢與統計數據、成長預測 (2026-2031)歐洲廣告支援的影片點播(AVOD):市場佔有率分析、行業趨勢與統計數據及成長預測(2026-2031 年)交易型視訊點播 (TVOD):市場佔有率分析、行業趨勢和統計數據、成長預測 (2026-2031)廣告支援的視訊點播(AVOD):市場佔有率分析、行業趨勢和統計數據以及成長預測(2026-2031 年)訂閱式影片發送服務(SVOD):市場佔有率分析、行業趨勢和統計數據以及成長預測(2026-2031 年)
 隨選視訊市場:2026-2032年全球市場預測(依服務模式、內容類型、商品搭售結構、製作模式、語言提供、收費週期、影像品質、設備類型及供應商類型分類)
 2026-2030年全球視訊點播市場