


 |
市場調查報告書
商品編碼
2100271
廣告支援的視訊點播(AVOD):市場佔有率分析、行業趨勢和統計數據以及成長預測(2026-2031 年)Advertising Based Video On Demand (AVOD) - Market Share Analysis, Industry Trends & Statistics, Growth Forecasts (2026 - 2031) |
||||||

※ 本網頁內容可能與最新版本有所差異。詳細情況請與我們聯繫。
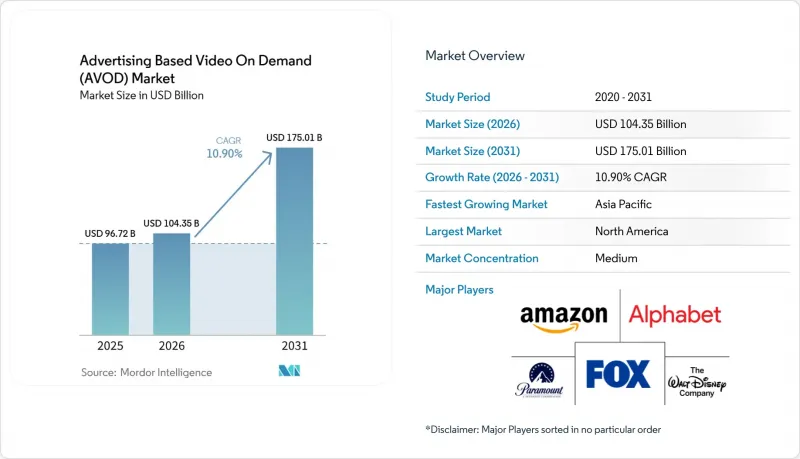
根據 Mordor Intelligence 預測,廣告支援的視訊點播 (AVOD) 市場規模預計將從 2025 年的 967.2 億美元成長到 2026 年的 1043.5 億美元,然後在 2031 年達到 1750.1 億美元,2026 年至 2031 年的複合年成長率為 10.90%。
本報告按內容類型(電影、電視節目/劇集、紀錄片及其他)、設備類型(智慧型手機/平板電腦、智慧型電視、筆記型電腦/桌上型電腦及其他)、最終用戶(媒體/娛樂、零售/電子商務、醫療保健及其他)、廣告形式(前置式及其他)和地區進行細分。市場預測以美元計價。
全球廣告支援的視訊點播 (AVOD) 市場趨勢及洞察
廣告支出轉移到聯網電視的趨勢正在擴大。
廣告支出從傳統電視轉向聯網電視(CTV)的趨勢,仍是影響廣告支援的隨選視訊(AVOD)市場最強勁的驅動力。這是因為廣告主現在不再將串流媒體視為實驗性產品,而是將其視為核心電視管道。根據Premium和Advertiser Perceptions聯合發布的2026年調查報告,70%的美國廣告商計劃在2026年將其在CTV和OTT上的支出平均增加17%,其中28%的成長預計將直接來自傳統廣播電視預算的重新分配。伴隨這一轉變,廣告商群體也不斷擴大。 IAB的一份報告顯示,受自助服務工具普及的推動,年預算低於5000萬美元的小規模廣告商在CTV上的投資比例從2024年的60%上升到2026年的85%。這種成長意義重大,因為它創造了持續的「長尾」需求,而傳統電視銷售模式無法有效滿足這一需求。調查也顯示,目前整合型和混合型採購團隊管理55%的連網電視廣告預算。這表明,廣告策劃流程正變得越來越整合,而擁有強大程式化基礎架構的平台正在獲得優勢。
零售媒體與購物影片。
零售媒體的整合正在改變廣告支援的視訊點播 (AVOD) 市場,使其從單純的觸達管道轉變為可衡量的分銷管道,並能更清晰地追蹤購買歸因。據 Criteo 稱,於 2025 年 4 月推出的「Onsite Video」(Albertsons Companies、Costco 和沃爾瑪墨西哥公司均已採用)在初步測試中與贊助產品廣告結合使用時,點擊率 (CTR) 提升了 280%,銷售額提升了 460%。 2026 年 4 月,Roku 進一步發展了這個概念,推出了“Roku Curate”,將 Roku 的受眾數據與來自 Best Buy Ads、Instacart、Kroger Precision Marketing 和其他零售合作夥伴的檢驗購買訊號整合到正常的購買流程中。這項發展意義重大,因為它縮小了影片曝光與銷售衡量之間的差距,而這一差距歷來限制了串流媒體環境下效果廣告預算的發揮。此舉也將為純粹的 AVOD 提供者帶來越來越大的壓力。這是因為沒有第一方商業訊號的平台將很難與整合到零售商中的廣告空間的價值提案競爭。
充斥著廣告的廣告會讓觀眾感到疲倦和疏離。
廣告疲勞仍然是廣告支援型視訊點播 (AVOD) 市場最明顯的營運風險。這是因為短期收入成長可能會破壞廣告支援模式所依賴的使用者群體的穩定性。 Parks Associates 發布的一份 2025 年報告發現,70% 的串流媒體用戶將「廣告重複曝光」列為他們最大的抱怨,這表明隨著廣告支援模式的擴展,用戶的接受度正在受到考驗。一份用戶報告也指出,三星 Tizen 生態系統中應用程式的流失用戶與有效用戶用戶之比高達 9:1,這印證了廣告品質不佳和重複投放過多會損害用戶留存率的觀點。這是一個至關重要的問題,因為用戶數量的減少會降低廣告商願意支付的金額,從而削弱他們的定價權。那些投資廣告投放頻率、創新輪調和相關性管理的平台,更有能力維持用戶參與度和獲利品質。
細分市場分析
到2025年,電視節目和劇集內容將佔廣告支援型視訊點播(AVOD)市場佔有率的34.17%,這反映出連續觀看會在同一會話中反覆產生廣告曝光。這種形式受益於廣告支援型視訊點播產業的「會話堆疊」模式,即觀眾無需離開平台即可從一集切換到下一集。這種模式可以在不相應增加內容取得和分發成本的情況下提高廣告曝光密度。雖然電影和長片仍然擁有相當數量的觀眾,但由於每次觀看會話中插播廣告的數量通常較少,因此與劇集庫相比,它們的盈利潛力有限。
在創作者影片、體育短片、新聞節目以及更廣泛的FAST頻道節目的推動下,廣告支援主導視訊點播(AVOD)市場中的其他內容類型預計將在2026年至2031年間以11.62%的複合年成長率成長。這項轉變意義重大,因為曾經被視為無序的廣告位類別如今正以更系統化的方式出售給廣告商。用戶草案還指出,愛奇藝計畫在2026年透過其「Nattopro」平台發行超過100部短劇,這表明短片節目正在成為一個獨立的獲利模式。更短的節目時長可以實現更高的每分鐘廣告內容比,在觀眾參與度高且內容成本得到嚴格控制的情況下,這可以提高盈利。
預計到2025年,智慧電視的市佔率將達到41.59%,客廳仍將是廣告支援型視訊點播(AVOD)市場中高階定價的核心。 Roku報告稱,2026年第一季串流媒體播放時長達387億小時,年增8%。這凸顯了已開發市場用戶對大螢幕介面的持續高參與度。在大螢幕上觀看內容仍然具有吸引力,因為它能帶來更高的專注度、更強的記憶保持能力,以及與傳統電視非常相似的觀看環境。隨著智慧電視作業系統向更強大的廣告支援功能轉型,筆記型電腦和桌上型電腦的相對重要性將持續下降。
受亞太和南美地區「行動優先」串流習慣的推動,智慧型手機和平板電腦的廣告支援型視訊點播 (AVOD) 市場預計到 2031 年將以 11.76% 的複合年成長率成長。這份用戶報告特別指出,這一趨勢在印度尤為顯著,預計到 2030 年,廣告支援模式將佔印度線上影片成長的 70% 以上。一個主要挑戰是,當一個家庭同時使用行動裝置和聯網電視時,跨裝置 ID 的一致性存在問題。這會導致重複計數和頻率管理不善。雖然與認證家庭圖譜和設備級 ID 合作相關的解決方案正在改善這種情況,但在大型平台生態系統之外,這些方案的普及程度並不均衡。
區域分析
到2025年,北美將佔據廣告支援型視訊點播(AVOD)市場39.54%的佔有率,成為該地區最大的收入來源。北美受益於成熟的聯網電視基礎設施、較高的廣告商意識以及美國主要串流媒體平台上集中的優質廣告資源。 Roku提交的文件也表明,用戶持續參與該平台並不斷擴大盈利支持,這印證了北美為何在廣告支持型影片點播(AVOD)市場的規模、定價和程序化廣告的成熟度方面繼續引領商業性標準。加拿大和墨西哥雖然規模小於美國,但也持續受益於跨境平台的擴張和成熟的廣告商工作流程。
預計亞太地區在2026年至2031年間將以11.93%的複合年成長率成長,成為廣告支援的隨選視訊(AVOD)市場規模成長最快的地區。根據AVIA和Media Partners Asia的預測,亞太地區的高階AVOD收入預計將從2025年的80億美元成長到2030年的120億美元以上,其中印度、日本和澳洲將引領成長,韓國和印尼緊隨其後。印度市場尤其重要,因為其用戶基數龐大,但平均每用戶收入(ARPU)較低,這迫使平台盡可能提高廣告曝光率,而不是主要依賴訂閱費用。另一方面,日本市場則呈現不同的特點,其用戶變現率更高,差異化策略著重於高品質的本地內容和體育內容。中國仍然是一個重要的市場,但用戶草案表明,隨著平台調整內容經濟模式,短期內廣告壓力將會增加,並且會積極轉向人工智慧驅動的短影片節目。
歐洲仍然是廣告支援型視訊點播 (AVOD) 的主要區域市場,隨著本土參與企業不斷擴大規模以追趕全球平台,廣播公司之間的合作變得日益重要。用戶草案也重點介紹了南美洲,特別是巴西和阿根廷的新興機會。 Roku 在巴西推出廣告平台,展現其對自身獲利能力充滿信心。非洲仍處於起步階段,但南非、奈及利亞和埃及等市場的「行動優先」觀看模式凸顯了廣告支援型串流媒體的長期潛力。在全部區域,廣告支援型視訊點播 (AVOD) 市場正在蓬勃發展,本地內容、相對較低的價格門檻和靈活的廣告模式與消費者願意透過觀看廣告來獲取內容的意願相契合。
其他好處
- Excel格式的市場預測(ME)表
- 3個月的分析師支持
目錄
第1章:引言
- 研究假設和市場定義
- 調查範圍
第2章:調查方法
第3章執行摘要
第4章 市場狀況
- 市場概覽
- 市場促進因素
- 廣告支出正在轉移到聯網電視。
- 零售媒體與購物影片。
- 使用第一方資料進行定向的需求
- 擴大僅在串流媒體服務上提供的體育直播內容。
- 人工智慧驅動的廣告個人化與收益最佳化
- 擴大FAST頻道的獲利範圍
- 市場限制因素
- 過度的廣告會導致觀眾疲勞和疏離。
- 以隱私為中心的定向投放的局限性
- 內容授權成本飆升
- 設備間測量資料的分割
- 產業價值鏈分析
- 監理情勢
- 技術展望
- 波特五力分析
- 宏觀經濟因素對市場的影響
第5章 市場規模與成長預測
- 按內容類型
- 電影和影像作品
- 電視節目和劇集內容
- 記錄
- 其他內容類型
- 依設備類型
- 智慧型手機和平板電腦
- 智慧電視
- 筆記型電腦和桌上型電腦
- 其他
- 最終用戶
- 媒體與娛樂
- 零售與電子商務
- BFSI
- 教育
- IT/通訊
- 衛生保健
- 其他
- 透過廣告形式
- 前置式
- 中段滾動
- 後記
- 按地區
- 北美洲
- 美國
- 加拿大
- 墨西哥
- 南美洲
- 巴西
- 阿根廷
- 智利
- 其他南美國家
- 歐洲
- 德國
- 英國
- 法國
- 義大利
- 西班牙
- 其他歐洲國家
- 亞太地區
- 中國
- 日本
- 印度
- 韓國
- 澳洲
- 其他亞太國家
- 中東
- 沙烏地阿拉伯
- 阿拉伯聯合大公國
- 卡達
- 其他中東國家
- 非洲
- 南非
- 埃及
- 奈及利亞
- 其他非洲地區
- 北美洲
第6章 競爭情勢
- 市場集中度
- 策略趨勢
- 供應商定位分析
- 公司簡介
- Alphabet Inc.
- Amazon.com, Inc.
- The Walt Disney Company
- Fox Corporation
- Paramount Skydance Corporation
- Roku, Inc.
- Comcast Corporation
- Warner Bros. Discovery, Inc.
- Netflix, Inc.
- Samsung Electronics Co., Ltd.
- LG Electronics Inc.
- ITV plc
- Rakuten Group, Inc.
- PCCW Limited
- iQIYI, Inc.
- Tencent Holdings Limited
- ProSiebenSat.1 Media SE
- Seven West Media Limited
- Channel Four Television Corporation
- Plex, Inc.
第7章 市場機會與未來展望
According to Mordor Intelligence, the advertising based video on demand (AVOD) market size is expected to grow from USD 96.72 billion in 2025 to USD 104.35 billion in 2026 and is forecast to reach USD 175.01 billion by 2031 at 10.90% CAGR over 2026-2031.
This report is Segmented by Content Type (Movies and Films, TV Shows and Episodic Content, Documentaries, and More), Device Type (Smartphones and Tablets, Smart TVs, Laptops and Desktops, and More), End-User (Media and Entertainment, Retail and E-Commerce, Healthcare, and More), Ad Format (Pre-Roll, and More), and Geography. The Market Forecasts are Provided in Terms of Value (USD).
Global Advertising Based Video On Demand (AVOD) Market Trends and Insights
Rising Connected TV Ad Spend Migration
Advertising migration from linear television to connected TV remains the strongest force shaping the advertising based video on demand (AVOD) market, because buyers now see streaming as a core television channel rather than an experimental line item. The 2026 Premion and Advertiser Perceptions survey showed that 70% of U.S. advertisers planned to increase CTV and OTT spending by an average of 17% in 2026, with 28% of that increase expected to come directly from reallocation from broadcast linear. The same change is widening the buyer base, as the IAB reported that the share of small spenders with annual budgets below USD 50 million investing in CTV rose from 60% in 2024 to 85% in 2026, driven by self-serve tools. That broadening matters because it adds a long tail of recurring demand that older television sales models could not serve efficiently. The survey also found that integrated and hybrid buying teams now control 55% of CTV budgets, which shows that planning workflows are consolidating and favoring platforms with strong programmatic infrastructure.
Retail Media and Shoppable Video Convergence
Retail media integration is changing the advertising based video on demand (AVOD) market from a reach channel into a measurable sales channel with clearer purchase attribution. Criteo stated that its April 2025 rollout of Onsite Video, used by Albertsons Companies, Costco, and Walmart Mexico, produced a 280% increase in click-through rates and a 460% lift in sales when paired with sponsored product ads in early tests. Roku extended this logic in April 2026 through Roku Curate, which combined Roku audience data with verified purchase signals from Best Buy Ads, Instacart, Kroger Precision Marketing, and other retail partners inside ordinary buying workflows. This development matters because it lowers the gap between video exposure and sales measurement, which has historically limited performance budgets in streaming environments. It also increases pressure on pure-play AVOD operators, because platforms without first-party commerce signals will find it harder to match the value proposition of retail-linked inventory.
Ad-Load Fatigue and Viewer Churn
Ad-load fatigue remains the clearest operating risk for the advertising based video on demand (AVOD) market because short-term revenue gains can weaken the audience stability that ad-supported models depend on. Parks Associates reported in 2025 that 70% of streaming viewers identified repetitive ad exposure as their leading frustration, which shows that audience tolerance is being tested as ad-supported tiers expand. The user draft also noted a 9:1 churned-to-active user ratio across apps in the Samsung Tizen ecosystem, reinforcing the idea that weak ad quality and excessive repetition can damage retention. This issue is important because audience erosion reduces the scale that advertisers are paying for and weakens pricing leverage over time. Platforms that invest in frequency controls, creative rotation, and better relevance are better placed to defend both user engagement and monetization quality.
Other drivers and restraints analyzed in the detailed report include:
- First-Party Data Targeting Demand
- Streaming-Exclusive Live Sports Inventory Expansion
- Privacy-Led Targeting Constraints
For complete list of drivers and restraints, kindly check the Table Of Contents.
Segment Analysis
TV shows and episodic content held 34.17% of the advertising based video on demand (AVOD) market share in 2025, reflecting how serialized viewing creates repeated ad opportunities within the same session. In the advertising based video on demand industry, this format benefits from session stacking, where viewers move from one episode to the next without leaving the platform. That pattern raises ad impression density without requiring a matching increase in content acquisition or delivery costs. Movies and films still represent an important viewing pool, but they typically feature fewer mid-roll breaks per viewing session, which limits monetization compared to episodic libraries.
Other content types in the advertising based video on demand (AVOD) market size mix are projected to grow at an 11.62% CAGR from 2026 to 2031, supported by creator-led video, sports clips, news formats, and broader FAST channel programming. This shift matters because inventory categories that were once considered unstructured are now sold to advertisers more systematically. The user draft also pointed to iQIYI's plan to release more than 100 short-form dramas in 2026 through its Nattopro platform, showing that short-form programming is becoming a dedicated monetization category. Shorter formats can support a higher ad-to-content ratio per minute, which improves yield when audience attention is strong and content costs are tightly managed.
Smart TVs captured 41.59% share in 2025, which kept the living room at the center of premium pricing in the advertising based video on demand (AVOD) market. Roku reported 38.7 billion streaming hours in Q1 2026, up 8% year over year, which confirmed continued heavy engagement on large-screen interfaces in developed markets. Large-screen viewing remains attractive because it is associated with stronger attention, better recall, and a viewing setting that resembles traditional television. Laptops and desktops continue to lose relative importance as viewing shifts toward smart TV operating systems with stronger ad-serving capabilities.
The advertising based video on demand (AVOD) market size for smartphones and tablets is projected to expand at an 11.76% CAGR through 2031, driven by mobile-first streaming habits in Asia-Pacific and South America. The user draft linked that trend particularly to India, where ad-supported models are expected to account for more than 70% of incremental online video growth by 2030. The main challenge is that cross-device identity remains inconsistent when a household uses both mobile and connected TV devices, leading to duplication and poor frequency control. Solutions tied to authenticated household graphs and device-level identity partnerships are improving the situation, but adoption remains uneven outside the largest platform ecosystems.
Complete Report Scope:
- By Content Type
- Movies and Films
- TV Shows and Episodic Content
- Documentaries
- Other Content Types
- By Device Type
- Smartphones and Tablets
- Smart TVs
- Laptops and Desktops
- Other Device Types
- By End-User
- Media and Entertainment
- Retail and E-Commerce
- BFSI
- Education
- Information Technology and Telecommunications
- Healthcare
- Other End-Users
- By Ad Format
- Pre-Roll
- Mid-Roll
- Post-Roll
- By Geography
- North America
- United States
- Canada
- Mexico
- South America
- Brazil
- Argentina
- Chile
- Rest of South America
- Europe
- Germany
- United Kingdom
- France
- Italy
- Spain
- Rest of Europe
- Asia-Pacific
- China
- Japan
- India
- South Korea
- Australia
- Rest of Asia-Pacific
- Middle East
- Saudi Arabia
- United Arab Emirates
- Qatar
- Rest of Middle East
- Africa
- South Africa
- Egypt
- Nigeria
- Rest of Africa
- North America
Geography Analysis
North America accounted for 39.54% of the advertising based video on demand (AVOD) market share in 2025, which made it the leading regional revenue center. The region benefits from mature connected TV infrastructure, high advertiser familiarity, and a strong concentration of premium inventory across large U.S.-originated streaming platforms. Roku's filings also showed continued platform engagement and expanding monetization support, reinforcing why North America still sets the commercial standard for scale, pricing, and programmatic sophistication in the advertising based video on demand (AVOD) market. Canada and Mexico remain smaller than the U.S., but they continue to benefit from cross-border platform expansion and established advertiser workflows.
Asia-Pacific is projected to expand at an 11.93% CAGR from 2026 to 2031, giving the region the fastest growth in the advertising based video on demand (AVOD) market size. AVIA and Media Partners Asia projected that premium AVOD revenue in Asia-Pacific would increase from USD 8 billion in 2025 to more than USD 12 billion by 2030, led by India, Japan, and Australia, followed by South Korea and Indonesia. India remains especially important because a high-volume, low-ARPU structure pushes platforms to maximize ad impression output rather than rely mainly on subscription pricing. Japan adds a different profile, with stronger monetization per user, premium local content, and sports-led differentiation. China remains important, but the user draft pointed to near-term advertising pressure and an active pivot toward AI-supported short-form programming as platforms adjust content economics.
Europe remains a major regional pool for the advertising based video on demand (AVOD) market, and broadcaster coordination is becoming more important as local players respond to global platform scale. The user draft also described South America as a rising opportunity centered on Brazil and Argentina, with Roku's ad platform launch in Brazil showing stronger confidence in monetization readiness. Africa is still at an earlier stage, but mobile-first viewing patterns in markets such as South Africa, Nigeria, and Egypt support long-term potential for ad-supported streaming. Across these regions, the advertising based video on demand (AVOD) market is growing where local content, lighter pricing barriers, and flexible advertising models align with consumer willingness to watch ads in exchange for access.
- Alphabet Inc.
- Amazon.com, Inc.
- The Walt Disney Company
- Fox Corporation
- Paramount Skydance Corporation
- Roku, Inc.
- Comcast Corporation
- Warner Bros. Discovery, Inc.
- Netflix, Inc.
- Samsung Electronics Co., Ltd.
- LG Electronics Inc.
- ITV plc
- Rakuten Group, Inc.
- PCCW Limited
- iQIYI, Inc.
- Tencent Holdings Limited
- ProSiebenSat.1 Media SE
- Seven West Media Limited
- Channel Four Television Corporation
- Plex, Inc.
Additional Benefits:
- The market estimate (ME) sheet in Excel format
- 3 months of analyst support
TABLE OF CONTENTS
1 INTRODUCTION
- 1.1 Study Assumptions And Market Definition
- 1.2 Scope Of The Study
2 RESEARCH METHODOLOGY
3 EXECUTIVE SUMMARY
4 MARKET LANDSCAPE
- 4.1 Market Overview
- 4.2 Market Drivers
- 4.2.1 Rising Connected TV Ad Spend Migration
- 4.2.2 Retail Media and Shoppable Video Convergence
- 4.2.3 First-Party Data Targeting Demand
- 4.2.4 Streaming-Exclusive Live Sports Inventory Expansion
- 4.2.5 AI-Led Ad Personalization and Yield Optimization
- 4.2.6 FAST Channel Monetization Scale-Up
- 4.3 Market Restraints
- 4.3.1 Ad-Load Fatigue and Viewer Churn
- 4.3.2 Privacy-Led Targeting Constraints
- 4.3.3 Content Licensing Cost Inflation
- 4.3.4 Measurement Fragmentation Across Devices
- 4.4 Industry Value Chain Analysis
- 4.5 Regulatory Landscape
- 4.6 Technological Outlook
- 4.7 Porter's Five Forces Analysis
- 4.7.1 Bargaining Power of Buyers
- 4.7.2 Bargaining Power of Suppliers
- 4.7.3 Threat of New Entrants
- 4.7.4 Threat of Substitutes
- 4.7.5 Intensity of Competitive Rivalry
- 4.8 Impact of Macroeconomic Factors on the Market
5 MARKET SIZE AND GROWTH FORECASTS (VALUE)
- 5.1 By Content Type
- 5.1.1 Movies and Films
- 5.1.2 TV Shows and Episodic Content
- 5.1.3 Documentaries
- 5.1.4 Other Content Types
- 5.2 By Device Type
- 5.2.1 Smartphones and Tablets
- 5.2.2 Smart TVs
- 5.2.3 Laptops and Desktops
- 5.2.4 Other Device Types
- 5.3 By End-User
- 5.3.1 Media and Entertainment
- 5.3.2 Retail and E-Commerce
- 5.3.3 BFSI
- 5.3.4 Education
- 5.3.5 Information Technology and Telecommunications
- 5.3.6 Healthcare
- 5.3.7 Other End-Users
- 5.4 By Ad Format
- 5.4.1 Pre-Roll
- 5.4.2 Mid-Roll
- 5.4.3 Post-Roll
- 5.5 By Geography
- 5.5.1 North America
- 5.5.1.1 United States
- 5.5.1.2 Canada
- 5.5.1.3 Mexico
- 5.5.2 South America
- 5.5.2.1 Brazil
- 5.5.2.2 Argentina
- 5.5.2.3 Chile
- 5.5.2.4 Rest of South America
- 5.5.3 Europe
- 5.5.3.1 Germany
- 5.5.3.2 United Kingdom
- 5.5.3.3 France
- 5.5.3.4 Italy
- 5.5.3.5 Spain
- 5.5.3.6 Rest of Europe
- 5.5.4 Asia-Pacific
- 5.5.4.1 China
- 5.5.4.2 Japan
- 5.5.4.3 India
- 5.5.4.4 South Korea
- 5.5.4.5 Australia
- 5.5.4.6 Rest of Asia-Pacific
- 5.5.5 Middle East
- 5.5.5.1 Saudi Arabia
- 5.5.5.2 United Arab Emirates
- 5.5.5.3 Qatar
- 5.5.5.4 Rest of Middle East
- 5.5.6 Africa
- 5.5.6.1 South Africa
- 5.5.6.2 Egypt
- 5.5.6.3 Nigeria
- 5.5.6.4 Rest of Africa
- 5.5.1 North America
6 COMPETITIVE LANDSCAPE
- 6.1 Market Concentration
- 6.2 Strategic Moves
- 6.3 Vendor Positioning Analysis
- 6.4 Company Profiles (includes Global Level Overview, Market Level Overview, Core Segments, Financials as available, Strategic Information, Market Rank/Share, Products and Services, Recent Developments)
- 6.4.1 Alphabet Inc.
- 6.4.2 Amazon.com, Inc.
- 6.4.3 The Walt Disney Company
- 6.4.4 Fox Corporation
- 6.4.5 Paramount Skydance Corporation
- 6.4.6 Roku, Inc.
- 6.4.7 Comcast Corporation
- 6.4.8 Warner Bros. Discovery, Inc.
- 6.4.9 Netflix, Inc.
- 6.4.10 Samsung Electronics Co., Ltd.
- 6.4.11 LG Electronics Inc.
- 6.4.12 ITV plc
- 6.4.13 Rakuten Group, Inc.
- 6.4.14 PCCW Limited
- 6.4.15 iQIYI, Inc.
- 6.4.16 Tencent Holdings Limited
- 6.4.17 ProSiebenSat.1 Media SE
- 6.4.18 Seven West Media Limited
- 6.4.19 Channel Four Television Corporation
- 6.4.20 Plex, Inc.
7 MARKET OPPORTUNITIES AND FUTURE OUTLOOK
- 7.1 White-Space and Unmet-Need Assessment

 非洲SVOD市場:市場佔有率分析、產業趨勢與統計及成長預測(2026-2031年)
 2026-2030年全球影音隨選市場北美廣告視訊點播(AVOD):市場佔有率分析、行業趨勢和統計數據以及成長預測(2026-2031 年)中東和非洲的廣告視訊點播 (AVOD):市場佔有率分析、行業趨勢與統計數據、成長預測 (2026-2031)南美洲廣告視訊點播 (AVOD):市場佔有率分析、產業趨勢與統計數據、成長預測 (2026-2031)歐洲廣告支援的影片點播(AVOD):市場佔有率分析、行業趨勢與統計數據及成長預測(2026-2031 年)交易型視訊點播 (TVOD):市場佔有率分析、行業趨勢和統計數據、成長預測 (2026-2031)訂閱式影片發送服務(SVOD):市場佔有率分析、行業趨勢和統計數據以及成長預測(2026-2031 年)
 隨選視訊市場:2026-2032年全球市場預測(依服務模式、內容類型、商品搭售結構、製作模式、語言提供、收費週期、影像品質、設備類型及供應商類型分類)
 2026-2030年全球視訊點播市場