


 |
市場調查報告書
商品編碼
2099881
訂閱式影片發送服務(SVOD):市場佔有率分析、行業趨勢和統計數據以及成長預測(2026-2031 年)Subscription Video-on-Demand (SVOD) - Market Share Analysis, Industry Trends & Statistics, Growth Forecasts (2026 - 2031) |
||||||

※ 本網頁內容可能與最新版本有所差異。詳細情況請與我們聯繫。
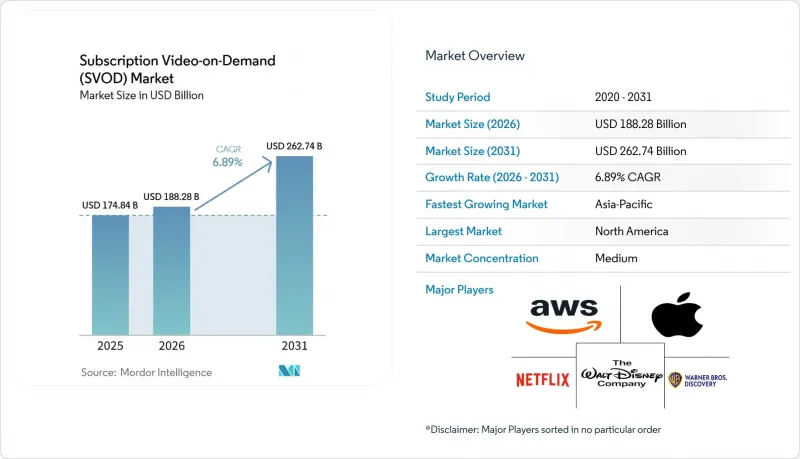
據 Mordor Intelligence 稱,2025 年訂閱影片發送服務(SVOD) 市場價值為 1748.4 億美元,預計到 2031 年將達到 2627.4 億美元,而 2026 年為 1882.8 億美元,預測期(2026-2031 年)的複合年成長率為 6.89%。
本報告按內容類型(電影、電視節目和劇集、紀錄片及其他內容)、設備類型(智慧型手機和平板電腦、智慧型電視、筆記型電腦和桌上型電腦及其他設備)以及地區(北美、南美、歐洲、亞太地區以及中東和非洲)進行細分。市場預測以美元計價。
全球發送服務隨選影片(SVOD) 市場的趨勢與見解。
優質原創內容的需求日益成長
優質原創節目仍然是訂閱影片發送服務市場的核心成長要素。這是因為獨家內容為平台提供了收取持續費用的理由。最具商業性價值的仍然是可重複利用的智慧財產權,電影和劇集可以支持續集、衍生劇、周邊產品銷售,並有助於培養更深層的觀眾忠誠度。 Netflix宣布計劃以現金收購華納兄弟探索頻道的串流媒體和工作室資產,顯示各大平台如今對其內容庫和長期特許經營權的重視程度之高。歐洲的內容監管法規也支持這一邏輯,因為那些已經投資於廣泛製作流程的平台能夠更好地履行本地內容分發義務,同時又不降低作品品質。這促使平台投資於能夠跨地區分發並適應當地觀眾的內容。因此,訂閱影片發送服務市場更青睞那些能夠將其內容投資多元化,涵蓋全球特許經營權、本地原創內容和多年分發計劃的平台。
擴展智慧電視和連網型設備的生態系統
連網型設備正在重塑訂閱影片發送服務市場,因為串流媒體功能如今已整合到人們日常使用的螢幕中。智慧電視作業系統的重要性前所未有,因為其在主螢幕和建議欄中的位置會影響每個家庭首先打開的內容。福斯收購 Roku 的協議表明,設備級控制正變得具有戰略意義,它不僅是通往第三方服務的途徑,本身也成為一種手段。類似的邏輯也體現在應用程式預裝和介面合作中,這些合作使得平台能夠在用戶選擇服務之前就更接近家庭入口。這降低了准入門檻,縮短了觀看路徑,並使加值服務和廣告支援服務都能在擁擠的家庭環境中保持存在感。在訂閱影片發送服務市場,設備擴展不再只是硬體趨勢,而是客戶獲取和留存策略的一部分。
成熟家庭的訂閱疲勞與流失
在成熟家庭中,訂閱疲勞正在限制訂閱影片發送服務(SVOD) 市場的成長,因為許多用戶已經同時訂閱了多個服務。這使得用戶更容易在平台結束其旗艦影片的發行週期或下架熱門影片時取消訂閱。問題不在於需求的急劇下降,而是用戶更傾向於戰術性反覆訂閱、暫停和重新啟用。這種行為使得收入前景不明朗,迫使服務提供者增加節目製作和推廣方面的支出,只是為了留住現有用戶。這也凸顯了影片發行時機、定價策略和捆綁內容在 SVOD 市場的重要性。因此,內容庫有限或區域相關性較弱的平台更容易出現短期使用和用戶忠誠度不穩定的情況。
細分市場分析
到2025年,電影和影像內容將佔據訂閱影片發送服務(SVOD)市場44.13%的佔有率,使影像娛樂成為付費串流平台的主要內容支柱。其優勢在於可重複利用的品牌價值、獨家發行期以及對不同年齡層和地區觀眾的廣泛吸引力。在SVOD市場中,電影庫發揮著至關重要的作用,確保即使在主要劇集上映的間隙,服務也能持續提供知名影片。電視節目和劇集內容仍然保持著第二大市場佔有率。這是因為持續觀看能夠培養用戶的習慣性,並使其用戶持續數週甚至數月。由於歐洲的目錄法規要求平台必須保持至少30%的目錄內容為歐洲影片,因此,內容的豐富性對於電影和影集內容而言都變得更加重要。
另一內容板塊成長最快,預計到2031年將以7.32%的複合年成長率成長,因為平台正在拓展其內容組合,不再局限於劇本娛樂。體育賽事直播、特別活動和互動形式打造了「必看」內容,使該板塊在訂閱影片發送服務(SVOD)行業中對客戶維繫和差異化尤為有效。紀錄片雖然規模仍然相對較小,但與高階劇本作品相比,其製作成本更低,並且在可靠性、主題多樣性和拓展片庫方面發揮重要作用。在歐洲,觀看歐盟電影在訂閱內容消費中仍然佔據重要地位,證明了持續投資於多元化的區域和本地內容庫的合理性。
區域分析
到2025年,北美將繼續保持其最大區域收入來源的地位,佔據訂閱影片發送服務(SVOD)市場39.61%的佔有率。該地區持續受益於較高的付費意願、廣泛的服務覆蓋範圍以及成熟的廣告支援服務市場。該地區的成長越來越依賴客戶維繫、商品搭售和價格策略,而非新增用戶。南美雖然規模仍然較小,但透過在地化內容和彈性價格設定,在付費訂閱方面擁有巨大的成長潛力。在訂閱影片發送服務市場,該地區的機會在於將行動和寬頻普及轉化為更長期的付費訂閱。
亞太地區是訂閱影片發送服務市場成長最快的地區,預計到2031年複合年成長率將達到7.86%。該地區的需求主要受年輕一代數位用戶、連網設備日益普及以及對本地語言故事的高度接受度所驅動。印度尤為突出,因為其市場規模並非依賴單一的國家內容策略,而是得益於對多種語言和使用模式的靈活適應。 JioHotstar在12種印度語言中部署音訊主導的發現功能,體現了其產品設計如何契合這一現實。另一方面,歐洲則走上了一條不同的道路,其成長與內容在地化以及遵守《視聽媒體服務指令》(AVMSD)的相關規定密切相關。
在中東和非洲,儘管訂閱視訊點播 (SVOD) 市場基數相對較小,但由於其年輕的人口結構、行動裝置的普及以及分銷夥伴關係關係,市場正在快速擴張。在海灣國家,富裕的數位消費者以及通訊業者主導的服務套餐發揮著重要作用,推動了付費串流媒體的成長。在整個非洲,基礎設施落後和貨幣波動持續阻礙付費串流媒體的普及,因此價格可負擔性和設備可及性成為該策略的核心。 Canal+ 收購 MultiChoice 凸顯了其透過區域平台、本地版權管理和更廣泛的數位分銷管道,在非洲市場不斷擴大規模的趨勢。
其他好處:
- Excel格式的市場預測(ME)表
- 3個月的分析師支持
目錄
第1章:引言
- 研究假設和市場定義
- 調查範圍
第2章:調查方法
第3章執行摘要
第4章 市場狀況
- 市場概覽
- 市場促進因素
- 優質原創內容的需求日益成長
- 擴展智慧電視和連網型設備的生態系統
- 包含通訊服務和付費電視服務的捆綁銷售。
- 成熟市場中廣告支援計畫的擴展
- 人工智慧驅動的個人化發現與客戶維繫工具
- 在高成長市場中擴展本地語言庫
- 市場限制因素
- 成熟家庭的訂閱疲勞與流失
- 內容許可費和體育賽事轉播權成本不斷上漲
- 跨平台的碎片化權利窗口
- 隱私和演算法透明度方面的合規負擔
- 宏觀經濟因素對市場的影響
- 產業價值鏈分析
- 監理情勢
- 技術展望
- 波特五力分析
第5章 市場規模與成長預測
- 按內容類型
- 電影和影像作品
- 電視節目和劇集內容
- 記錄
- 其他內容類型
- 依設備類型
- 智慧型手機和平板電腦
- 智慧電視
- 筆記型電腦和桌上型電腦
- 其他設備類型
- 按地區
- 北美洲
- 美國
- 加拿大
- 墨西哥
- 南美洲
- 巴西
- 阿根廷
- 智利
- 其他南美國家
- 歐洲
- 德國
- 英國
- 法國
- 義大利
- 西班牙
- 其他歐洲國家
- 亞太地區
- 中國
- 日本
- 印度
- 韓國
- 澳洲
- 其他亞太國家
- 中東
- 沙烏地阿拉伯
- 阿拉伯聯合大公國
- 卡達
- 其他中東國家
- 非洲
- 南非
- 埃及
- 奈及利亞
- 其他非洲國家
- 北美洲
第6章 競爭情勢
- 市場集中度
- 策略趨勢
- Vendor Positioning Analysis
- 公司簡介
- Netflix, Inc.
- Amazon.com, Inc.
- The Walt Disney Company
- Apple Inc.
- Warner Bros. Discovery, Inc.
- Paramount Skydance Corporation
- Comcast Corporation
- Alphabet Inc.
- Tencent Holdings Limited
- iQIYI, Inc.
- Alibaba Group Holding Limited
- Rakuten Group, Inc.
- Zee Entertainment Enterprises Limited
- JioStar India Private Limited
- DAZN Group Limited
- PCCW Limited
- MultiChoice Group Limited
- CANAL+SA
- Globo Comunicacao e Participacoes SA
- Sony Group Corporation
- MBC Group
第7章 市場機會與未來展望
According to Mordor Intelligence, the subscription video-on-demand market size was valued at USD 174.84 billion in 2025 and estimated to grow from USD 188.28 billion in 2026 to reach USD 262.74 billion by 2031, at a CAGR of 6.89% during the forecast period (2026-2031).
This report is Segmented by Content Type (Movies and Films, TV Shows and Episodic Content, Documentaries, Other Content Types), Device Type (Smartphones and Tablets, Smart TVs, Laptops and Desktops, Other Device Types), and Geography (North America, South America, Europe, Asia-Pacific, Middle East, and Africa). The Market Forecasts are Provided in Terms of Value (USD).
Global Subscription Video-on-Demand (SVOD) Market Trends and Insights
Rising Demand for Premium Original Content
Premium original programming remains a core growth lever in the subscription video-on-demand market because exclusive titles help platforms justify recurring payments. The strongest commercial value still sits in reusable intellectual property, where films and series can support sequels, spin-offs, merchandising, and deeper audience loyalty. Netflix's planned all-cash acquisition of Warner Bros. Discovery's streaming and studios assets showed how aggressively major players now value owned libraries and long-life franchises. European content rules reinforce this logic, because platforms that already invest in broad production pipelines are better placed to meet local catalog obligations without weakening release quality. This is pushing investment toward titles that can travel across regions while still being adapted for local audiences. As a result, the subscription video-on-demand market is rewarding platforms that can spread content spending across global franchises, local originals, and multi-year release slates.
Smart TV and Connected Device Ecosystem Expansion
Connected devices are reshaping the subscription video-on-demand market, because distribution is now built into the screens people use every day. Smart-TV operating systems matter more than before, since placement on home screens and recommendation rows can influence what households open first. Fox's agreement to acquire Roku showed that control of the device layer has become strategically important in its own right, not just as a route to third-party services. The same logic is visible in app pre-installation and interface partnerships, where platforms move closer to the household entry point before a user even chooses a service. This reduces sign-up friction, shortens the viewing path, and helps both premium and ad-supported services stay visible in crowded homes. For the subscription video-on-demand market, device expansion is no longer just a hardware trend; it is part of the customer acquisition and retention strategy.
Subscription Fatigue and Churn In Mature Households
Subscription fatigue is limiting the subscription video-on-demand market among mature households, where many users already pay for multiple services simultaneously. That makes cancellations easier to justify when a platform finishes a tentpole release cycle or loses a must-watch title. The problem is not a collapse in demand, but a more tactical pattern of joining, pausing, and returning. This behavior weakens revenue visibility and forces providers to spend more on programming and promotion just to hold the same household. It also raises the importance of release timing, pricing discipline, and bundled distribution inside the subscription video-on-demand market. Platforms with thinner catalogs or weaker local relevance are therefore more exposed to short-duration usage and inconsistent subscriber loyalty.
Other drivers and restraints analyzed in the detailed report include:
- Bundling With Telecom and Pay-TV Offers
- Ad-Supported Tier Expansion in Mature Markets
- Escalating Content Licensing and Sports Rights Costs
For complete list of drivers and restraints, kindly check the Table Of Contents.
Segment Analysis
Movies and Films held 44.13% of the subscription video-on-demand market share in 2025, making filmed entertainment the leading content anchor for paid streaming platforms. Their strength comes from repeatable franchise value, exclusive windows, and broad appeal across age groups and regions. In the subscription video-on-demand market, film libraries also help services maintain a visible pipeline of recognizable titles between major series launches. TV Shows and Episodic Content remained the second-largest segment because serial viewing supports habitual use and keeps subscribers returning across several weeks or months. European catalog rules reinforce the need for depth across both films and episodic content, since platforms must maintain a minimum 30% share of European works in their catalogs.
The other content types segment is the fastest-growing, projected to expand at a 7.32% CAGR through 2031 as platforms broaden their mix beyond scripted entertainment. Live sports, special events, and interactive formats create appointment viewing, which makes this part of the subscription video-on-demand industry especially useful for retention and differentiation. Documentaries remain smaller in scale, but they add credibility, subject variety, and catalog breadth at a lower production intensity than high-end scripted releases. In Europe, viewing of EU films retained a meaningful place in subscription catalog consumption, which supports the case for sustained investment in diverse local and regional libraries.
Complete Report Scope:
- By Content Type
- Movies and Films
- TV Shows and Episodic Content
- Documentaries
- Other Content Types
- By Device Type
- Smartphones and Tablets
- Smart TVs
- Laptops and Desktops
- Other Device Types
- By Geography
- North America
- United States
- Canada
- Mexico
- South America
- Brazil
- Argentina
- Chile
- Rest of South America
- Europe
- Germany
- United Kingdom
- France
- Italy
- Spain
- Rest of Europe
- Asia-Pacific
- China
- Japan
- India
- South Korea
- Australia
- Rest of Asia-Pacific
- Middle East
- Saudi Arabia
- United Arab Emirates
- Qatar
- Rest of Middle East
- Africa
- South Africa
- Egypt
- Nigeria
- Rest of Africa
- North America
Geography Analysis
North America held 39.61% of the subscription video-on-demand market share in 2025, maintaining its position as the largest regional revenue base. The region still benefits from a strong willingness to pay, broad service availability, and a mature ad-supported offering mix. Growth there is becoming more dependent on retention, bundling, and price realization than on first-time household adoption. South America remains a smaller base, but it offers meaningful headroom for unlocking wider paid use through local-language content and flexible pricing. For the subscription video-on-demand market, the region's opportunity lies in turning mobile and broadband adoption into longer-lasting paid relationships.
Asia-Pacific is the fastest-growing region in the subscription video-on-demand market, with a 7.86% CAGR projected through 2031. Demand in this region is being shaped by younger digital audiences, growing connected-device access, and strong acceptance of local-language storytelling. India stands out because scale depends on serving many languages and usage patterns rather than relying on a single national content formula. JioHotstar's rollout of voice-led discovery across 12 Indian languages reflected how product design is being tailored to this reality. Europe follows a different path, where growth is closely tied to content localization and regulatory compliance under the Audiovisual Media Services Directive.
The Middle East and Africa are growing from a smaller base in the SVOD market, with expansion shaped by youth demographics, mobile use, and distribution partnerships. In the Gulf states, paid streaming growth is supported by affluent digital consumers and a strong role for operator-led service packaging. Across Africa, infrastructure and currency volatility continue to slow wider adoption, keeping affordability and device access central to strategy. Canal+'s control of MultiChoice highlighted how scale in Africa is increasingly being built through regional platforms, local rights, and broader digital distribution.
- Netflix, Inc.
- Amazon.com, Inc.
- The Walt Disney Company
- Apple Inc.
- Warner Bros. Discovery, Inc.
- Paramount Skydance Corporation
- Comcast Corporation
- Alphabet Inc.
- Tencent Holdings Limited
- iQIYI, Inc.
- Alibaba Group Holding Limited
- Rakuten Group, Inc.
- Zee Entertainment Enterprises Limited
- JioStar India Private Limited
- DAZN Group Limited
- PCCW Limited
- MultiChoice Group Limited
- CANAL+ S.A.
- Globo Comunicacao e Participacoes S.A.
- Sony Group Corporation
- MBC Group
Additional Benefits:
- The market estimate (ME) sheet in Excel format
- 3 months of analyst support
TABLE OF CONTENTS
1 INTRODUCTION
- 1.1 Study Assumptions and Market Definition
- 1.2 Scope of the Study
2 RESEARCH METHODOLOGY
3 EXECUTIVE SUMMARY
4 MARKET LANDSCAPE
- 4.1 Market Overview
- 4.2 Market Drivers
- 4.2.1 Rising Demand for Premium Original Content
- 4.2.2 Smart TV and Connected Device Ecosystem Expansion
- 4.2.3 Bundling With Telecom and Pay-TV Offers
- 4.2.4 Ad-Supported Tier Expansion in Mature Markets
- 4.2.5 AI-Personalized Discovery and Retention Tools
- 4.2.6 Local-Language Library Expansion in High-Growth Markets
- 4.3 Market Restraints
- 4.3.1 Subscription Fatigue and Churn in Mature Households
- 4.3.2 Escalating Content Licensing and Sports Rights Costs
- 4.3.3 Fragmented Rights Windows Across Platforms
- 4.3.4 Privacy and Algorithm Transparency Compliance Burden
- 4.4 Impact of Macroeconomic Factors on the Market
- 4.5 Industry Value Chain Analysis
- 4.6 Regulatory Landscape
- 4.7 Technological Outlook
- 4.8 Porter's Five Forces Analysis
- 4.8.1 Bargaining Power of Buyers
- 4.8.2 Bargaining Power of Suppliers
- 4.8.3 Threat of New Entrants
- 4.8.4 Threat of Substitutes
- 4.8.5 Intensity of Competitive Rivalry
5 MARKET SIZE AND GROWTH FORECASTS (VALUE)
- 5.1 By Content Type
- 5.1.1 Movies and Films
- 5.1.2 TV Shows and Episodic Content
- 5.1.3 Documentaries
- 5.1.4 Other Content Types
- 5.2 By Device Type
- 5.2.1 Smartphones and Tablets
- 5.2.2 Smart TVs
- 5.2.3 Laptops and Desktops
- 5.2.4 Other Device Types
- 5.3 By Geography
- 5.3.1 North America
- 5.3.1.1 United States
- 5.3.1.2 Canada
- 5.3.1.3 Mexico
- 5.3.2 South America
- 5.3.2.1 Brazil
- 5.3.2.2 Argentina
- 5.3.2.3 Chile
- 5.3.2.4 Rest of South America
- 5.3.3 Europe
- 5.3.3.1 Germany
- 5.3.3.2 United Kingdom
- 5.3.3.3 France
- 5.3.3.4 Italy
- 5.3.3.5 Spain
- 5.3.3.6 Rest of Europe
- 5.3.4 Asia-Pacific
- 5.3.4.1 China
- 5.3.4.2 Japan
- 5.3.4.3 India
- 5.3.4.4 South Korea
- 5.3.4.5 Australia
- 5.3.4.6 Rest of Asia-Pacific
- 5.3.5 Middle East
- 5.3.5.1 Saudi Arabia
- 5.3.5.2 United Arab Emirates
- 5.3.5.3 Qatar
- 5.3.5.4 Rest of Middle East
- 5.3.6 Africa
- 5.3.6.1 South Africa
- 5.3.6.2 Egypt
- 5.3.6.3 Nigeria
- 5.3.6.4 Rest of Africa
- 5.3.1 North America
6 COMPETITIVE LANDSCAPE
- 6.1 Market Concentration
- 6.2 Strategic Moves
- 6.3 Vendor Positioning Analysis
- 6.4 Company Profiles (includes Global Level Overview, Market Level Overview, Core Segments, Financials as available, Strategic Information, Market Rank/Share, Products and Services, Recent Developments)
- 6.4.1 Netflix, Inc.
- 6.4.2 Amazon.com, Inc.
- 6.4.3 The Walt Disney Company
- 6.4.4 Apple Inc.
- 6.4.5 Warner Bros. Discovery, Inc.
- 6.4.6 Paramount Skydance Corporation
- 6.4.7 Comcast Corporation
- 6.4.8 Alphabet Inc.
- 6.4.9 Tencent Holdings Limited
- 6.4.10 iQIYI, Inc.
- 6.4.11 Alibaba Group Holding Limited
- 6.4.12 Rakuten Group, Inc.
- 6.4.13 Zee Entertainment Enterprises Limited
- 6.4.14 JioStar India Private Limited
- 6.4.15 DAZN Group Limited
- 6.4.16 PCCW Limited
- 6.4.17 MultiChoice Group Limited
- 6.4.18 CANAL+ S.A.
- 6.4.19 Globo Comunicacao e Participacoes S.A.
- 6.4.20 Sony Group Corporation
- 6.4.21 MBC Group
7 MARKET OPPORTUNITIES AND FUTURE OUTLOOK
- 7.1 White-Space and Unmet-Need Assessment

 非洲SVOD市場:市場佔有率分析、產業趨勢與統計及成長預測(2026-2031年)
 2026-2030年全球影音隨選市場北美廣告視訊點播(AVOD):市場佔有率分析、行業趨勢和統計數據以及成長預測(2026-2031 年)中東和非洲的廣告視訊點播 (AVOD):市場佔有率分析、行業趨勢與統計數據、成長預測 (2026-2031)南美洲廣告視訊點播 (AVOD):市場佔有率分析、產業趨勢與統計數據、成長預測 (2026-2031)歐洲廣告支援的影片點播(AVOD):市場佔有率分析、行業趨勢與統計數據及成長預測(2026-2031 年)交易型視訊點播 (TVOD):市場佔有率分析、行業趨勢和統計數據、成長預測 (2026-2031)廣告支援的視訊點播(AVOD):市場佔有率分析、行業趨勢和統計數據以及成長預測(2026-2031 年)
 隨選視訊市場:2026-2032年全球市場預測(依服務模式、內容類型、商品搭售結構、製作模式、語言提供、收費週期、影像品質、設備類型及供應商類型分類)
 2026-2030年全球視訊點播市場