


 |
市場調查報告書
商品編碼
2119014
美國電子商務最後一公里配送:市場佔有率分析、產業趨勢與統計、成長預測(2026-2031)United States E-Commerce Last-Mile Delivery - Market Share Analysis, Industry Trends & Statistics, Growth Forecasts (2026 - 2031) |
||||||

※ 本網頁內容可能與最新版本有所差異。詳細情況請與我們聯繫。
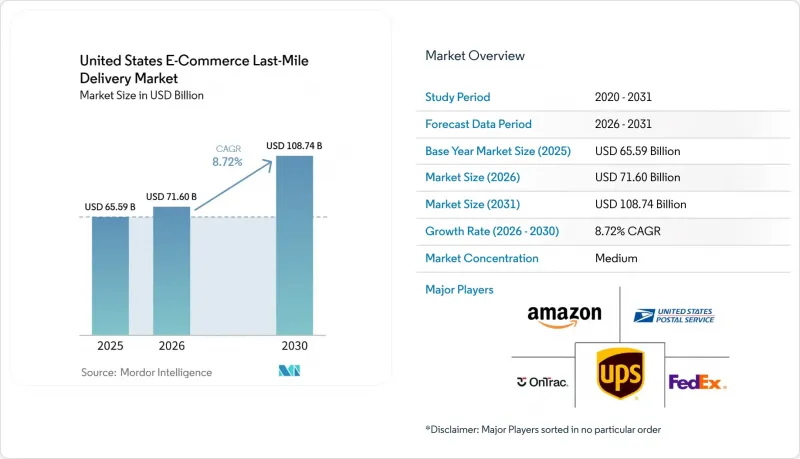
據 Mordor Intelligence 稱,2025 年美國電子商務最後一公里配送市場價值為 655.9 億美元,預計到 2031 年將達到 1087.4 億美元,而 2026 年為 716 億美元,2026 年至 2031 年預測期內的複合成長率為 8.72%。
如今,配送速度已成為影響消費者購買決策的更直接因素,隨著亞馬遜將當日達和隔天達服務覆蓋範圍擴展至小規模城市和社區,服務標準也不斷提高。本報告依配送類型(標準配送、當日達、隔日達)、配送模式(B2C、B2B、C2C)、城市等級(一線、二線、三線及以下)、產品類型(食品飲料、個人護理及家居用品、時尚生活用品、家具、其他)及地區(東北部、東南部、中西部、西南部、西部)進行分類。市場預測以美元計價。
美國電子商務最後一公里配送市場的趨勢與洞見。
都市區電商走廊對當日達和隔日達的需求不斷成長
在美國電商最後一公里配送市場,速度不再只是一項高級附加服務,而是一項核心服務要求。 2025年,亞馬遜將當日達和隔日達服務擴展至美國4,000多個小規模城市和鄉村地區,並為此投資40億美元,將其鄉村配送網路規模擴大三倍。 2026年5月,亞馬遜推出「Amazon Now」服務,在包括亞特蘭大、達拉斯/沃斯堡、履約和西雅圖在內的數十個美國城市實現30分鐘送達。這項發展表明,主要企業正在將庫存轉移到需求更近的地方,並將配送速度轉變為更本地化的營運挑戰。這也提高了那些仍依賴速度較慢的全國性配送模式的零售商的服務標準。因此,擁有密集都市區覆蓋、高效庫存佈局和時限穩定執行能力的承運商和平台在美國電商最後一公里配送市場擁有顯著優勢。
透過微型倉配和路線最佳化提高小包裹密度。
小包裹密度是美國電商最後一公里配送市場最重要的成本因素之一。亞馬遜表示,它利用20多種機器學習模型,透過分析交通狀況和即時營運情況來最佳化路線選擇,並持續最佳化配送路線直到包裹裝載完成。 2026年7月,Descartes Systems Group收購了Drivin,為其最後一公里軟體產品組合增添了路線最佳化和基於人工智慧的調度工具。 2025年發表在《科學報告》(Scientific Reports)上的一項研究表明,感知交通狀況的路線規劃和自適應調度可以減少未送達包裹的數量,並降低都市區配送系統中的單次配送成本。微型倉配透過將庫存放置在更靠近客戶的位置,並縮短單次配送距離,進一步增強了這些效果。隨著這些技術的普及,能夠將軟體智慧與本地庫存管理和路線規劃相結合的營運商,在美國電商最後一公里配送市場中將佔據更有利的地位。
住宅需額外收費,且因配送失敗導致最後一公里成本增加。
在美國電商最後一公里配送市場,住宅配送成本的成長速度已經超過了許多承運商僅靠貨量成長所能抵銷的幅度。儘管UPS和FedEx都已宣布2026年整體費率上調5.9%,但住宅附加費的成長速度遠超這一漲幅,FedEx的附加費從5.95美元上調至6.45美元,UPS則從6.10美元上調至6.50美元。因此,主要配送至住宅的包裹所面臨的風險遠超整體費率上漲所能反映的。這種壓力在配送密度較低但消費者對「免費送貨」期望仍然很高的地區尤為突出。這種情況也促使各承運商重新檢視配送路線,加強服務區域規劃,並更多地使用替代配送中心。在美國電商最後一公里配送市場,這種成本結構有利於那些能夠縮短路線、減少重複配送並降低路線層級額外費用風險的承運商。
細分市場分析
2025年,隔日達將占美國電商最後一公里配送市場的41.22%,成為以金額為準最高的配送方式。此地位反映出快速配送已成為各大線上零售品類的基本預期。亞馬遜生態系統以外的零售商不再是為了差異化而建構隔日達系統,而是為了維護美國電商最後一公里配送市場的可靠性。監管限制、配送路線長以及配送密度低意味著,在許多地區,標準配送服務仍然至關重要。
預計到2031年,當日達服務將以12.17%的複合年成長率成長,這表明最快的服務層級正在從都市區的有限高階應用場景擴展到更廣泛的地區。亞馬遜於2026年5月推出的「Amazon Now」服務進一步降低了服務門檻,在美國數十個城市提供30分鐘送達服務。此舉意義重大,因為它將服務層級從「標準」與「特快」的二元分類轉變為更精細的速度等級分類。對於長途配送和快捷郵件敏感型訂單而言,標準配送仍然發揮著至關重要的作用,因為在這些情況下,更快的配送方式並不划算。在美國電商最後一公里配送市場,預計當日達服務將在人口密集的都市區成長最快,次日達服務仍將擁有廣泛的商業基礎,而標準配送服務將繼續在郊區和農村地區的配送路線中扮演重要角色。
到2025年,B2C配送將占美國電商最後一公里配送市場規模的65.1%,這印證了住宅零售需求仍是該領域最大的需求來源。多年來,大型零售商和宅配公司的持續投入使B2C成為最成熟的營運模式。由於其規模龐大,住宅配送成本、配送時限以及配送服務商效率的變化都會對整個市場產生深遠影響。 2026年第一季,Instacart透過重新設計的數位店面和提供專屬的履約支持,擴大了與ALDI的企業級履約合作。這表明,基於平台的履約模式正在不斷模糊美國電商最後一公里配送市場的需求邊界。
預計到2031年,C2C模式將以14.84%的複合年成長率成長,成為目前結構下成長最快的配送模式。這一成長與轉售平台和二手交易活動密切相關,這些活動在傳統零售供應鏈之外創造了小包裹需求。 C2C成長的重要性在於它帶來了更不規則的運輸模式、波動的取貨點和分散的始發地。這些特點使得柔軟性的本地業者和基於應用程式的配送網路在某些路線上顯得尤為重要。 B2B模式在電商最後一公里配送領域規模仍較小,但仍支撐著工業用品、商業補貨和常規商業配送等相當數量的貨物運輸。隨著B2B與電商之間的界線日益模糊,美國電商最後一公里配送業將需要更靈活的取貨、逆向物流和訂單調整能力,以適應結構化的零售流程和不可預測的P2P小包裹交易。
其他好處:
- Excel格式的市場預測(ME)表
- 3個月的分析師支持
目錄
第1章:引言
- 市場分析與定義的前提條件
- 分析範圍
第2章 分析方法
第3章執行摘要
第4章 市場狀況
- 市場概況及最後一公里配送在電子商務中的作用
- 電子商務消費趨勢
- 市場促進因素
- 主要都市區電商區域對當日達和次日達的需求不斷成長。
- 透過微型倉配和路線最佳化提高小包裹密度。
- 擺脫對單一職業的依賴,實現職業多元化
- 擴大替代配送地點、儲物櫃和自提網路
- 分類、出貨和異常處理自動化。
- 城市道路上頻繁停車的永續車輛轉型
- 市場限制因素
- 住宅配送需額外收費,且因配送失敗導致最後一公里配送成本上升。
- 旺季期間司機短缺和運輸能力受限
- 地址資訊品質參差不齊,郊區服務提供困難,導致城市擴張現象嚴重。
- 各州和各城市的法規和勞動合規要求的複雜程度各不相同。
- 法律規範
- 價值鍊和分銷管道的結構分析
- 技術創新的前景
- 波特五力分析
- 電子商務最後一公里配送需求的演變
- 定價和成本結構分析
- 分析消費者行為與配送偏好
- 永續交付解決方案和綠色物流舉措
- 地緣政治事件對供應鏈變化的影響
第5章:市場規模與成長率預測(以金額為準,2026-2031 年)
- 按配送方式
- 標準配送
- 當日送達
- 隔日送達
- 交付模式
- 企業對消費者 (B2C)
- 企業對企業 (B2B) 交易
- 個人對個人(C2C)交易
- 城市層級
- 一級
- 二級
- 三級及以下
- 依產品類型
- 食品/飲料
- 個人護理和家居用品
- 時尚與生活方式(配件、服裝、鞋類)
- 家具
- 家用電子電器/家用電器
- 其他產品
- 按地區
- 東北
- 東南
- 中西部
- 西南
- 西
第6章 競爭情勢
- 市場集中度
- 關鍵策略趨勢
- 市佔率分析
- 公司簡介
- Amazon, Inc.
- United Parcel Service of America, Inc.
- FedEx
- United States Postal Service(USPS)
- OnTrac
- DHL Group
- Pitney Bowes, Inc.
- Veho Tech, Inc.
- Target Corporation
- DoorDash, Inc.
- Instacart, Inc.
- Uber Technologies, Inc.
- Walmart, Inc.
- Better Trucks
- Jitsu
- UniUni
- SpeedX
- Sway
- International Distribution Service plc
- Dropoff, Inc.
- RXO, Inc.
- GoFor
第7章 市場機會與未來展望
According to Mordor Intelligence, the United States e-commerce last-mile delivery market size was valued at USD 65.59 billion in 2025 and is estimated to grow from USD 71.6 billion in 2026 to reach USD 108.74 billion by 2031, at a CAGR of 8.72% during the forecast period 2026-2031.
Delivery speed now shapes purchasing behavior more directly, and the service baseline keeps moving higher as Amazon expands same-day and next-day coverage into smaller cities and rural communities. This report is Segmented by Delivery Type (Standard, Same-Day, Next-Day), by Delivery Model (B2C, B2B, C2C), City Tier (Tier 1, Tier 2, Tier 3 & Below), by Product Type (Foods & Beverages, Personal & Household Care, Fashion & Lifestyle, Furniture, and More), and by Geography (Northeast, Southeast, Midwest, Southwest, West). The Market Forecasts are Provided in Terms of Value (USD).
United States E-Commerce Last-Mile Delivery Market Trends and Insights
Rising Demand for Same-Day and Next-Day Delivery in Urban E-Commerce Corridors
Speed has become a core service requirement in the United States e-commerce last-mile delivery market, not a premium add-on. Amazon expanded same-day and next-day delivery to more than 4,000 smaller United States cities and rural communities in 2025, supported by a USD 4 billion investment to triple its rural delivery network. In May 2026, Amazon launched Amazon Now and brought 30-minute delivery to dozens of US cities, including Atlanta, Dallas-Fort Worth, Philadelphia, and Seattle. That rollout shows how major operators are shifting inventory closer to demand and turning fulfillment speed into a more local operating problem. It also raises the service threshold for retailers that still depend on slower national routing models. The result is a United States e-commerce last-mile delivery market that rewards carriers and platforms with dense urban coverage, tight inventory positioning, and consistent execution within short windows.
Parcel Density Gains from Micro-Fulfillment and Route Optimization
Parcel density has become one of the most important cost levers in the United States e-commerce last-mile delivery market. Amazon states that it uses more than 20 machine learning models to refine delivery routes up to the point when a package is loaded, using traffic and real-time operating conditions to improve route selection. In July 2026, Descartes Systems Group acquired Drivin, adding route optimization and AI-based dispatch tools to its last-mile software portfolio. Research published in Scientific Reports in 2025 found that traffic-aware routing and adaptive dispatch can reduce missed deliveries and lower per-stop costs in urban delivery systems. Micro-fulfillment supports those gains by placing inventory closer to the order location and reducing the distance per stop. As these methods spread, the United States e-commerce last-mile delivery market becomes more favorable to operators that can combine software intelligence with localized inventory and route planning.
Last-Mile Cost Inflation from Residential Surcharges and Failed Delivery Attempts
Residential delivery costs are rising faster than many operators can offset through volume alone in the United States e-commerce last-mile delivery market. UPS and FedEx both implemented a 5.9% general rate increase for 2026, but residential surcharges increased faster, with FedEx moving from USD 5.95 to USD 6.45 and UPS moving from USD 6.10 to USD 6.50. That makes residential-heavy shipping books more exposed than the headline rate increase suggests. The pressure is strongest where delivery density is low, and customer expectations for free shipping remain high. It also encourages more route audits, stricter service-area planning, and wider use of alternative delivery points. In the United States e-commerce last-mile delivery market, this cost profile favors operators that can shorten routes, reduce reattempts, and control surcharge exposure at the lane level.
Other drivers and restraints analyzed in the detailed report include:
- Carrier Diversification Away from Single-Carrier Dependence
- Automation in Sortation, Dispatch, and Exception Management
- Driver Shortages and Peak-Season Capacity Constraints
For complete list of drivers and restraints, kindly check the Table Of Contents.
Segment Analysis
Next-day delivery held 41.22% of the United States e-commerce last-mile delivery market share in 2025, making it the largest delivery type by value. That position reflects how fast delivery has become a standard expectation across major online retail categories. Retailers outside Amazon's ecosystem are no longer building next-day capacity to stand out. They are building it to stay credible in the United States e-commerce last-mile delivery market. Compliance limits, route length, and low delivery density keep standard service relevant in many parts of the country.
Same-day delivery is projected to expand at a 12.17% CAGR through 2031, indicating that the fastest service tier is moving beyond a narrow urban premium use case. Amazon's May 2026 launch of Amazon Now pushed that benchmark even lower by offering 30-minute delivery in dozens of US cities. That move matters because it shifts the service ladder from standard versus expedited into a more granular speed hierarchy. Standard delivery still plays an important role for long-zone shipments and value-oriented orders where rapid fulfillment does not justify the cost. Over time, the United States e-commerce last-mile delivery market is likely to see same-day grow fastest in dense metros, while next-day remains the broad commercial anchor and standard delivery stays important in outer-zone and rural lanes.
B2C delivery captured 65.1% of the United States e-commerce last-mile delivery market size in 2025, confirming that residential retail demand remains the sector's largest volume engine. Years of investment by major retailers and parcel operators have made B2C the most established operating model. Its scale also means that changes in residential delivery cost, customer promise windows, and carrier productivity have a wide effect across the market. Instacart expanded its enterprise fulfillment relationship with ALDI in Q1 2026 through a redesigned digital storefront and exclusive fulfillment support, showing how platform-based fulfillment models continue to blur demand boundaries across the United States e-commerce last-mile delivery market.
C2C is forecast to grow at 14.84% CAGR through 2031, making it the fastest-moving delivery model in the current structure. That growth is linked to resale platforms and recommerce activity that create parcel demand outside traditional retail supply chains. C2C growth matters because it introduces more uneven shipment patterns, variable pickup points, and dispersed origin locations. Those traits make flexible regional operators and app-based delivery networks more relevant in selected lanes. B2B remains smaller in the e-commerce last-mile setting, but it still supports meaningful volume in industrial supplies, commercial replenishment, and scheduled business deliveries. As that blurring continues, the United States e-commerce last mile delivery industry will need more flexible pickup, reverse logistics, and order orchestration capabilities to serve both structured retail flows and less predictable peer-originated parcel activity.
Complete Report Scope:
- By Delivery Type
- Standard Delivery
- Same-Day Delivery
- Next-Day Delivery
- By Delivery Model
- Business-to-Consumer (B2C)
- Business-to-Business (B2B)
- Consumer-to-Consumer (C2C)
- By City Tier
- Tier 1
- Tier 2
- Tier 3 and Below
- By Product Type
- Foods and Beverages
- Personal and Household Care
- Fashion and Lifestyle (Accessories, Apparel, Footwear)
- Furniture
- Consumer Electronics and Household Appliances
- Other Products
- By Region
- Northeast
- Southeast
- Midwest
- Southwest
- West
List of Companies Covered in this Report:
- Amazon, Inc.
- United Parcel Service of America, Inc.
- FedEx
- United States Postal Service (USPS)
- OnTrac
- DHL Group
- Pitney Bowes, Inc.
- Veho Tech, Inc.
- Target Corporation
- DoorDash, Inc.
- Instacart, Inc.
- Uber Technologies, Inc.
- Walmart, Inc.
- Better Trucks
- Jitsu
- UniUni
- SpeedX
- Sway
- International Distribution Service plc
- Dropoff, Inc.
- RXO, Inc.
- GoFor
Additional Benefits:
- The market estimate (ME) sheet in Excel format
- 3 months of analyst support
TABLE OF CONTENTS
1 Introduction
- 1.1 Study Assumptions and Market Definition
- 1.2 Scope of the Study
2 Research Methodology
3 Executive Summary
4 Market Landscape
- 4.1 Market Overview and Role of Last-Mile Delivery in E-Commerce Logistics
- 4.2 E-Commerce Spending Trends
- 4.3 Market Drivers
- 4.3.1 Rising Demand for Same-Day and Next-Day Delivery in Urban E-Commerce Corridors
- 4.3.2 Parcel Density Gains from Micro-Fulfillment and Route Optimization
- 4.3.3 Carrier Diversification Away From Single-Carrier Dependence
- 4.3.4 Growth of Alternative Delivery Points, Lockers, and Pickup Networks
- 4.3.5 Automation in Sortation, Dispatch, and Exception Management
- 4.3.6 Sustainable Fleet Transition in High-Stop-Density Urban Routes
- 4.4 Market Restraints
- 4.4.1 Last-Mile Cost Inflation from Residential Surcharges and Failed Delivery Attempts
- 4.4.2 Driver Shortages and Peak-Season Capacity Constraints
- 4.4.3 Fragmented Address Quality and Hard-to-Serve Suburban Sprawl
- 4.4.4 Regulatory and Labor Compliance Complexity Across States and Cities
- 4.5 Regulatory Framework
- 4.6 Value Chain and Distribution Channel Architecture Analysis
- 4.7 Technology Innovations Outlook
- 4.8 Porter's Five Forces Analysis
- 4.8.1 Threat of New Entrants
- 4.8.2 Bargaining Power of Suppliers
- 4.8.3 Bargaining Power of Buyers
- 4.8.4 Threat of Substitutes
- 4.8.5 Rivalry Among Competitors
- 4.9 Evolution of E-Commerce Last-Mile Delivery Requirements
- 4.10 Pricing and Cost Structure Analysis
- 4.11 Consumer Behavior and Delivery Preferences Analysis
- 4.12 Sustainable Delivery Solutions and Green Logistics Initiatives
- 4.13 Impact of Geo-Political Events on Supply Chain Shifts
5 Market Size and Growth Forecasts (Value, 2026-2031)
- 5.1 By Delivery Type
- 5.1.1 Standard Delivery
- 5.1.2 Same-Day Delivery
- 5.1.3 Next-Day Delivery
- 5.2 By Delivery Model
- 5.2.1 Business-to-Consumer (B2C)
- 5.2.2 Business-to-Business (B2B)
- 5.2.3 Consumer-to-Consumer (C2C)
- 5.3 By City Tier
- 5.3.1 Tier 1
- 5.3.2 Tier 2
- 5.3.3 Tier 3 and Below
- 5.4 By Product Type
- 5.4.1 Foods and Beverages
- 5.4.2 Personal and Household Care
- 5.4.3 Fashion and Lifestyle (Accessories, Apparel, Footwear)
- 5.4.4 Furniture
- 5.4.5 Consumer Electronics and Household Appliances
- 5.4.6 Other Products
- 5.5 By Region
- 5.5.1 Northeast
- 5.5.2 Southeast
- 5.5.3 Midwest
- 5.5.4 Southwest
- 5.5.5 West
6 Competitive Landscape
- 6.1 Market Concentration
- 6.2 Key Strategic Moves
- 6.3 Market Share Analysis
- 6.4 Company Profiles (includes Global Level Overview, Market Level Overview, Core Segments, Financials as Available, Strategic Information, Market Rank/Share for Key Companies, Products & Services, and Recent Developments)
- 6.4.1 Amazon, Inc.
- 6.4.2 United Parcel Service of America, Inc.
- 6.4.3 FedEx
- 6.4.4 United States Postal Service (USPS)
- 6.4.5 OnTrac
- 6.4.6 DHL Group
- 6.4.7 Pitney Bowes, Inc.
- 6.4.8 Veho Tech, Inc.
- 6.4.9 Target Corporation
- 6.4.10 DoorDash, Inc.
- 6.4.11 Instacart, Inc.
- 6.4.12 Uber Technologies, Inc.
- 6.4.13 Walmart, Inc.
- 6.4.14 Better Trucks
- 6.4.15 Jitsu
- 6.4.16 UniUni
- 6.4.17 SpeedX
- 6.4.18 Sway
- 6.4.19 International Distribution Service plc
- 6.4.20 Dropoff, Inc.
- 6.4.21 RXO, Inc.
- 6.4.22 GoFor
7 Market Opportunities and Future Outlook
- 7.1 White-space and Unmet-Need Assessment

 新加坡最後一公里配送:市佔率分析、產業趨勢與統計及成長預測(2026-2031)印度D2C(直接面對消費者)物流:市場佔有率分析、行業趨勢和統計數據以及成長預測(2026-2031年)德國最後一公里配送:市場佔有率分析、產業趨勢與統計及成長預測(2026-2031 年)歐洲電子商務最後一公里配送:市場佔有率分析、產業趨勢與統計及成長預測(2026-2031 年)印度電子商務最後一公里配送:市場佔有率分析、產業趨勢與統計及成長預測(2026-2031)
 全球末端配送車輛市場預測(至2034年)-按車輛類型、動力系統、有效載荷能力、自動化程度、所有權、應用、最終用戶、銷售管道、分銷管道和地區分類的分析美國醫療小包裹最後一公里配送:市場佔有率分析、產業趨勢與統計及成長預測(2026-2031 年)英國醫療小包裹最後一公里配送:市場佔有率分析、產業趨勢與統計及成長預測(2026-2031 年)
 自主最後一公里配送市場-2026-2032年全球市場預測食品低溫運輸最後一公里配送市場:全球市場預測(2026-2032 年)