


 |
市場調查報告書
商品編碼
2116585
化學品物流:市場佔有率分析、產業趨勢與統計、成長預測(2026-2031)Chemical Logistics - Market Share Analysis, Industry Trends & Statistics, Growth Forecasts (2026 - 2031) |
||||||

※ 本網頁內容可能與最新版本有所差異。詳細情況請與我們聯繫。
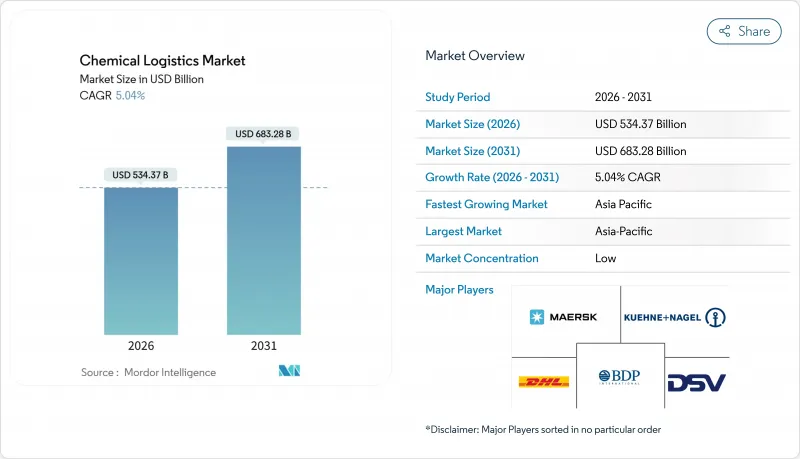
據 Mordor Intelligence 稱,2026 年化學品物流市場規模估計為 5343.7 億美元,預計在預測期(2026-2031 年)內將以 5.04% 的複合年成長率成長,到 2031 年達到 6832.8 億美元。
本報告依服務類型(運輸、倉儲等)、終端用戶產業(製藥、化妝品、石油天然氣、特殊化學品等)、危險物品分類(危險物品、非危險物品)、溫度控制(溫控、非溫控)以及地區(北美、歐洲、其他)分類。市場預測以美元計價。
全球化工物流市場趨勢與洞察
亞洲化工產品生產的擴張正在推動長途運輸量的成長。
印度PCPIR區域和中國當地產能的提升正促使出口路線轉向歐洲和北美,導致運輸距離延長,噸英里需求增加。紅海航線改道後,亞歐之間的標準運輸時間進一步延長,從而提高了船舶運轉率,並為鐵路-海運多式聯運走廊提供了更多機會。儘管印度政府的獎勵措施已將生產集中在叢集,但內陸消費模式導致國內運輸距離延長,這為提供鐵路、公路和駁船一體化解決方案的營運商創造了機會。
擴大多模態網路的使用,同時考慮危險物質的成本和安全性。
與陸上運輸相比,海陸聯運系統可減少81%的溫室氣體排放和70%的物流成本,但其有效實施取決於不同運輸方式交會點的各項法規能否無縫銜接。美國聯邦鐵路管理局強調,在與公共產業公司合作的支持下,雙模機車和間歇性電氣化在散裝化學品運輸走廊中具有成本效益。歐洲營運商如Bertschi已透過整合鐵路、駁船和公路運輸的綜合碼頭,每年減少30萬噸二氧化碳排放。
資本投資龐大,資產和保險要求也很嚴格。
不鏽鋼ISO罐、溫控底盤和防爆倉庫的成本是普通貨物運輸設施的兩到三倍。 Peacock Containers公司斥資3.5億美元用於永續發展的設施擴建項目,清楚展現了車隊現代化所需的巨額資金。危險品運輸的保險費目前占公司收入的5%之多,進一步提高了該行業的進入門檻。
細分市場分析
到2025年,運輸業在化學品物流市場的佔有率仍將維持在65.14%,因為實體運輸仍然至關重要。然而,涵蓋混合、合規管理和編配平台等「其他服務」預計將以6.41%的複合年成長率成長,這反映出托運人對能夠減輕管理負擔的一站式解決方案的需求。加值倉儲透過將庫存放置在更靠近消費點的位置來支援營運資金計劃,而數位化平台則收集廢氣數據,這些數據構成了預測性調度和排放報告的基礎。 DHL收購CryoPDP每年新增60萬件溫控貨物運輸,顯示這些「補充」如何加速了運力擴張。
第二代4PL模式透過將承運商採購、控制塔分析和合規文件整合到訂閱包中,實現了物流協調的編配。隨著托運人將這些API整合到其企業資源計畫(ERP)系統中,切換成本增加,使得物流供應商即使在大宗商品運輸領域也能保持獲利。因此,在化學物流市場,利潤來源正從貨運量轉向資訊、風險管理和更緊密的客戶客製化服務。
石油和天然氣產業擁有從煉油廠到石化廠的成熟物流體系,預計到2025年將佔化學品物流市場規模的30.57%,但其成長緩慢正給供應商帶來價格壓力。特種化學物品部門預計將以6.72%的複合年成長率成長,這主要得益於鋰離子電池電解和醫藥中間體對精密處理、儲存歷史記錄以及溫控環境的需求。阿貢國家實驗室預測,到2030年,電池級電解的產量將超過1300吉瓦時,對濕度控制槽式貨櫃的需求將增加數倍。
藥品和化妝品的運輸受GDP(良好分銷規範)和GMP(良好生產規範)法規的約束,要求進行認證存儲和可追溯運輸,這既保證了收入穩定,也使符合這些標準的承運人能夠自主定價。化妝品原料向植物萃取物的轉變催生了小批量、高頻率的運輸路線。這些路線不適合散裝油罐車隊,但非常適合ISO罐式運輸和區域倉庫網路。因此,化學品物流市場面臨兩極化的成長,低利潤的通用貨物運輸和需要差異化專業知識的高價值專業化細分市場並存。
區域分析
預計到2025年,亞太地區將佔全球營收的39.21%,並在2031年之前以6.31%的複合年成長率成長。中國的出口過剩產能正在推動亞洲內部貿易,並將貨物分流至印度和東南亞,形成新的多模態路線,這些路線匯集了港口、專用貨運走廊和沿海航運。印度的PCPIR叢集是東西海岸綜合體的核心,隨著內陸需求的成長,國內公路和鐵路正在延伸,這增加了對ISO罐式貨櫃搬遷服務的需求。
北美和歐洲仍然是主要市場,這得益於其發達的鐵路網路、嚴格的安全標準和高度的數位化水準。歐洲ADR和CLP框架的修訂促使鐵路車輛現代化改造和數位化標籤的採用,從而鼓勵托運人與獲得認證的供應商簽訂長期合約。在北美,連接墨西哥灣沿岸石化聯合企業和中西部消費者的綜合鐵路走廊提供了經濟高效、低排放的運輸方式,這有利於擁有TransRoad碼頭的營運商。
南美洲和非洲擁有巨大的成長空間,但基礎設施的匱乏限制了其發展潛力。拉各斯、德班和蒙巴薩港口的等待時間延長,推高了庫存成本,迫使承運商維持緩衝庫存。非洲大陸自由貿易區(AfCFTA)旨在協調海關程序,但過渡期內的分散化使得各國專業知識和紮根當地的夥伴關係關係至關重要。儘管面臨這些挑戰,拉丁美洲的近岸外包趨勢正迫使化學生產商將中間加工環節轉移到更靠近美國買家的地方,從而加速了擁有雙語員工和報關代理網路的企業的運輸走廊建設。
其他好處:
- Excel格式的市場預測(ME)表
- 3個月的分析師支持
目錄
第1章:引言
- 研究假設和市場定義
- 調查範圍
第2章:調查方法
第3章執行摘要
第4章 市場狀況
- 市場概覽
- 市場促進因素
- 亞洲化工產品生產的擴張正在推動長途航運量的成長。
- 擴大多模態網路的使用,同時考慮危險物質的成本和安全性。
- 監管部門致力於推動更安全、更環保的物流資產和實踐
- 將供應鏈職能外包給第三方/第四方物流 (3PL/4PL) 專業公司
- 低碳甲醇和生物基供應鏈正在創造新的通路。
- 透過數位孿生平台實現人工智慧驅動的可視化和即時合規性。
- 市場限制因素
- 資本投資是一項龐大的資產和保險需求。
- 分散的合規負擔跨越多個司法管轄區
- 燃油價格波動給企業的利潤率帶來了壓力。
- 新興市場持證危險物品運輸司機短缺
- 價值供應鏈分析
- 產業的技術創新
- 政府法規和政策
- 波特五力模型
- 地緣政治事件對市場的影響
第5章 市場規模與成長預測
- 按服務
- 運輸
- 路
- 鐵路
- 海事/海洋
- 航空
- 倉儲、物流和庫存管理
- 其他服務
- 運輸
- 按最終用戶行業分類
- 製藥
- 化妝品和個人護理
- 石油和天然氣
- 特種化學品
- 其他最終用戶
- 依危險分類
- 危險化學品
- 無害化學品
- 按類型控制溫度
- 溫控(冷氣/暖氣)
- 無溫度控制
- 按地區
- 北美洲
- 美國
- 加拿大
- 墨西哥
- 南美洲
- 巴西
- 秘魯
- 智利
- 阿根廷
- 其他南美國家
- 亞太地區
- 印度
- 中國
- 日本
- 澳洲
- 韓國
- 東南亞(新加坡、馬來西亞、泰國、印尼、越南、菲律賓)
- 其他亞太國家
- 歐洲
- 英國
- 德國
- 法國
- 西班牙
- 義大利
- 比荷盧經濟聯盟(比利時、荷蘭、盧森堡)
- 北歐國家(丹麥、芬蘭、冰島、挪威、瑞典)
- 其他歐洲國家
- 中東和非洲
- 阿拉伯聯合大公國
- 沙烏地阿拉伯
- 南非
- 奈及利亞
- 其他中東和非洲國家
- 北美洲
第6章 競爭情勢
- 市場集中度
- 策略趨勢
- 市佔率分析
- 公司簡介
- DHL Supply Chain
- Kuehne+Nagel International AG
- Maersk Logistics & Services
- HOYER Group
- CH Robinson Worldwide
- BDP International
- DSV(incl. DB Schenker)
- Rhenus SE & Co. KG
- A&R Logistics(Quantix)
- CEVA Logistics(Acquired by CMA CGM)
- Al-Futtaim Logistics
- Petrochem Middle East(PME)
- Sinotrans Chemical Logistics
- Bertschi AG
- Suttons Group
- Den Hartogh Logistics
- Brenntag Logistics Services
- MOL Chemical Tankers
- Stolt-Nielsen Ltd.
- Katoen Natie NV
- Toll Group
- Yusen Logistics Co., Ltd.(Nippon Yusen Group)
- Hellmann Worldwide Logistics SE & Co. KG*
第7章 市場機會與未來展望
According to Mordor Intelligence, the chemical logistics market size is estimated at USD 534.37 billion in 2026, and is expected to reach USD 683.28 billion by 2031, at a CAGR of 5.04% during the forecast period (2026-2031).
This report is Segmented by Service Type (Transportation, Warehousing, and More), by End-User Industry (Pharmaceutical, Cosmetics, Oil & Gas, Specialty Chemicals, and More), by Hazard Class (Hazardous, Non-Hazardous), by Temperature Control (Temperature-Controlled, Non-Temperature-Controlled), by Geography (North America, Europe, and More). The Market Forecasts are Provided in Terms of Value (USD).
Global Chemical Logistics Market Trends and Insights
Expansion of Asian Chemical Production Boosting Long-haul Volumes
India's PCPIR zones and mainland China's capacity additions have shifted export lanes toward Europe and North America, lengthening voyage distances and raising ton-mile demand. Post-Red Sea routing changes have further extended typical Asia-Europe transits, supporting vessel-utilization and intermodal opportunities across rail-sea corridors. Government incentives in India are concentrating output in coastal clusters, yet inland consumption patterns are forcing longer domestic hauls that reward operators with integrated rail, road, and barge solutions.
Rising Use of Multimodal Networks for Hazardous Goods Cost & Safety
Sea-rail systems cut greenhouse-gas emissions by 81% and logistics costs by 70% versus road-only haulage, but adoption hinges on seamless regulatory alignment at modal junctions. The US Federal Railroad Administration highlights dual-mode locomotives and intermittent electrification as cost-effective for bulk chemical corridors when supported by utility partnerships. European operators such as Bertschi already avoid 300,000 tons of CO2 annually through integrated terminals that synchronize rail, barge, and road legs
High Capex-heavy Asset & Insurance Requirements
Stainless-steel ISO tanks, temperature-controlled chassis, and explosion-proof warehouses cost 2-3 times more than general-cargo equivalents. Peacock Container's USD 350 million sustainability-linked facility extension underlines the scale of capital required for fleet renewal. Insurance premiums now absorb up to 5% of revenue for dangerous-goods hauls, magnifying entry barriers.
Other drivers and restraints analyzed in the detailed report include:
- Regulatory Push for Safer, Greener Logistics Assets & Practices
- Outsourcing of Supply-chain Functions to 3PL/4PL Specialists
- Fragmented Multi-jurisdiction Compliance Burdens
For complete list of drivers and restraints, kindly check the Table Of Contents.
Segment Analysis
Transportation retained 65.14% of the chemical logistics market share in 2025 because physical movement remains unavoidable. Yet Other Services, covering blending, compliance management, and orchestration platforms, are forecast to grow at a 6.41% CAGR, reflecting shipper demand for one-stop solutions that reduce administrative burden. Value-added warehousing anchors working-capital programs by positioning inventory near consumption hubs, while digital platforms capture data exhaust that underpins predictive scheduling and emission reporting. DHL's acquisition of CryoPDP added 600,000 temperature-sensitive shipments annually, demonstrating how tuck-ins can accelerate capability expansion.
Second-generation 4PL models monetize orchestration by bundling carrier procurement, control-tower analytics, and compliance documentation in subscription packages. As shippers embed these APIs into enterprise resource planning systems, switching costs rise, allowing logistics providers to defend margins even in commodity haulage. Consequently, the chemical logistics market is witnessing a migration of profit pools from tonnage toward information, risk management, and near-customer customization.
Oil & Gas held 30.57% of the chemical logistics market size in 2025 due to entrenched refinery-to-petrochemical flows, but its low growth exposes providers to price pressure. Specialty Chemicals is slated for a 6.72% CAGR as lithium-ion battery electrolytes and pharmaceutical intermediates demand precision handling, chain-of-custody records, and temperature-stable environments. Argonne National Laboratory projects battery-grade electrolyte output to exceed 1,300 GWh by 2030, multiplying demand for moisture-controlled tank containers.
Pharmaceutical and cosmetics traffic supplies revenue stability because GDP or GMP protocols mandate certified storage and tracked transportation, giving compliant carriers pricing power. Cosmetics raw-materials shifts toward botanical extracts create small-lot, high-frequency lanes that are unsuitable for bulk tanker fleets but ideal for ISO tank relocation and regional depot networks. Thus, the chemical logistics market faces bifurcated growth where low-margin commodity flows coexist with high-service specialty niches requiring differentiated expertise.
Complete Report Scope:
- By Service
- Transportation
- Road
- Rail
- Sea/Ocean
- Air
- Warehousing, Distribution & Inventory Management
- Other Services
- Transportation
- By End-user Industry
- Pharmaceutical
- Cosmetics & Personal Care
- Oil & Gas
- Specialty Chemicals
- Other End-users
- By Hazard Class
- Hazardous Chemicals
- Non-hazardous Chemicals
- By Temperature Control
- Temperature-Controlled (Refrigerated/Heated)
- Non-Temperature-Controlled
- By Geography
- North America
- United States
- Canada
- Mexico
- South America
- Brazil
- Peru
- Chile
- Argentina
- Rest of South America
- Asia-Pacific
- India
- China
- Japan
- Australia
- South Korea
- South East Asia (Singapore, Malaysia, Thailand, Indonesia, Vietnam, Philippines)
- Rest of Asia-Pacific
- Europe
- United Kingdom
- Germany
- France
- Spain
- Italy
- BENELUX (Belgium, Netherlands, Luxembourg)
- NORDICS (Denmark, Finland, Iceland, Norway, Sweden)
- Rest of Europe
- Middle East and Africa
- United Arab Emirates
- Saudi Arabia
- South Africa
- Nigeria
- Rest of Middle East and Africa
- North America
Geography Analysis
Asia-Pacific accounted for 39.21% of global revenue in 2025 and will expand at a 6.31% CAGR through 2031. China's export overcapacity is propelling intra-Asian trade and rerouting cargo toward India and Southeast Asia, creating fresh multimodal lanes where ports, dedicated freight corridors, and coastal shipping converge. India's PCPIR clusters anchor integrated complexes along the western and eastern seaboards, but inland demand growth is extending domestic road-rail legs, amplifying demand for ISO-tank repositioning services.
North America and Europe remain premium markets, underpinned by extensive rail networks, strict safety rules, and high digital-adoption rates. Revised ADR and CLP frameworks in Europe require upgraded fleets and digital labels, encouraging shippers to lock in long-term contracts with certified providers. In North America, integrated rail corridors linking Gulf-Coast petrochemical complexes to Midwest consumers provide cost-effective, low-emission options that favor operators owning trans-load terminals.
South America and Africa offer upside tempered by infrastructure gaps. Prolonged port dwell times in Lagos, Durban, and Mombasa inflate inventory costs and compel carriers to build buffer stocks. The African Continental Free Trade Area aspires to harmonize customs procedures, but interim fragmentation necessitates country-specific expertise and localized partnerships. Despite these hurdles, nearshoring trends in Latin America are driving chemical manufacturers to relocate intermediate-processing stages closer to US buyers, stimulating corridor development for providers with bilingual staff and customs-broker networks.
- DHL Supply Chain
- Kuehne + Nagel International AG
- Maersk Logistics & Services
- HOYER Group
- C.H. Robinson Worldwide
- BDP International
- DSV (incl. DB Schenker)
- Rhenus SE & Co. KG
- A&R Logistics (Quantix)
- CEVA Logistics (Acquired by CMA CGM)
- Al-Futtaim Logistics
- Petrochem Middle East (PME)
- Sinotrans Chemical Logistics
- Bertschi AG
- Suttons Group
- Den Hartogh Logistics
- Brenntag Logistics Services
- MOL Chemical Tankers
- Stolt-Nielsen Ltd.
- Katoen Natie N.V.
- Toll Group
- Yusen Logistics Co., Ltd. (Nippon Yusen Group)
- Hellmann Worldwide Logistics SE & Co. KG*
Additional Benefits:
- The market estimate (ME) sheet in Excel format
- 3 months of analyst support
TABLE OF CONTENTS
1 Introduction
- 1.1 Study Assumptions & Market Definition
- 1.2 Scope of the Study
2 Research Methodology
3 Executive Summary
4 Market Landscape
- 4.1 Market Overview
- 4.2 Market Drivers
- 4.2.1 Expansion of Asian chemical production boosting long-haul volumes
- 4.2.2 Rising use of multimodal networks for hazardous-goods cost & safety
- 4.2.3 Regulatory push for safer, greener logistics assets & practices
- 4.2.4 Outsourcing of supply-chain functions to 3PL/4PL specialists
- 4.2.5 Low-carbon methanol & bio-based chains spawning new corridors
- 4.2.6 AI-driven visibility & digital-twin platforms enabling real-time compliance
- 4.3 Market Restraints
- 4.3.1 High capex-heavy asset & insurance requirements
- 4.3.2 Fragmented multi-jurisdiction compliance burdens
- 4.3.3 Fuel-price volatility compressing operator margins
- 4.3.4 Shortage of certified hazmat drivers in emerging markets
- 4.4 Value / Supply-Chain Analysis
- 4.5 Technological Innovations in the Industry
- 4.6 Government Regulations and Policies
- 4.7 Porter's Five Forces
- 4.7.1 Threat of New Entrants
- 4.7.2 Bargaining Power of Buyers/Consumers
- 4.7.3 Bargaining Power of Suppliers
- 4.7.4 Threat of Substitute Services (In-house Logistics)
- 4.7.5 Intensity of Competitive Rivalry
- 4.8 Impact of Geopolitical Events on the Market
5 Market Size & Growth Forecasts (Value)
- 5.1 By Service
- 5.1.1 Transportation
- 5.1.1.1 Road
- 5.1.1.2 Rail
- 5.1.1.3 Sea/Ocean
- 5.1.1.4 Air
- 5.1.2 Warehousing, Distribution & Inventory Management
- 5.1.3 Other Services
- 5.1.1 Transportation
- 5.2 By End-user Industry
- 5.2.1 Pharmaceutical
- 5.2.2 Cosmetics & Personal Care
- 5.2.3 Oil & Gas
- 5.2.4 Specialty Chemicals
- 5.2.5 Other End-users
- 5.3 By Hazard Class
- 5.3.1 Hazardous Chemicals
- 5.3.2 Non-hazardous Chemicals
- 5.4 By Temperature Control
- 5.4.1 Temperature-Controlled (Refrigerated/Heated)
- 5.4.2 Non-Temperature-Controlled
- 5.5 By Geography
- 5.5.1 North America
- 5.5.1.1 United States
- 5.5.1.2 Canada
- 5.5.1.3 Mexico
- 5.5.2 South America
- 5.5.2.1 Brazil
- 5.5.2.2 Peru
- 5.5.2.3 Chile
- 5.5.2.4 Argentina
- 5.5.2.5 Rest of South America
- 5.5.3 Asia-Pacific
- 5.5.3.1 India
- 5.5.3.2 China
- 5.5.3.3 Japan
- 5.5.3.4 Australia
- 5.5.3.5 South Korea
- 5.5.3.6 South East Asia (Singapore, Malaysia, Thailand, Indonesia, Vietnam, Philippines)
- 5.5.3.7 Rest of Asia-Pacific
- 5.5.4 Europe
- 5.5.4.1 United Kingdom
- 5.5.4.2 Germany
- 5.5.4.3 France
- 5.5.4.4 Spain
- 5.5.4.5 Italy
- 5.5.4.6 BENELUX (Belgium, Netherlands, Luxembourg)
- 5.5.4.7 NORDICS (Denmark, Finland, Iceland, Norway, Sweden)
- 5.5.4.8 Rest of Europe
- 5.5.5 Middle East and Africa
- 5.5.5.1 United Arab Emirates
- 5.5.5.2 Saudi Arabia
- 5.5.5.3 South Africa
- 5.5.5.4 Nigeria
- 5.5.5.5 Rest of Middle East and Africa
- 5.5.1 North America
6 Competitive Landscape
- 6.1 Market Concentration
- 6.2 Strategic Moves
- 6.3 Market Share Analysis
- 6.4 Company Profiles (includes Global level Overview, Market level overview, Core Segments, Financials as available, Strategic Information, Market Rank/Share for key companies, Products & Services, and Recent Developments)
- 6.4.1 DHL Supply Chain
- 6.4.2 Kuehne + Nagel International AG
- 6.4.3 Maersk Logistics & Services
- 6.4.4 HOYER Group
- 6.4.5 C.H. Robinson Worldwide
- 6.4.6 BDP International
- 6.4.7 DSV (incl. DB Schenker)
- 6.4.8 Rhenus SE & Co. KG
- 6.4.9 A&R Logistics (Quantix)
- 6.4.10 CEVA Logistics (Acquired by CMA CGM)
- 6.4.11 Al-Futtaim Logistics
- 6.4.12 Petrochem Middle East (PME)
- 6.4.13 Sinotrans Chemical Logistics
- 6.4.14 Bertschi AG
- 6.4.15 Suttons Group
- 6.4.16 Den Hartogh Logistics
- 6.4.17 Brenntag Logistics Services
- 6.4.18 MOL Chemical Tankers
- 6.4.19 Stolt-Nielsen Ltd.
- 6.4.20 Katoen Natie N.V.
- 6.4.21 Toll Group
- 6.4.22 Yusen Logistics Co., Ltd. (Nippon Yusen Group)
- 6.4.23 Hellmann Worldwide Logistics SE & Co. KG*
7 Market Opportunities & Future Outlook
- 7.1 White-space & Unmet-need Assessment

 英國化學品物流:市場佔有率分析、產業趨勢與統計、成長預測(2026-2031 年)歐洲化學品物流:市場佔有率分析、產業趨勢與統計及成長預測(2026-2031 年)
 零售油氣物流市場-全球預測,2026-2032年印度特種油品物流:市場佔有率分析、產業趨勢與統計及成長預測(2026-2031)中國化工物流:市場佔有率分析、產業趨勢與統計及成長預測(2026-2031)印度化學品物流:市場佔有率分析、產業趨勢與統計及成長預測(2026-2031)德國化學品物流:市場佔有率分析、產業趨勢與統計及成長預測(2026-2031)
 全球化學品物流市場零售油氣物流:市佔率分析、產業趨勢及統計、成長預測(2026-2031)
 化學品物流市場規模、佔有率、趨勢和預測:按類型、服務和地區分類,2026-2034年