


 |
市場調查報告書
商品編碼
2062181
零售油氣物流:市佔率分析、產業趨勢及統計、成長預測(2026-2031)Retail Oil And Gas Logistics - Market Share Analysis, Industry Trends & Statistics, Growth Forecasts (2026 - 2031) |
||||||

※ 本網頁內容可能與最新版本有所差異。詳細情況請與我們聯繫。
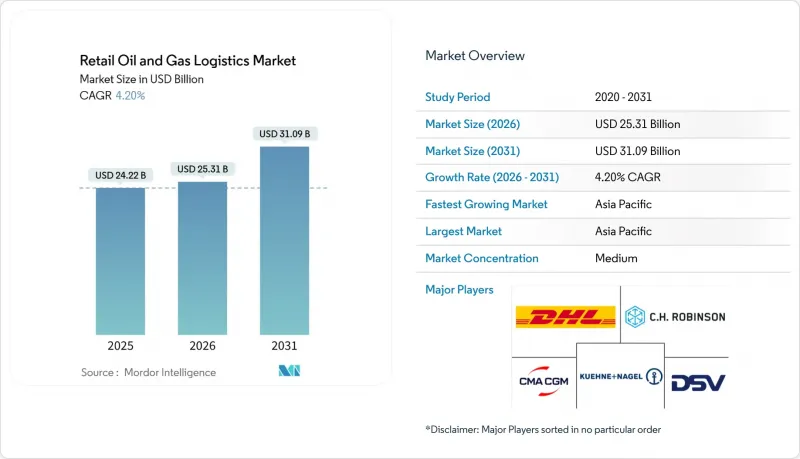
根據 Mordor Intelligence 預測,零售石油和天然氣物流市場規模將從 2025 年的 242.2 億美元和 2026 年的 253.1 億美元成長到 2031 年的 310.9 億美元,2026 年至 2031 年的年複合成長率(CAGR)為 4.20%。
儘管表面成長率看起來不高,但隨著供應商從單純的運輸轉向整合燃料配送、加油站庫存管理以及可再生能源混合燃料的溫控處理等綜合服務,一場根本性的結構性轉變正在悄悄發生。本報告按服務類型(運輸、倉儲及其他)、燃料類型(汽油、柴油及其他)、最終用戶(燃料零售商、便利商店和大賣場、商用零售客戶及其他)以及地區(北美、南美、亞太、歐洲、中東和非洲)進行細分。市場預測以美元計價。
全球零售油氣物流市場的趨勢與洞察
加油站及零售模式(加油+食品服務)的成長
大型零售商正在重新設計加油站,將加油泵與快餐店和便利商店區域整合在一起,以提高單店銷售額,並要求採用雙溫控配送,以保障燃油品質和食品新鮮度。沃爾瑪計畫在2025年整修45家加油站,並將業務拓展至450多家多品類門市,這顯示整合式門市模式如何能增加客流量和平均交易額。整合式模式需要同步排班、共用庫存管理系統以及培養多技能員工,這反過來又使第三方物流供應商能夠透過增值配套服務來獲利。
更嚴格的硫含量和辛烷值標準將需要特殊的處理方法。
美國環保署(EPA)於2025年1月生效的法規加強了對取樣、檢測和線上混合的控制,並強制要求油罐車進行隔艙分隔,以及在貨物之間進行嚴格的清洗。諸如必維國際檢驗集團(Bureau Veritas)和SGS等認證機構報告稱,為消除貸款機構和保險公司的疑慮,檢驗審計的需求激增。擁有實驗室設施和隔熱隔艙的物流公司在降低污染風險的同時,也獲得了更高的溢價。
危險品運輸船隊的保險費正在飆升。
在發生備受矚目的事故後,保險公司收緊了合約條款,並將液化天然氣和可再生燃料運輸船的保費提高了30%至40%。科菲維爾資源公司(Coffeyville Resources)獲準豁免安全技術要求,例如加裝增強型煞車燈,象徵保險公司為降低風險、重獲定價權所做的努力。運力有限的小規模運輸公司正面臨利潤率下降的壓力,甚至被迫退出市場。同時,監管審查力度加大和保險索賠增加持續給承保策略帶來壓力,使得運輸公司面臨著如何在風險控制和價格競爭力之間取得平衡的挑戰。
細分市場分析
附加價值服務年成長率 (CAGR) 達到 7.07%,在零售油氣物流市場中成長最高。這是因為托運人現在願意為端到端的可視性、現場品質檢驗和自動化庫存匹配支付溢價。艾默生的雷達稱重系統展示了數位化終端如何提高周轉率並減少損失。到 2025 年,運輸仍將佔零售油氣物流市場佔有率的 52.89%,但司機短缺和保險成本上漲迫使承運商利用人工智慧路線規劃器和無人機提供的庫存數據來提高運轉率。由於用於可再生燃料和生質燃料混合與分離的冷藏庫的引入,與倉儲營運相關的零售油氣物流市場正在擴張。
另一個影響是客戶合約續約率的提高。隨著監控入口網站和自動計費功能整合到零售商的ERP系統中,轉換成本增加,合約續約率也隨之提高。計量型的油庫無需資本投資即可擴展網路覆蓋範圍,符合輕資產策略。同時,管線營運商透過樞紐輻射模式確保穩定的收入來源,並透過統一的服務等級協定(SLA)整合最後一公里油罐車調度,從而保障從乾線到加油口的整個服務品質。
區域分析
預計到2025年,亞太地區將佔全球零售油氣物流市場收入的33.75%,並在2031年之前以5.15%的複合年成長率成長。隨著中國和印度煉油廠產能的擴張,管道運輸將沿海產品輸送至內陸,提高了對油輪合作夥伴的服務水準要求。農村地區通訊基礎設施薄弱阻礙了即時調度的實施,但低地球軌道衛星供應商承諾將改善覆蓋範圍,即使在服務不足的地區也能實現預測性補給。
在北美,隨著運輸量趨於穩定,物流正經歷現代化轉型。五條新的產品平臺將於2024年投入運作,這將使運輸方式從成本高昂的鐵路運輸轉向其他運輸方式。司機短缺加劇了工資壓力,而可再生柴油的引入則為恆溫卡車開闢了新的市場。稅額扣抵的波動正在影響運輸路線的獲利能力,促使承運商保持靈活且不依賴特定燃料的車輛配置。
歐洲正面臨環境政策的挑戰。德國在歐洲清潔氫能聯盟的指導下制定了一項價值200億歐元(約230億美元)的氫能網路計劃,旨在展望混合燃料物流的未來。嚴格的責任法推高了保險成本,並加速了小規模運輸公司之間的合併。中東和非洲正利用其生產國地位整合下游供應鏈,CEVA在沙烏地阿拉伯的合資企業是國際與本地合作的典範,它結合了資本和市場知識。南美洲的乙醇運輸路線正在催生對專用罐車的需求,並將巴西打造為生質燃料出口中心。
其他好處:
- Excel格式的市場預測(ME)表
- 3個月的分析師支持
目錄
第1章:引言
- 市場分析與定義的前提條件
- 分析範圍
第2章 分析方法
第3章執行摘要
第4章 市場狀況
- 市場概覽
- 市場促進因素
- 將加油站和零售(燃料+食品服務)結合的商業模式正在發展壯大。
- 對硫含量和辛烷值更嚴格的規定促進了專門的處理方法的發展。
- 發展中地區產品平臺路的擴張
- 利用無人機對偏遠加油站進行庫存盤點
- 獨立零售商的計量型共用倉庫平台。
- 可再生柴油燃料混合物的溫控物流
- 市場限制因素
- 危險品運輸船隊的保險費正在上漲。
- 合格油罐車駕駛人短缺影響了運輸的可靠性。
- 本地商店網路連線不佳,限制了直播服務。
- 可再生燃料稅額扣抵波動較大,使得路線規劃變得困難。
- 價值鍊和供應鏈分析
- 監理情勢
- 技術展望
- 波特五力分析
- 地緣政治事件對市場的影響
第5章:預測市場規模與成長率
- 按服務類型
- 運輸
- 路
- 鐵路
- 海上和內陸(包括駁船)
- 倉儲/倉庫
- 附加價值服務和其他服務(測量、品質檢測)
- 運輸
- 按燃料類型
- 汽油
- 柴油引擎
- 噴射機燃料
- 液化石油氣(LPG)
- 液化天然氣(LNG)
- 其他(瀝青、潤滑劑)
- 最終用戶
- 燃料零售商(加油站)
- 便利商店和大賣場
- 商用零售客戶(礦業、農業、建築、政府、航空、航運等)
- 其他
- 按地區
- 北美洲
- 美國
- 加拿大
- 墨西哥
- 南美洲
- 巴西
- 秘魯
- 智利
- 阿根廷
- 其他南美國家
- 亞太地區
- 印度
- 中國
- 日本
- 澳洲
- 韓國
- 東南亞(新加坡、馬來西亞、泰國、印尼、越南、菲律賓)
- 其他亞太國家
- 歐洲
- 英國
- 德國
- 法國
- 西班牙
- 義大利
- 比荷盧經濟聯盟(比利時、荷蘭、盧森堡)
- 北歐國家(丹麥、芬蘭、冰島、挪威、瑞典)
- 其他歐洲國家
- 中東和非洲
- 阿拉伯聯合大公國
- 沙烏地阿拉伯
- 南非
- 奈及利亞
- 其他中東和非洲國家
- 北美洲
第6章 競爭情勢
- 市場集中度
- 策略趨勢
- 市佔率分析
- 公司簡介
- DHL Group
- CMA CGM Group
- Gulf Agency Company Limited
- DSV
- Kuehne+Nagel
- CH Robinson Worldwide Inc.
- Bollore SE
- Expeditors International
- Geodis
- UPS Supply Chain Solutions
- Noatum Holdings SLU
- Reliance Logistics Group Inc.
- Halcon Primo Logistics Pte Ltd.
- BDP International Inc.
- Berrio Logistics India Pvt. Ltd.
- NYK(Yusen Logistics Co. Ltd.)
- Tudor International Freight Ltd.
- Riada Shipping and Logistics
- AP Moller-Maersk
- GAC Logistics
第7章 市場機會與未來展望
According to Mordor Intelligence, the retail oil and gas logistics market size is projected to expand from USD 24.22 billion in 2025 and USD 25.31 billion in 2026 to USD 31.09 billion by 2031, registering a CAGR of 4.20% between 2026 and 2031.
Muted headline growth conceals sweeping structural changes as providers transition from pure transport to integrated offerings that blend fuel delivery, forecourt inventory orchestration, and temperature-controlled handling for renewable blends. This report is Segmented by Service Type (Transportation, Storage & Warehousing, and More), by Fuel Type (Gasoline, Diesel, and More), by End User (Fuel Retailers, Convenience Stores & Hypermarkets, Industrial Retail Customers, Others), and by Region (North America, South America, Asia-Pacific, Europe, Middle East and Africa). The Market Forecasts are Provided in Terms of Value (USD).
Global Retail Oil And Gas Logistics Market Trends and Insights
Growth of Integrated Forecourt-Retail Formats (Fuel + Foodservice)
Large retailers are redesigning forecourts to merge fuel pumps with quick-service restaurants and convenience aisles, boosting per-site turnover and necessitating dual-temperature deliveries that protect both fuel quality and food freshness. Walmart's remodeling of 45 fuel sites in 2025 en route to more than 450 multi-category locations illustrates how unified footprints lift traffic and basket size. Integrated formats require synchronized scheduling, shared inventory systems, and cross-trained crews, enabling third-party logisticians to monetize premium bundled services.
Stricter Sulfur & Octane Standards Driving Specialized Handling
The EPA's January 2025 rule tightened sampling, testing, and inline-blending controls, forcing segmentation of tanker compartments and rigorous clean-down between loads. Certification agencies such as Bureau Veritas and SGS report surging demand for verification audits that reassure lenders and insurers. Logistics firms equipped with lab services and insulated compartments command price premiums while shrinking contamination risk.
Rising Insurance Premiums for Hazardous-Cargo Tanker Fleets
Underwriters tightened terms after high-profile incidents, lifting premiums by 30-40% on LNG and renewable fuel tankers. Safety tech exemptions, such as enhanced brake lights approved for Coffeyville Resources, showcase efforts to curb risk and regain pricing leverage. Smaller carriers lacking spread capacity face margin squeeze or exit. Meanwhile, evolving regulatory scrutiny and rising claims frequency continue to pressure underwriting strategies, challenging carriers to balance risk mitigation with competitive pricing.
Other drivers and restraints analyzed in the detailed report include:
- Expansion of Refined-Product Pipeline Networks in Developing Regions
- Drone-Assisted Stock Audits at Remote Filling Stations
- Certified Tanker-Driver Shortages Affecting Delivery Reliability
For complete list of drivers and restraints, kindly check the Table Of Contents.
Segment Analysis
Value-added services posted a 7.07% CAGR, the fastest within the retail oil and gas logistics market share, as shippers pay premiums for end-to-end visibility, onsite quality testing, and automated inventory reconciliation. Emerson's radar-based gauging illustrates how digital terminals lift turnover and shrink losses. Transportation still represents 52.89% of the retail oil and gas logistics market share in 2025, yet driver shortages and insurance costs force carriers to boost utilization via AI route planners and drone-fed stock data. The retail oil and gas logistics market size, tied to storage and warehousing, benefits from renewable blend segregation and chilled bays for biofuels.
Second-order effects include sticky customer contracts: once monitoring portals and automated billing are embedded in a retailer's ERP, switching costs rise, lifting renewal rates. Pay-per-use depots extend network reach without capital outlay, aligning with asset-light strategies. Meanwhile, pipeline operators capture steady tariff revenue in hub-and-spoke models, integrating last-mile tanker dispatch under unified SLAs to protect quality from trunk line to nozzle.
Geography Analysis
Asia-Pacific generated 33.75% of the retail oil and gas logistics market revenue in 2025 and is set for a 5.15% CAGR through 2031. China and India expand refinery throughput, while pipeline corridors move coastal output inland, tightening service-level requirements for tank-truck partners. Poor rural connectivity tempers live dispatch adoption, but low-earth-orbit satellite providers promise coverage upgrades that can unlock predictive replenishment in underserved provinces.
North America exhibits logistic modernization amid mature volumes. Five new product pipelines came online in 2024, rebalancing modes away from costly rail legs. Driver shortages heighten wage pressure, while renewable diesel adoption opens niches for thermostatic trucking. Volatile tax credits disrupt route economics, prompting carriers to maintain flexible fuel-agnostic fleets.
Europe confronts green-policy imperatives. Germany's EUR 20 billion (USD 23 billion) hydrogen grid plan under the European Clean Hydrogen Alliance foreshadows future blend logistics. Stringent liability laws magnify insurance costs, catalyzing mergers of sub-scale haulers. Middle East and Africa leverage producer status to integrate downstream supply chains; CEVA's Saudi JV exemplifies international-local tie-ups that fuse capital with market knowledge. South America's ethanol corridors create specialized tank demands, positioning Brazil as a biofuel export node.
- DHL Group
- CMA CGM Group
- Gulf Agency Company Limited
- DSV
- Kuehne + Nagel
- C.H. Robinson Worldwide Inc.
- Bollore SE
- Expeditors International
- Geodis
- UPS Supply Chain Solutions
- Noatum Holdings SLU
- Reliance Logistics Group Inc.
- Halcon Primo Logistics Pte Ltd.
- BDP International Inc.
- Berrio Logistics India Pvt. Ltd.
- NYK (Yusen Logistics Co. Ltd.)
- Tudor International Freight Ltd.
- Riada Shipping and Logistics
- A.P. Moller - Maersk
- GAC Logistics
Additional Benefits:
- The market estimate (ME) sheet in Excel format
- 3 months of analyst support
TABLE OF CONTENTS
1 Introduction
- 1.1 Study Assumptions & Market Definition
- 1.2 Scope of the Study
2 Research Methodology
3 Executive Summary
4 Market Landscape
- 4.1 Market Overview
- 4.2 Market Drivers
- 4.2.1 Growth of Integrated Forecourt-Retail Formats (Fuel + Foodservice)
- 4.2.2 Stricter Sulfur & Octane Standards Driving Specialized Handling
- 4.2.3 Expansion of Refined-Product Pipeline Networks in Developing Regions
- 4.2.4 Drone-Assisted Stock Audits at Remote Filling Stations
- 4.2.5 Pay-Per-Use Shared Depot Platforms for Independent Retailers
- 4.2.6 Temperature-Controlled Logistics for Renewable-Diesel Blends
- 4.3 Market Restraints
- 4.3.1 Rising Insurance Premiums for Hazardous-Cargo Tanker Fleets
- 4.3.2 Certified Tanker-Driver Shortages Affecting Delivery Reliability
- 4.3.3 Poor Digital Connectivity at Rural Outlets Limiting Live Dispatch
- 4.3.4 Volatile Renewable-Fuel Tax Credits Complicating Route Planning
- 4.4 Value / Supply-Chain Analysis
- 4.5 Regulatory Landscape
- 4.6 Technological Outlook
- 4.7 Porter's Five Forces
- 4.7.1 Threat of New Entrants
- 4.7.2 Bargaining Power of Suppliers
- 4.7.3 Bargaining Power of Buyers
- 4.7.4 Threat of Substitutes
- 4.7.5 Competitive Rivalry
- 4.8 Impact of Geo-Political Events on the Market
5 Market Size & Growth Forecasts
- 5.1 By Service Type (Value)
- 5.1.1 Transportation
- 5.1.1.1 Road
- 5.1.1.2 Rail
- 5.1.1.3 Sea and Inland (Including Barge)
- 5.1.2 Storage & Warehousing
- 5.1.3 Value-added Services and Others(metering, quality testing)
- 5.1.1 Transportation
- 5.2 By Fuel Type (Value)
- 5.2.1 Gasoline
- 5.2.2 Diesel
- 5.2.3 Jet Fuel
- 5.2.4 Liquefied Petroleum Gas (LPG)
- 5.2.5 Liquefied Natural Gas (LNG)
- 5.2.6 Others (bitumen, lubricants)
- 5.3 By End User (Value)
- 5.3.1 Fuel Retailers (Fuel Stations)
- 5.3.2 Convenience Stores & Hypermarkets
- 5.3.3 Industrial Retail Customers (Mining, Agriculture, Construction, Government, Aviation, Marine, etc.)
- 5.3.4 Others
- 5.4 By Geography (Value)
- 5.4.1 North America
- 5.4.1.1 United States
- 5.4.1.2 Canada
- 5.4.1.3 Mexico
- 5.4.2 South America
- 5.4.2.1 Brazil
- 5.4.2.2 Peru
- 5.4.2.3 Chile
- 5.4.2.4 Argentina
- 5.4.2.5 Rest of South America
- 5.4.3 Asia-Pacific
- 5.4.3.1 India
- 5.4.3.2 China
- 5.4.3.3 Japan
- 5.4.3.4 Australia
- 5.4.3.5 South Korea
- 5.4.3.6 South East Asia (Singapore, Malaysia, Thailand, Indonesia, Vietnam, and Philippines)
- 5.4.3.7 Rest of Asia-Pacific
- 5.4.4 Europe
- 5.4.4.1 United Kingdom
- 5.4.4.2 Germany
- 5.4.4.3 France
- 5.4.4.4 Spain
- 5.4.4.5 Italy
- 5.4.4.6 BENELUX (Belgium, Netherlands, and Luxembourg)
- 5.4.4.7 NORDICS (Denmark, Finland, Iceland, Norway, and Sweden)
- 5.4.4.8 Rest of Europe
- 5.4.5 Middle East and Africa
- 5.4.5.1 United Arab Emirates
- 5.4.5.2 Saudi Arabia
- 5.4.5.3 South Africa
- 5.4.5.4 Nigeria
- 5.4.5.5 Rest of Middle East And Africa
- 5.4.1 North America
6 Competitive Landscape
- 6.1 Market Concentration
- 6.2 Strategic Moves
- 6.3 Market Share Analysis
- 6.4 Company Profiles (includes Global level Overview, Market level overview, Core Segments, Financials as available, Strategic Information, Market Rank/Share for key companies, Products & Services, and Recent Developments)
- 6.4.1 DHL Group
- 6.4.2 CMA CGM Group
- 6.4.3 Gulf Agency Company Limited
- 6.4.4 DSV
- 6.4.5 Kuehne + Nagel
- 6.4.6 C.H. Robinson Worldwide Inc.
- 6.4.7 Bollore SE
- 6.4.8 Expeditors International
- 6.4.9 Geodis
- 6.4.10 UPS Supply Chain Solutions
- 6.4.11 Noatum Holdings SLU
- 6.4.12 Reliance Logistics Group Inc.
- 6.4.13 Halcon Primo Logistics Pte Ltd.
- 6.4.14 BDP International Inc.
- 6.4.15 Berrio Logistics India Pvt. Ltd.
- 6.4.16 NYK (Yusen Logistics Co. Ltd.)
- 6.4.17 Tudor International Freight Ltd.
- 6.4.18 Riada Shipping and Logistics
- 6.4.19 A.P. Moller - Maersk
- 6.4.20 GAC Logistics
7 Market Opportunities & Future Outlook
- 7.1 White-space & Unmet-need Assessment

 英國化學品物流:市場佔有率分析、產業趨勢與統計、成長預測(2026-2031 年)化學品物流:市場佔有率分析、產業趨勢與統計、成長預測(2026-2031)歐洲化學品物流:市場佔有率分析、產業趨勢與統計及成長預測(2026-2031 年)
 零售油氣物流市場-全球預測,2026-2032年印度特種油品物流:市場佔有率分析、產業趨勢與統計及成長預測(2026-2031)中國化工物流:市場佔有率分析、產業趨勢與統計及成長預測(2026-2031)印度化學品物流:市場佔有率分析、產業趨勢與統計及成長預測(2026-2031)德國化學品物流:市場佔有率分析、產業趨勢與統計及成長預測(2026-2031)
 全球化學品物流市場
 化學品物流市場規模、佔有率、趨勢和預測:按類型、服務和地區分類,2026-2034年