


 |
市場調查報告書
商品編碼
2100006
用於加工應用的半導體裝置:市場佔有率分析、行業趨勢和統計數據以及成長預測(2026-2031 年)Asia-Pacific Semiconductor Device For Processing Applications - Market Share Analysis, Industry Trends & Statistics, Growth Forecasts (2026 - 2031) |
||||||

※ 本網頁內容可能與最新版本有所差異。詳細情況請與我們聯繫。
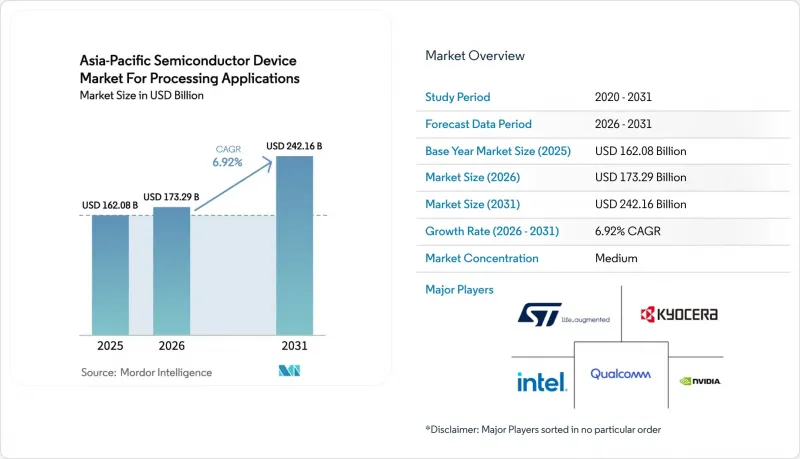
根據 Mordor Intelligence 預測,亞太地區用於加工應用的半導體裝置市場規模預計在 2025 年達到 1,620.8 億美元,從 2026 年的 1732.9 億美元成長到 2031 年的 2,421.6 億美元,在預測期(2026-2031 年為複合年成長率 6.92% 2031 年)。
本報告按裝置類型(離散半導體、光電元件等)、處理架構(x86、ARM等)、製造流程(7奈米以下、8-16奈米等)、終端用戶產業(家用電子電器、汽車、工業/製造等)和地區進行細分。市場預測以美元計價。
亞太地區半導體元件加工應用市場洞察與趨勢
對人工智慧/機器學習和資料中心的需求激增
生成式人工智慧叢集採用特定領域的加速器,每個GPU整合八個HBM3顯存堆疊,這推高了記憶體的平均售價(ASP),並增加了對先進封裝能力的要求。台積電已決定投資110億美元在熊本新建一座工廠,以支援2.5D和3D整合,並計劃在2024年將其CoWoS生產線產能提升50%。雲端服務供應商正在部署基於ARM架構的Graviton和Ampere CPU,預計到2024年,這些CPU將佔亞太地區實例推出的28%,這意味著x86架構的使用量將大幅下降。中國的「自主人工智慧」政策要求國內雲端服務供應商使用國產推理晶片,即使是14奈米製程也不例外,這使得市場需求轉向了中芯國際和華為海思。同時,每機架接近 100 kW 的功率密度對新加坡和馬來西亞來說是有利的,因為在這些國家,液冷基礎設施與晶片組裝製程位於同一設施內。
5G相容物聯網設備的普及
2024年,亞太地區的蜂巢式物聯網連線數超過21億。這主要得益於公共產業部署支援NB-IoT的智慧電錶,以及物流公司將Cat-M模組整合到低溫運輸貨櫃中。每個終端包含3到5個半導體,但由於平均售價(ASP)低於1美元,利潤空間十分有限,大規模生產正轉向運作成熟的28奈米和40奈米生產線的代工廠。印度的5G網路已覆蓋400個城市,推動了對來自台灣和日本專業製造商的6GHz以下射頻濾波器的需求。汽車遠端資訊處理模組正在向5G RedCap過渡,這一轉變對瑞薩電子和恩智浦半導體來說是一個利好,這兩家公司已獲得功能安全認證。
先進製造設備的出口限制與地緣政治
2024年10月,美國禁止為中國晶圓廠提供深紫外線浸沒式掃描器的維護服務,日本也限制了23種半導體製造設備的出口。這迫使中國晶圓代工廠依賴14奈米節點的多重圖形化,導致晶圓週期延長,電晶體成本增加三分之一。由於台積電和三星已領先了62組高數值孔徑極紫外光刻系統,ASML的訂單積壓已達18個月,即使放寬許可限制,短期內新參與企業也無法獲得產能。
細分市場分析
在亞太半導體裝置市場,預計到2025年,積體電路的銷售額將佔總銷售額的45.12%,並有望在2031年之前以7.85%的複合年成長率成長,超過離散半導體。這主要得益於超大規模資料超大規模資料中心業者從基板級向單晶片AI加速器轉型。邏輯產品是推動這一快速成長的主要動力,其中NVIDIA的H200採用台積電N3E製程節點,其每瓦功耗的TOPS比上一代產品提升了40%,從而推高了晶圓的平均價格。
儘管離散半導體、光電子元件和感測器合計佔據了54.88%的總合佔有率,但競爭正在減緩平均售價(ASP)的成長,導致其複合年成長率僅為6.35%,預計將落後於積體電路(IC)的成長速度。碳化矽元件的銷售受到150毫米晶圓供不應求的限制,導致前置作業時間長達52週。同時,共封裝光學元件的採用材料清單(BOM)成本降低了22%,對光電領域的利潤率帶來了壓力。
到 2025 年,ARM 設計預計將佔據 72.45% 的市場佔有率,推動智慧型手機、雲端伺服器和汽車運算的發展,而隨著各國政府優先考慮指令集自主性,RISC-V 核心預計將以 8.48% 的複合年成長率成長。
亞太地區RISC-V解決方案的半導體裝置市場正從小規模的基數成長,這得歸功於免版稅授權和快速成熟的工具鏈。阿里巴巴的「宣鐵C920」以更低的運行成本提供與ARM Cortex-A76相當的整數運算性能,而印度的「Shakti」核心則為國防航空電子設備提供了安全可靠的替代方案。相較之下,x86架構仍主要應用於高效能伺服器,市佔率僅17.85%,且成長速度最慢,複合年成長率僅4.62%。
其他好處:
- Excel格式的市場預測(ME)表
- 3個月的分析師支持
目錄
第1章:引言
- 研究假設和市場定義
- 調查範圍
第2章:調查方法
第3章執行摘要
第4章 市場狀況
- 市場概覽
- 市場促進因素
- 人工智慧/機器學習和資料中心需求激增
- 5G相容物聯網設備的普及
- 政府對亞太地區製造業的支持措施
- 記憶體週期恢復和 HBM 採用
- 促進RISC-V在中國和印度的本地化
- 面向東南亞智慧工廠的邊緣人工智慧模組
- 市場限制因素
- 供應鏈脆弱性和材料短缺
- 尖端技術出口管制的地緣政治
- 亞太地區製造實驗室的極紫外光刻技術人才短缺
- 大型鑄造廠面臨缺水風險
- 產業價值鏈分析
- 技術展望
- 監理情勢
- 波特五力分析
- 宏觀經濟因素對市場的影響
- 半導體代工廠的現狀
第5章 市場規模與成長預測
- 依設備類型
- 法令半導體
- 光電子學
- 感應器
- 積體電路
- 模擬
- 邏輯
- 記憶
- Micro
- 透過處理架構
- x86
- ARM
- RISC-V
- MIPS 和其他處理架構
- 透過製造程序
- 小於 7 奈米(N7、N5、N3 及以下)
- 8~16 nm
- 22~28 nm
- 32奈米以上(傳統製程及特殊應用)
- 按最終用戶行業分類
- 家用電子產品
- 車
- 工業和製造業
- 資料中心和雲
- 電訊
- 醫療設備
- 航太/國防
- 其他終端用戶產業
- 國家
- 中國
- 印度
- 日本
- 韓國
- 台灣
- 新加坡
- 其他亞太國家
第6章 競爭情勢
- 市場集中度
- 策略趨勢
- 市佔率分析
- 公司簡介
- Taiwan Semiconductor Manufacturing Company Limited
- Samsung Electronics Co., Ltd.
- SK hynix Inc.
- Intel Corporation
- NVIDIA Corporation
- Qualcomm Incorporated
- Micron Technology, Inc.
- Advanced Micro Devices, Inc.
- Broadcom Inc.
- Texas Instruments Incorporated
- STMicroelectronics NV
- NXP Semiconductors NV
- Renesas Electronics Corporation
- Infineon Technologies AG
- Kyocera Corporation
- Rohm Co., Ltd.
- Toshiba Electronic Devices and Storage Corporation
- ON Semiconductor Corporation
- Xilinx Inc.(AMD Adaptive Computing)
- United Microelectronics Corporation
- Semiconductor Manufacturing International Corporation
- GlobalFoundries Inc.
- Powerchip Semiconductor Manufacturing Co. Ltd.
- ASE Technology Holding Co., Ltd.
第7章 市場機會與未來展望
According to Mordor Intelligence, the Asia-Pacific semiconductor device market size for processing applications was valued at USD 162.08 billion in 2025 and estimated to grow from USD 173.29 billion in 2026 to reach USD 242.16 billion by 2031, at a CAGR of 6.92% during the forecast period (2026-2031).
This report is Segmented by Device Type (Discrete Semiconductors, Optoelectronics, and More), Processing Architecture (x86, ARM, and More), Fabrication Node (Below 7 Nm, 8-16 Nm, and More), End-User Industry (Consumer Electronics, Automotive, Industrial and Manufacturing, and More), and Geography. The Market Forecasts are Provided in Terms of Value (USD).
Insights and Trends of Asia-Pacific Semiconductor Device Market For Processing Applications
AI/ML and Data-center Demand Surge
Generative-AI clusters deploy domain-specific accelerators that pair every GPU with eight HBM3 stacks, boosting memory ASPs and stressing advanced packaging capacity.TSMC increased CoWoS lines by 50% in 2024 and committed USD 11 billion for an additional site in Kumamoto to support 2.5D and 3D integration. Cloud operators are rolling out ARM-based Graviton and Ampere CPUs, which captured 28% of Asia-Pacific instance launches in 2024, underscoring the shift away from x86. China's sovereign-AI mandate obliges local clouds to adopt domestically fabricated inference chips even at 14-nanometer nodes, redirecting demand toward SMIC and Huawei HiSilicon. Meanwhile, rack-power densities approaching 100 kW favor Singapore and Malaysia, where liquid-cooling infrastructure is colocated with chip-assembly operations.
5G-enabled IoT Device Proliferation
Asia-Pacific surpassed 2.1 billion cellular-IoT connections in 2024 as utilities deployed NB-IoT smart meters and logistics firms embedded Cat-M modules in cold-chain containers. Each endpoint carries three to five semiconductors, yet sub-USD 2 ASPs compress margins, pushing high-volume work to foundries running mature 28- and 40-nanometer lines. India's 5G rollout covers 400 cities, driving demand for sub-6 GHz RF filters sourced from Taiwanese and Japanese specialists. Automotive telematics modules are migrating to 5G RedCap, a shift that benefits Renesas and NXP owing to functional-safety credentials.
Export-control Geopolitics on Advanced Tools
The United States barred servicing of DUV immersion scanners at Chinese fabs in October 2024 and Japan restricted 23 classes of chip-equipment exports, forcing Chinese foundries to rely on multi-patterning at 14 nanometer nodes, lengthening wafer cycles and inflating cost-per-transistor by one-third. With TSMC and Samsung pre-ordering 62 High-NA EUV systems, ASML's backlog stretches 18 months, leaving no near-term capacity for new entrants even if licenses loosen.
Other drivers and restraints analyzed in the detailed report include:
- Government Fab Incentives Across Asia-Pacific
- Memory-cycle Rebound and HBM Adoption
- EUV-talent Bottleneck in Asia-Pacific Fabs
For complete list of drivers and restraints, kindly check the Table Of Contents.
Segment Analysis
Integrated circuits accounted for 45.12% of 2025 revenue within the Asia-Pacific semiconductor device market and will advance at an 7.85% CAGR through 2031, outpacing discretes as hyperscalers migrate from board-level to monolithic AI accelerators. Logic products lead the surge, with NVIDIA's H200 on TSMC's N3E node delivering 40% more TOPS-per-watt than its predecessor, pushing average wafer values higher.
Discrete semiconductors, optoelectronics, and sensors collectively held a 54.88% share; however, growth trails ICs at a 6.35% CAGR, as price competition dilutes ASP gains. Silicon-carbide device revenue is constrained by 150 mm wafer shortages, which stretch lead times to 52 weeks, while co-packaged optics trim the module bill of materials by 22%, compressing photonics margins.
ARM designs commanded 72.45% share in 2025, powering smartphones, cloud servers and automotive compute, whereas RISC-V cores will expand at 8.48% CAGR as governments prioritize instruction-set autonomy.
The Asia-Pacific semiconductor device market size for RISC-V solutions is growing from a small base, benefiting from royalty-free licensing and rapidly maturing toolchains. Alibaba's Xuantie C920 matched ARM Cortex-A76 integer performance at lower recurring fees, while India's Shakti core delivers secure variants for defense avionics. In contrast, x86 clings to an 17.85% share confined to high-performance servers, posting the slowest 4.62% CAGR.
Complete Report Scope:
- By Device Type
- Discrete Semiconductors
- Optoelectronics
- Sensors
- Integrated Circuits
- Analog
- Logic
- Memory
- Micro
- By Processing Architecture
- x86
- ARM
- RISC-V
- MIPS and Other Processing Architectures
- By Fabrication Node
- Below 7 nm (N7, N5, N3 and below)
- 8-16 nm
- 22-28 nm
- Above 32 nm (Legacy and Specialty)
- By End-User Industry
- Consumer Electronics
- Automotive
- Industrial and Manufacturing
- Data Centre and Cloud
- Telecommunications
- Healthcare Devices
- Aerospace and Defence
- Other End-User Industries
- By Country
- China
- India
- Japan
- South Korea
- Taiwan
- Singapore
- Rest of Asia-Pacific
List of Companies Covered in this Report:
- Taiwan Semiconductor Manufacturing Company Limited
- Samsung Electronics Co., Ltd.
- SK hynix Inc.
- Intel Corporation
- NVIDIA Corporation
- Qualcomm Incorporated
- Micron Technology, Inc.
- Advanced Micro Devices, Inc.
- Broadcom Inc.
- Texas Instruments Incorporated
- STMicroelectronics N.V.
- NXP Semiconductors N.V.
- Renesas Electronics Corporation
- Infineon Technologies AG
- Kyocera Corporation
- Rohm Co., Ltd.
- Toshiba Electronic Devices and Storage Corporation
- ON Semiconductor Corporation
- Xilinx Inc. (AMD Adaptive Computing)
- United Microelectronics Corporation
- Semiconductor Manufacturing International Corporation
- GlobalFoundries Inc.
- Powerchip Semiconductor Manufacturing Co. Ltd.
- ASE Technology Holding Co., Ltd.
Additional Benefits:
- The market estimate (ME) sheet in Excel format
- 3 months of analyst support
TABLE OF CONTENTS
1 INTRODUCTION
- 1.1 Study Assumptions and Market Definition
- 1.2 Scope of the Study
2 RESEARCH METHODOLOGY
3 EXECUTIVE SUMMARY
4 MARKET LANDSCAPE
- 4.1 Market Overview
- 4.2 Market Drivers
- 4.2.1 AI/ML And Data-Centre Demand Surge
- 4.2.2 5G-Enabled IoT Device Proliferation
- 4.2.3 Government Fab Incentives Across Asia-Pacific
- 4.2.4 Memory-Cycle Rebound And HBM Adoption
- 4.2.5 RISC-V Localisation Push In China And India
- 4.2.6 Edge-AI Modules For Smart Factories In SEA
- 4.3 Market Restraints
- 4.3.1 Supply-Chain Fragility And Material Shortages
- 4.3.2 Export-Control Geopolitics On Advanced Tools
- 4.3.3 EUV-Talent Bottleneck In Asia-Pacific Fabs
- 4.3.4 Water-Scarcity Risk At Leading Foundries
- 4.4 Industry Value Chain Analysis
- 4.5 Technological Outlook
- 4.6 Regulatory Landscape
- 4.7 Porter's Five Forces Analysis
- 4.7.1 Threat of New Entrants
- 4.7.2 Bargaining Power of Buyers
- 4.7.3 Bargaining Power of Suppliers
- 4.7.4 Threat of Substitutes
- 4.7.5 Competitive Rivalry
- 4.8 Impact of Macroeconomic Factors on the Market
- 4.9 Semiconductor Foundry Landscape
5 MARKET SIZE AND GROWTH FORECASTS (VALUE)
- 5.1 By Device Type
- 5.1.1 Discrete Semiconductors
- 5.1.2 Optoelectronics
- 5.1.3 Sensors
- 5.1.4 Integrated Circuits
- 5.1.4.1 Analog
- 5.1.4.2 Logic
- 5.1.4.3 Memory
- 5.1.4.4 Micro
- 5.2 By Processing Architecture
- 5.2.1 x86
- 5.2.2 ARM
- 5.2.3 RISC-V
- 5.2.4 MIPS and Other Processing Architectures
- 5.3 By Fabrication Node
- 5.3.1 Below 7 nm (N7, N5, N3 and below)
- 5.3.2 8-16 nm
- 5.3.3 22-28 nm
- 5.3.4 Above 32 nm (Legacy and Specialty)
- 5.4 By End-User Industry
- 5.4.1 Consumer Electronics
- 5.4.2 Automotive
- 5.4.3 Industrial and Manufacturing
- 5.4.4 Data Centre and Cloud
- 5.4.5 Telecommunications
- 5.4.6 Healthcare Devices
- 5.4.7 Aerospace and Defence
- 5.4.8 Other End-User Industries
- 5.5 By Country
- 5.5.1 China
- 5.5.2 India
- 5.5.3 Japan
- 5.5.4 South Korea
- 5.5.5 Taiwan
- 5.5.6 Singapore
- 5.5.7 Rest of Asia-Pacific
6 COMPETITIVE LANDSCAPE
- 6.1 Market Concentration
- 6.2 Strategic Moves
- 6.3 Market Share Analysis
- 6.4 Company Profiles (includes Global level Overview, Market level overview, Core Segments, Financials as available, Strategic Information, Market Rank/Share for key companies, Products and Services, and Recent Developments)
- 6.4.1 Taiwan Semiconductor Manufacturing Company Limited
- 6.4.2 Samsung Electronics Co., Ltd.
- 6.4.3 SK hynix Inc.
- 6.4.4 Intel Corporation
- 6.4.5 NVIDIA Corporation
- 6.4.6 Qualcomm Incorporated
- 6.4.7 Micron Technology, Inc.
- 6.4.8 Advanced Micro Devices, Inc.
- 6.4.9 Broadcom Inc.
- 6.4.10 Texas Instruments Incorporated
- 6.4.11 STMicroelectronics N.V.
- 6.4.12 NXP Semiconductors N.V.
- 6.4.13 Renesas Electronics Corporation
- 6.4.14 Infineon Technologies AG
- 6.4.15 Kyocera Corporation
- 6.4.16 Rohm Co., Ltd.
- 6.4.17 Toshiba Electronic Devices and Storage Corporation
- 6.4.18 ON Semiconductor Corporation
- 6.4.19 Xilinx Inc. (AMD Adaptive Computing)
- 6.4.20 United Microelectronics Corporation
- 6.4.21 Semiconductor Manufacturing International Corporation
- 6.4.22 GlobalFoundries Inc.
- 6.4.23 Powerchip Semiconductor Manufacturing Co. Ltd.
- 6.4.24 ASE Technology Holding Co., Ltd.
7 MARKET OPPORTUNITIES AND FUTURE OUTLOOK
- 7.1 White-space and Unmet-Need Assessment

 中國半導體裝置:市場佔有率分析、產業趨勢與統計及成長預測(2026-2031)亞太地區半導體元件:市場佔有率分析、產業趨勢與統計及成長預測(2026-2031)北美和南美半導體裝置市場:市場佔有率分析、行業趨勢和統計數據以及成長預測(2026-2031 年)日本半導體裝置:市場佔有率分析、產業趨勢與統計、成長預測(2026-2031)歐洲半導體裝置:市場佔有率分析、產業趨勢與統計數據、成長預測(2026-2031)光敏半導體元件:市場佔有率分析、產業趨勢與統計、成長預測(2026-2031)
 2034年工業半導體市場預測-全球分析(依元件類型、材料、封裝類型、功率等級、晶圓尺寸、應用、終端用戶產業、製造模式、銷售管道和地區分類)
 半導體拆解服務市場:全球市場預測,2026-2032年
 光敏半導體元件市場:依元件、材料、應用、工作模式、最終用戶、國家及地區分類-全球產業分析、市場規模、市場佔有率及2026年至2033年預測半導體裝置:市場佔有率分析、產業趨勢與統計、成長預測(2025-2030)